Following net purchases in October, central banks returned to net selling in November. Global official reserves declined by 6.5t during the month. Like August and September, when central banks were also net sellers, this was the result of continued moderate buying being offset by a few sizeable sales.
Central banks return to net sales in November
Krishan Gopaul
Senior Analyst, EMEA World Gold Council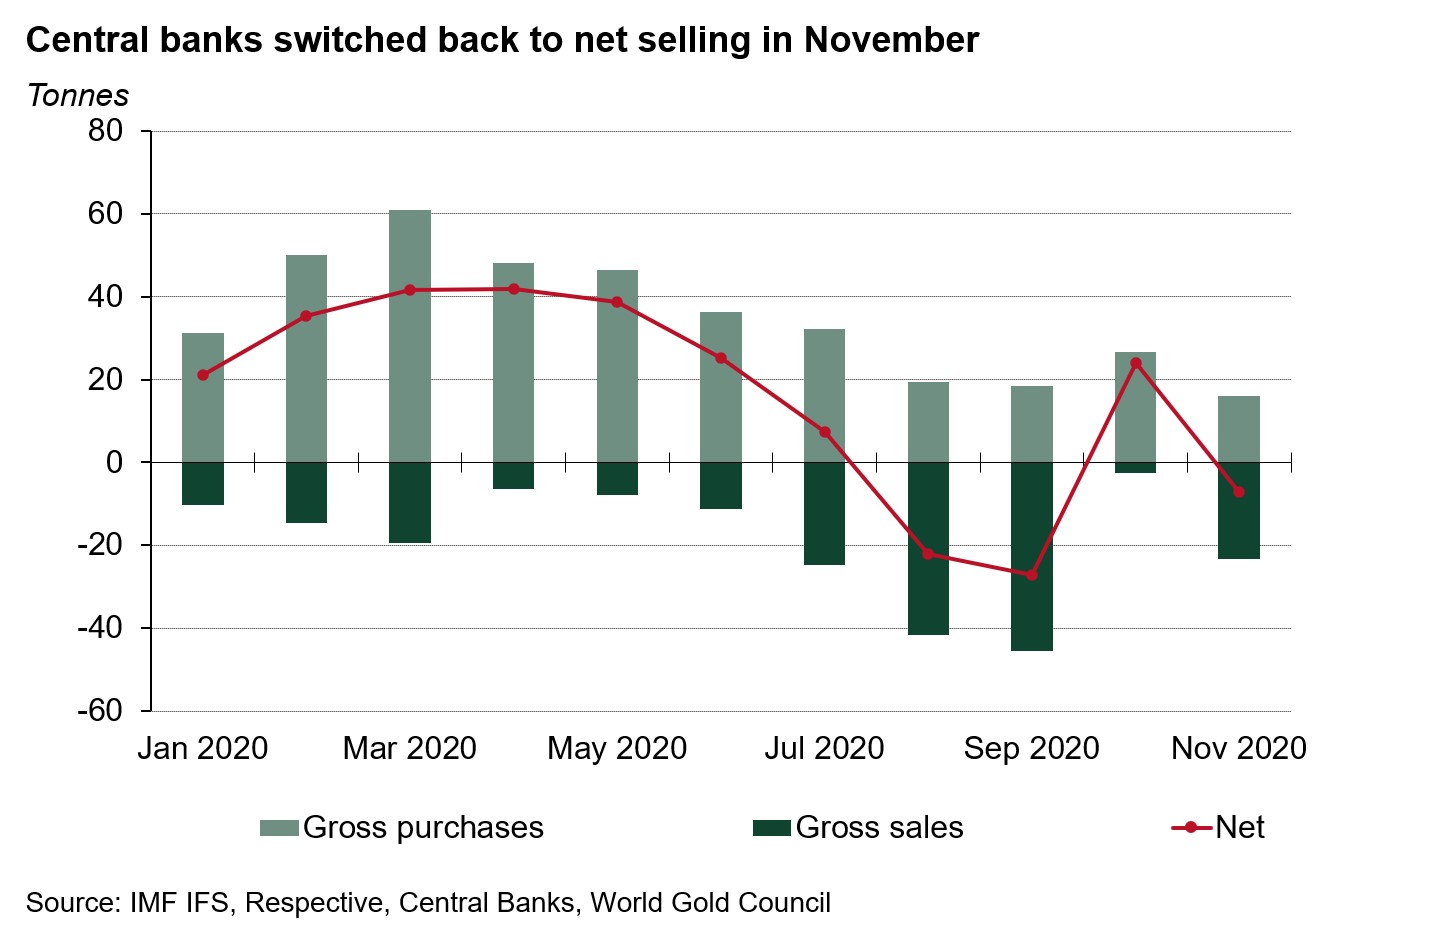
At a country-level, we can see that gross purchases amounted to 16t in November, broadly consistent with the levels of gold accumulation in August and September. Uzbekistan added another 8.4t to their gold reserves, while Qatar (3.1t), India (2.8t), and Kazakhstan (1.7t) were the other countries to increase official gold reserves in November. But this buying was more than offset by gross sales of 23.3t. In Turkey, higher local demand led to increased trading between domestic commercial banks and the central bank resulting in a 20.9t reduction in its reserves. This was not a strategic decision to lower gold reserves by the central bank. Mongolia was the other notable seller, reducing official gold reserves by 2.4t.
Overall, central bank demand has become more variable in recent months, oscillating between net purchases and net sales. This marks a change from the consistent buying we have become used to from this sector of the market. It therefore poses a couple of important questions.
Firstly, does this mean that the existing trend in net buying is now making way for a new trend? Or no trend at all? Since 2010, when central banks became consistent quarterly net buyers, there have nevertheless been several instances of monthly net sales, although not quite as concentrated as in H2 2020. And, with the exception of Turkey, these recent larger sales may be a consequence of the heightened uncertainty and fiscal pressure generated by the COVID-19 pandemic. Gold outperformed many other traditional reserve assets in 2020, giving central banks additional firepower to stabilise markets and currencies. But it may be too soon to confidently conclude whether the previous trend of consistent net buying will continue, or if it has ended and a new trend has emerged. The data for December and early 2021 will be crucial to help build a bigger picture.
Secondly, does this signal a longer-term change in attitude towards gold from central banks? We do not believe that central banks have shifted their mindset towards gold. As noted above, gold’s performance in 2020 (+25%) boosted reserve portfolios when it was needed. Our central bank survey conducted last year showed that gold’s role as a risk-mitigation asset is highly valued. While some uncertainty has eased in recent months (e.g., the US election and Brexit), the economic impact of the pandemic still poses significant risks which need to be managed.
Despite recent net selling, central banks remain on course to finish 2020 as net purchasers, making it 11 consecutive years since they were last net sellers on an annual basis. We will cover central bank demand for 2020 in more detail in the next edition of Gold Demand Trends, which will be published at the end of January.
Our central bank data for November 2020 is now available on Goldhub.
Central banks begin 2021 with net sales in January
Krishan Gopaul
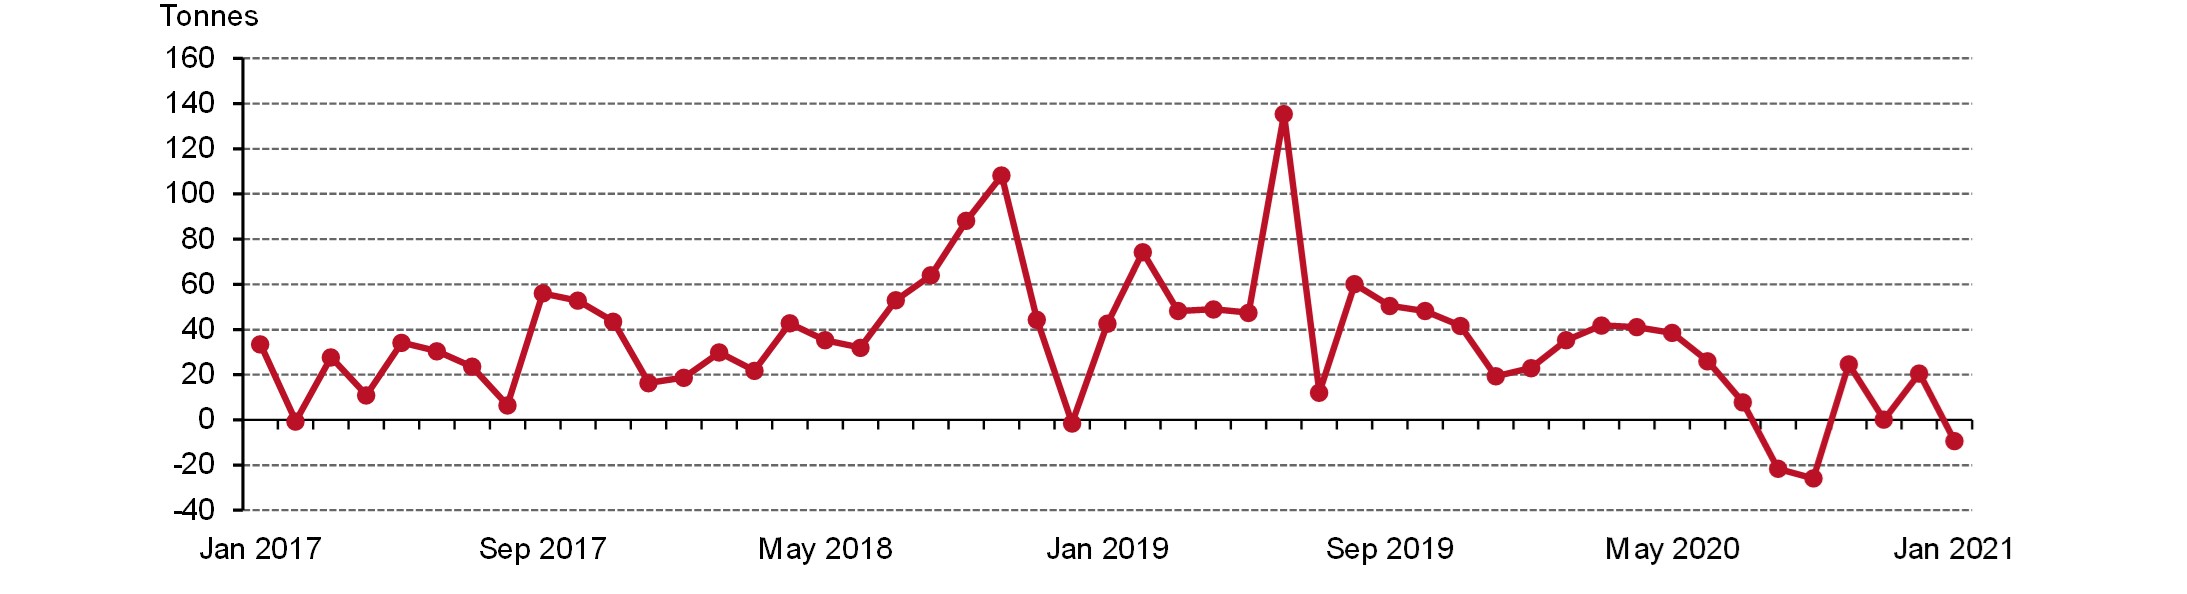
Senior Analyst, EMEA World Gold CouncilWhile 2020 marked the eleventh consecutive year of central bank net purchases, it nonetheless finished on a somewhat uncertain note. A slowdown in the pace of purchasing by several banks in the second half of the year coincided with a sizeable pick-up in sales by others, causing overall central bank demand to swing between modest net purchases and sales. As I wrote in my last blog post on this topic, more data was needed to see how things might develop going forward.
Central banks continue to swing between net purchases and sales
Monthly central bank demand on a net basis
Source: IMF IFS, Respective Central Banks, World Gold Council
Since then, we have seen net purchases of 20.6t in December 2020, and now we have published data showing that central banks switched back to small net sales of 9.4t in January. This is the third month of net sales since June 2020 and the smallest in scale.
Activity on both sides was limited: just four central banks accounted for the overall change. On the buying side, Uzbekistan (8.1t) and Kazakhstan (2.8t), both gold producers and frequent purchasers in recent years, were the only banks to meaningfully increase gold reserves. On the other hand, Turkey (-17.2t) and Russia (-3.1t) were the notable sellers. Russia’s sale is likely related to the January announcement that the central bank will begin minting a 2021 commemorative gold coin. This is part of the bank’s 2021 coin-mining plan, which itself is a part of its long-standing coin-minting programme and similar to programmes from other central banks, such as the Bundesbank, which often result in small sporadic sales.
So, what does the latest information tell us, and does it help make an assessment on the prospects for central bank demand in 2021?
While these are useful data points, it may still be too early to determine the direction of any new trend. As we noted in our recent Gold Demand Trends report: “These intermittent sales have resulted in a more complex picture of central bank demand at the end of 2020, having created a small interruption in the pattern of consistent buying since 2010”. We will continue to monitor the demand from central banks over the next several months to see if the picture becomes any clearer.
Until then, our expectation remains that central banks will stay net buyers in 2021, albeit at a moderate pace which is below the record levels seen previous years. For example, early data for February indicates that the Reserve Bank of India added 11.2t to its gold reserves. While this data is not yet reflected on our monthly statistics, it highlights the relevant role that gold plays in foreign reserve management.
As we look forward, we believe that the possibility of capital inflows into emerging markets and the low interest rate environment may lead to central banks adding gold for diversification purposes.
Our detailed central bank statistics can be found here.
Central bank demand remained muted in February
Krishan Gopaul
Senior Analyst, EMEA World Gold CouncilOur monthly central bank statistics have been updated today, to include initial February data reported by the IMF and respective central banks. Collectively, central banks tipped back into net purchases during the month: 8.8t were added to global gold reserves. Buying from India (11.2t), Uzbekistan (7.2t), Kazakhstan (1.6t), and Colombia (0.5t) outweighed the only notable sale of gold by Turkey (-11.7t).1 Year-to-date, this puts total global central bank net sales at 16.7t, the weakest start in over a decade.
The picture for central bank demand remains somewhat uncertain, with the sector bobbing between net sales and net purchases in recent months. As a reminder, central banks sold a net 25.5t of gold in January, as combined sales from Turkey and Russia outweighed buying elsewhere.2
Taking a broader look at central bank activity, we do not believe that these recent net sales should be conflated with a change in sentiment towards gold as a reserve asset, for two key reasons:
- Selling has predominately come from a small group of central banks whose chunky sales have tipped the balance in certain months. And, as we have discussed before, these sales have been driven by several different factors, such as economic hardship caused by the pandemic, heightened local gold demand, and coin-minting programmes.
- We continue to see consistent moderate net buying from other countries, albeit that these have been similarly concentrated amongst a small number of constituent banks.
Sporadic large sales have tipped the balance in recent months
Central bank net purchases/sales by country*
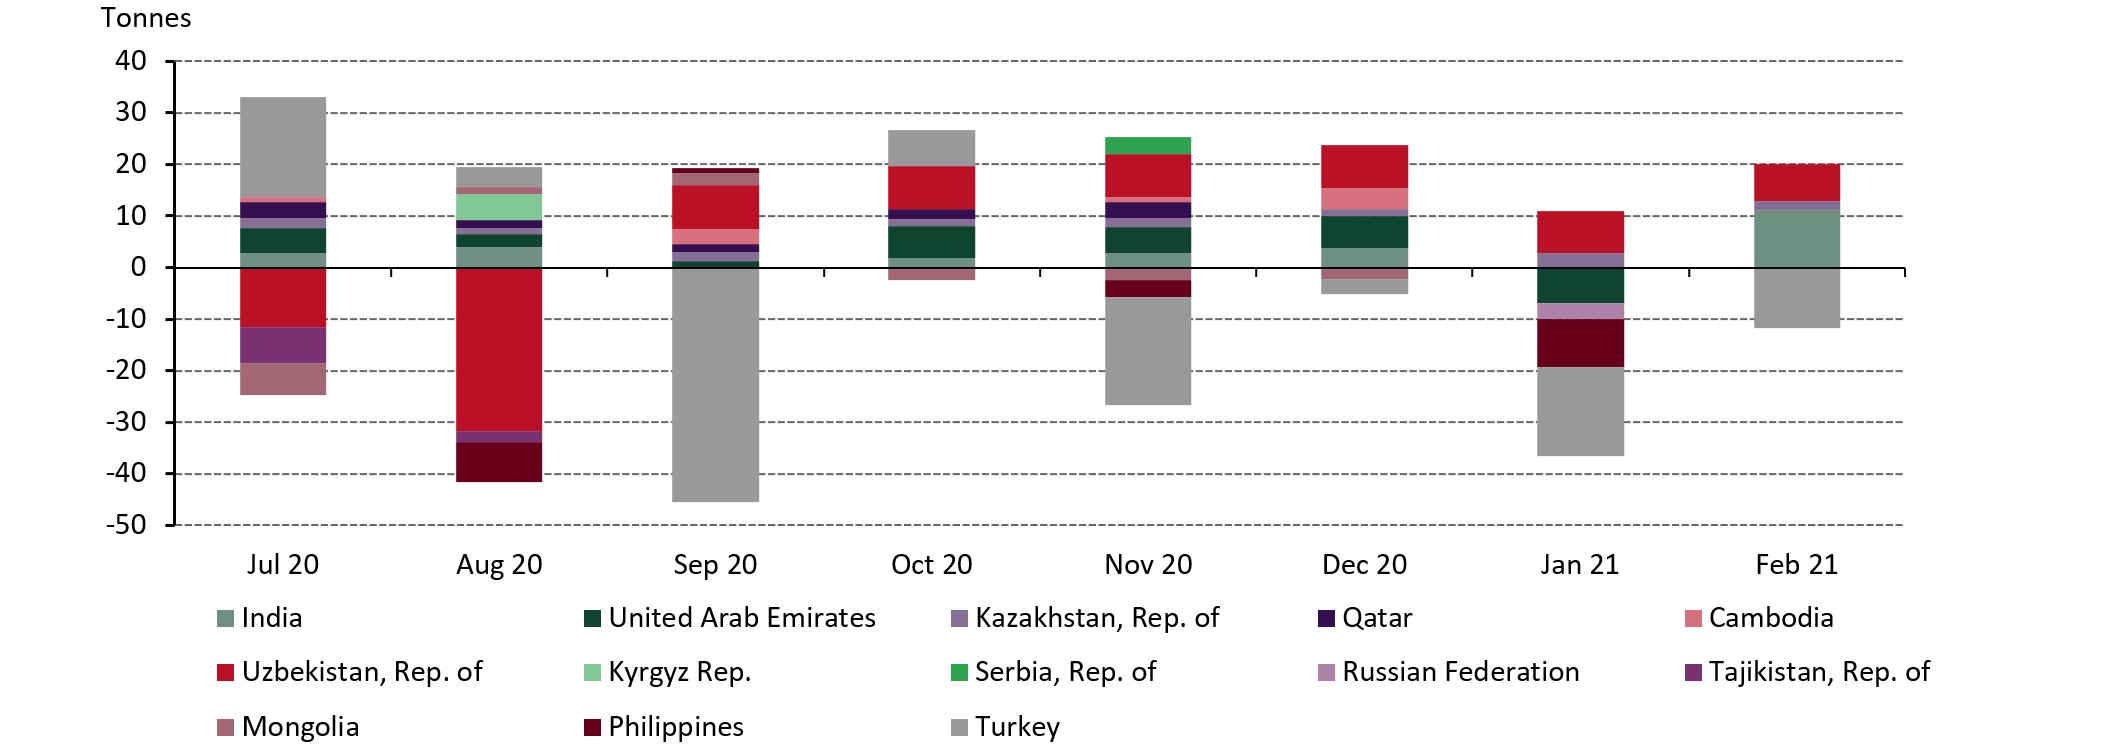
*Chart shows countries that have seen purchases/sales of at least one tonne in at least one month during the period
Source: IMF IFS, Respective Central Banks, World Gold Council
Our central banks team is currently busy conducting our annual central bank survey – which assesses attitudes and intentions towards gold amongst the central bank community. This will help us understand current activity and how it may develop. The 2021 survey results will be published in Q2, and previous survey findings can be found on Goldhub.
Our expectation remains that central banks will be net purchasers in 2021, but the immediate outlook for central bank demand remains finely balanced. Full Q1 data will be published in our upcoming Gold Demand Trends report which will be published at the end of April.
Footnotes
1The Reserve Bank of India has continued purchasing gold in March, with the latest available data indicating 6.5t (net) have been added to gold reserves by 26 March.
2The net sales figure for January has been updated – from 9.4t – according to the latest data available from the IMF. This will include data for countries which had not yet reported when the previous update was published.
Central and Eastern European central banks significantly expand their gold reserves
Dr Tatiana Fic
Director, Central Banks and Public Policy World Gold CouncilLast month Hungary tripled its gold reserves. The decision by the National Bank of Hungary (Magyar Nemzeti Bank, MNB) to increase its gold reserves to 94.5 tonnes, a historic high, follows a 10-fold increase in Hungary’s gold holdings in the last quarter of 2018.
Both increases were made for strategic reasons and were driven by Hungary’s long-term policy objectives. The MNB increased its gold reserves in an effort to strengthen the stability of the country’s financial system during times of geopolitical uncertainty and structural changes in the international financial system. The role of gold as a safe haven and “a major line of defence under extreme market conditions” also factored in the decision about the purchases.1
Risk management in the wake of the Covid pandemic2 and its severe impact on the global economy, played a key role in the MNB’s decision to increase gold reserves earlier this year. The unprecedented response of monetary and fiscal policies to the pandemic has resulted in sharp increases in government debts and rising inflationary pressures, bringing to the fore the role of gold as a safe haven and a long-term store of value.3
Central and Eastern European (CEE) gold holdings on the rise
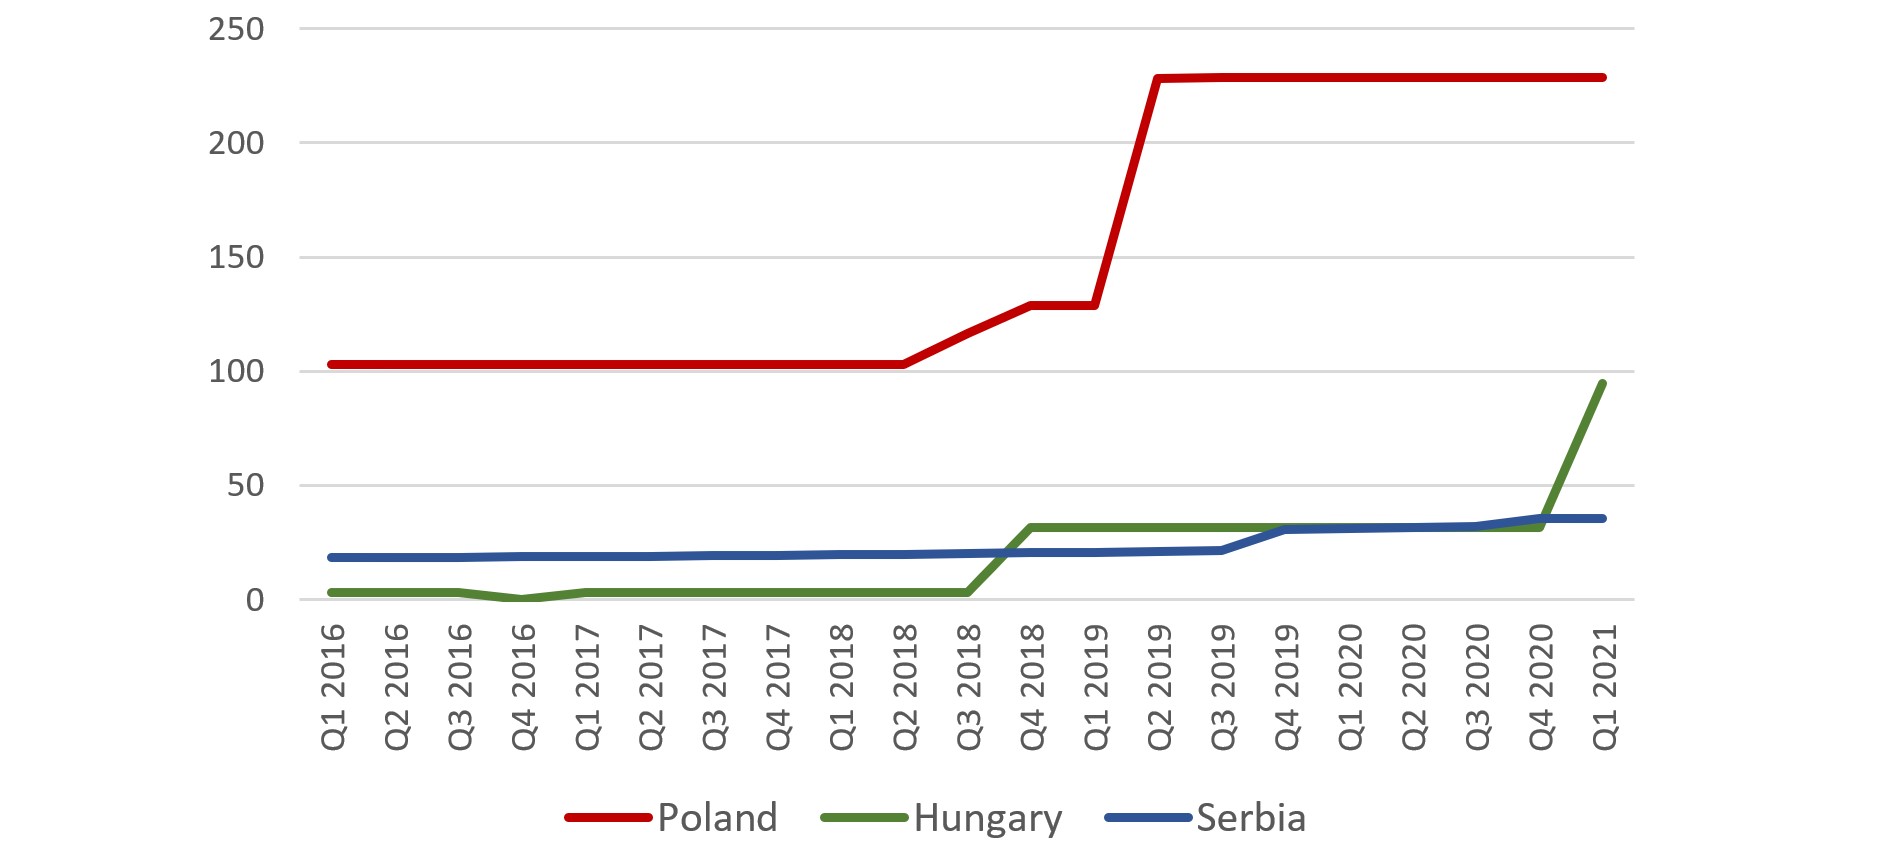
Hungary is not the only country in the region that has increased its gold reserves recently. Over the last three years the activity of CEE banks in the gold market has risen remarkably, with Poland, and Serbia - previously part of the former Yugoslavia – adding significant amounts of gold to their reserves (see Chart 1).
Chart 1. Gold holdings in tonnes 2016-2021
Source: World Gold Council
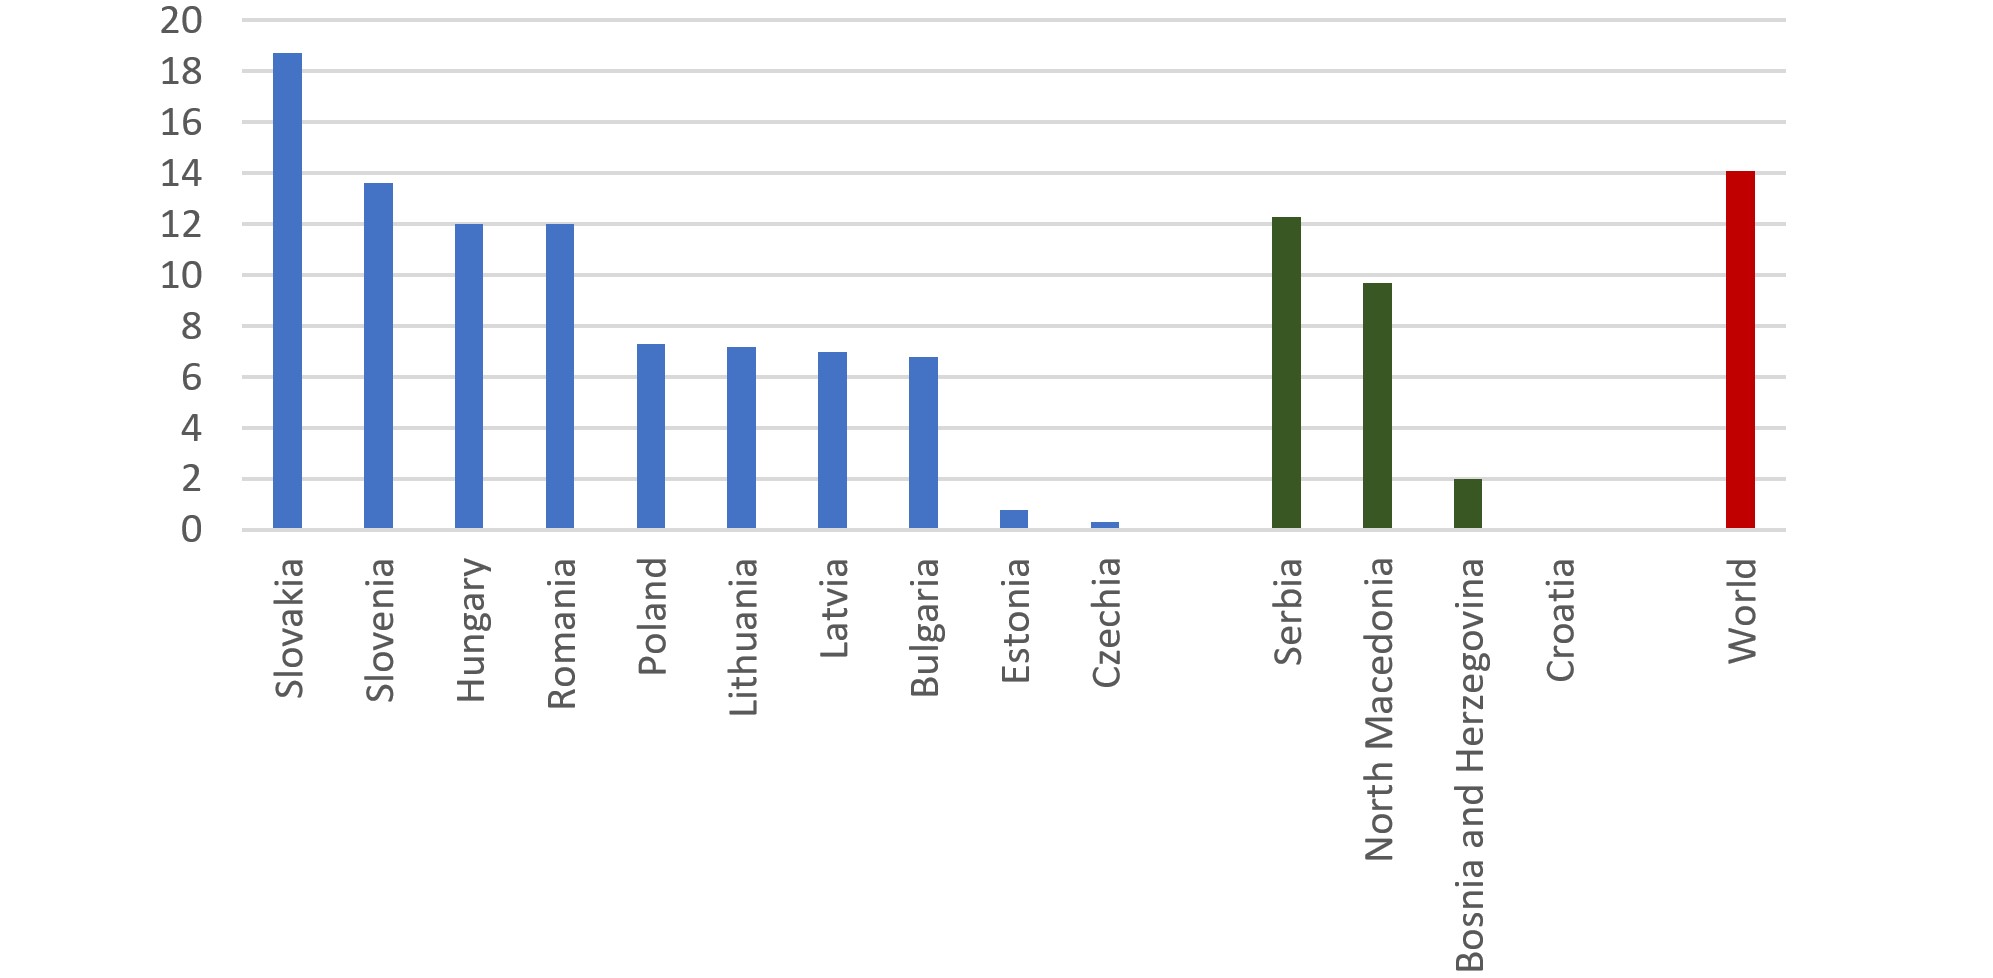
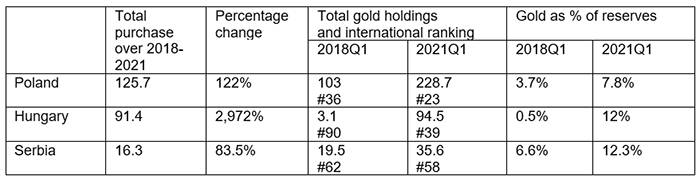
The National Bank of Poland (Narodowy Bank Polski, NBP) increased its gold holdings by 25.7 tonnes in the second half of 2018, and a further 100 tonnes in the second quarter of 2019, the largest global single gold purchase of the last decade.4 The strategic decision by the NBP to more than double its reserves was driven by the bank’s objective to diversify the geopolitical risk and strengthen the buffer protecting the country’s financial stability.5 The NBP regards gold as an asset that increases the country’s credibility and safeguards the robustness of its financial system during times of shocks and tensions. As a result of the purchases, which were made possible by a significant increase in Polish foreign reserves, the share of gold in Poland’s reserves has increased substantially; it is now closer to the world’s average (which in the fourth quarter of 2020 stood at 14.1%, see Chart 2), while the volume of Poland’s gold holdings has become highest in the region (see Table 1).
The National Bank of Serbia (Narodna Banka Srbije, NBS) has been gradually accumulating gold, adding about 0.2 tonnes a quarter since 2011. In 2019 the NBS stepped up its purchases, buying 9.2 tonnes in the third quarter of 2019 and a further 3.5 tonnes in the fourth quarter of 2020, doubling the share of gold in its reserves (see Table 1). The key driver behind these purchases was to shore up the stability of the Serbian financial system during a time of uncertainty and to guard against the heightened risk of a global crisis.6
Chart 2. Gold as % of total reserves of Central and Eastern European countries of the EU and countries of the former Yugoslavia
Source: World Gold Council
Source: World Gold Council
Poland, Hungary and Serbia increased their gold holdings quite sharply. The 100-tonne purchase by the NBP and the 63-tonne purchase by the MNB mark two of the three largest single monthly central bank gold buys over the last decade (see Chart 3). The NBP’s and MNB’s decisions to purchase gold were strategic in nature, taking into account the rapid structural changes in the global economy, such as shifts in the international financial system and global consequences of the pandemic.
Chart 3. Single largest monthly gold purchases in tonnes over 2011-2021

Source: World Gold Council
As a result of the recent purchases by Poland and Hungary, the CEE region has become a significant buyer of gold, accounting for 17% of total global central bank gold purchases over the last three years. The increased buying of gold from the region may continue into the future. NBP Governor Glapinski has recently announced that Poland may buy another 100 tonnes of gold over the next couple of years. Serbia, if it continues its policy of gradual acquisition of gold, may also continue adding small amounts of gold to its reserves. Thus, the CEE region may continue to be an important centre for central bank gold activity in coming years.
1MNB, Press release, 17 Oct 2018
2The World Gold Council analysed the impact of Covid on central bank reserve management and found that in 2020 a reserve portfolio with gold outperformed a portfolio without gold (see our report here).
3MNB, Press release, 7 April 2021
4The 604.3 tonne increase in China’s reserves reported in Jun 2015 from China was excluded as it referred to China’s purchases made over the preceding six-year period rather than a single purchase
Central bank domestic gold purchase programmes
Shaokai Fan
Head of Asia Pacific (ex China) & Global Head of Central Banks World Gold CouncilToday, we publish a new report – Central bank domestic ASGM purchase programmes – which discusses the growing trend of central banks buying gold from domestically-produced sources, and the role that these institutions can play in developing and formalising the Artisanal Small-Scale Gold Mining (ASGM) sector in their countries. Central banks have been adding gold to their official reserves for 11 consecutive years, with the majority obtaining the gold from the international market. A smaller share of central banks source gold from domestic production as well. Buying gold domestically has distinct advantages as it allows a central bank to buy a reserve asset with their own currency instead of US dollars.
The ability of the central bank to act as a catalyst for ASGM sector formalisation is also a major benefit for domestic purchase programmes. ASGM activity provides a livelihood to over 20 million people globally. Promoting greater formalisation can increase prosperity and alleviate some of the socially and environmentally damaging issues that impact this sector. Given the size and influence of central banks in their domestic markets, they can be used to foster and enforce lasting change through the implementation of international standards and best practices for the ASGM sector.

In our report, we examine four countries whose central banks buy gold from domestic sources – the Philippines, Mongolia, Ecuador, and Ethiopia. In each case, we explore the evolution of the domestic purchase programme, the structure and requirements of each programme, and the impact on the local ASGM sector. We also present the key challenges of disseminating international standards in this sector, reviewing the various obstacles that domestic purchase programmes have tried to overcome. Taken as a whole, this report can serve as a resource for any government or central bank that is looking to establish their own domestic purchase programme.
The new report is available on Goldhub.
How is central bank demand faring against our expectations?
Krishan Gopaul
Senior Analyst, EMEA World Gold CouncilI have written here before about how, after a more inconsistent picture for central bank demand in the second half of 2020, our expectation was for continued net purchases in 2021 but at a more moderate pace than in previous record-setting years. So, how is that expectation holding up?
Initial estimates for April suggest that central banks added a net 69.4t to global gold official reserves.1 Year-to-date, we estimate that central banks have collectively bought between 150-200 tonnes of gold on a net basis.2
Chunky purchases have driven pick-up in central bank demand
Monthly gross purchases and sales by central banks
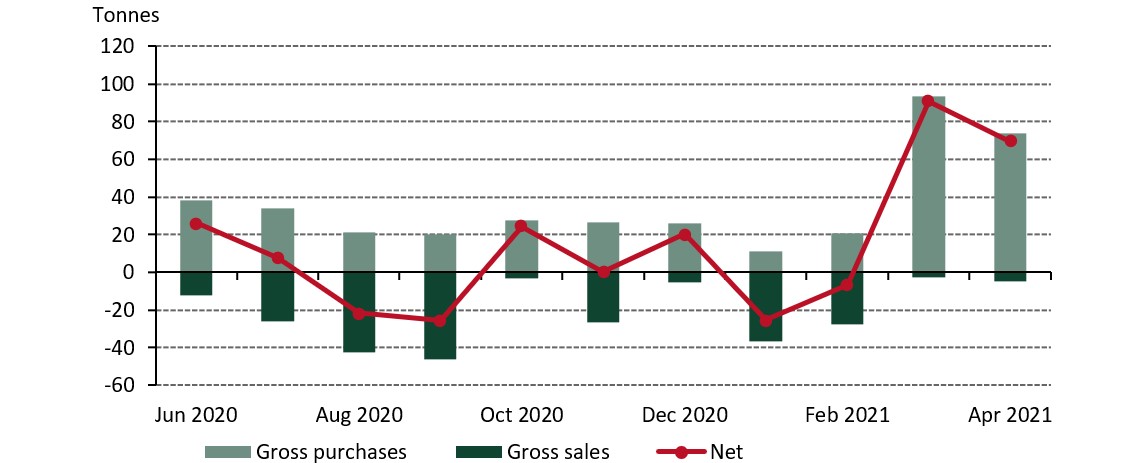
Note: Gross purchases in March exclude the 81t increase in Japanese gold reserves as reported to the IMF. For more information on this, please see Gold Demand Trends Q1 2021.
Source: IMF IFS, Respective Central Banks, World Gold Council
In April, gross purchases of 74.1t were almost entirely accounted for by five central banks. Thailand made the largest gold purchase during the month, adding 43.5t, which lifted gold reserves to 197.5t (4.5% of total reserves). Turkey also increased its gold holdings in April, after five consecutive months of declines. Gold reserves (excluding ROM holdings) rose by 13.4t, with gold reserves now standing at 526t. Uzbekistan (8.4t), Kazakhstan (4.6t), and Kyrgyz Republic (3.8t) were the other two familiar buyers.
The only sellers of note were Russia and Germany. Russian gold reserves declined by 3.1t in May, matching the drop we saw in January. Based on available information, it seems some of this sale may, again, be related to its coin-minting programme. German gold reserves fell by 1.3t, similarly in relation to coin minting.
So, back to our expectation. Estimated total net purchases of 150-200t for the first four months of the year confirm that there is still a healthy level of interest in gold. We should note, however, that the chunky purchases from Hungary (63t) and Thailand (44t) do account for a substantial share of this. This reinforces our expectation for continued healthy buying in 2021. While we cannot discount the possibility of more sales to come, we believe that the interest lies more on the buying side due to factors such as geopolitical risks, the economic impact of the pandemic, negative interest rates, as well as moves away from the US dollar.
More insights on this will be available when we publish our 2021 central bank survey. To see the latest central bank statistics in more detail, please click here.
Footnotes
1Our data set is based on IMF data, but is supplemented with data from respective central banks where is it available and not reported through the IMF at the time of publication
2This estimate excludes to 80t increase in Japanese gold reserves reported in March. Please see Gold Demand Trends Q1 2021 for more information.
Introducing our Central Bank Dashboard
Qixiu Tay
Former Manager, Central Banks & Public Policy World Gold CouncilThe World Gold Council is launching the Central Bank Dashboard, an innovative web-based tool that allows the comparison of central bank gold reserve holdings across regions, income levels, foreign exchange arrangement and other qualitative and quantitative indicators.
The Central Bank Dashboard provides users with the flexibility to visualise trends in gold and foreign exchange reserve holdings across a multitude of vantage points. Supported by an intuitive filtering system, the Dashboard allows users to quickly retrieve and compare gold reserve data between central banks peers that share one or more characteristics. It provides users with the option to:
- Select between quarterly and annual time periods to visualise trends in central bank gold and foreign exchange reserves
- Choose to show data either at a fixed point in time (snapshot), across a time period (date range), or at two different points in time (compare dates)
- Compare gold reserve holdings between different groups of central banks, selected by user-defined parameters
- Add or remove countries from the comparison through the use of a dynamic chart legend.
At its core, the primary function of the Central Bank Dashboard is to provide users with an easy way to retrieve gold reserve information about a selected group of central banks peers. The user can curate their selection through the use of the AND/OR logical operators. The AND operator returns the list of central banks that fulfil the criteria of two or more queries. For instance, the application of the AND operator to countries that have the characteristic of high income, as defined by the World Bank, and are situated in the Middle East and North Africa would return the central banks of Saudi Arabia, Qatar, UAE and others. In contrast, the OR operator can be used where the user wants a combined list of central banks that share characteristics – for example, within two regions. In the example below, using the OR operator, East Asia and South East Asia would return data from banks situated in both of those regions: China, Japan, Singapore, Malaysia, etc.
AND OR examples:

The Dashboard comes with a set of pre-defined filters to showcase the versatility of the filtering system and highlight existing trends in central bank gold reserves. The four pre-defined filters are:
- Economies with high levels of reserves
This filter highlights countries that have foreign exchange reserves above the level required for precautionary purposes as indicated by the IMF’s ARA EM metric; the IMF ARA metric is a catch-all indicator for capital adequacy. As a rule of thumb, reserves within 100 - 150% of the ARA EM metric are considered adequate. Oil- and gold-producing countries are excluded from the comparison as their reserve management considerations can be different from the rest of the world.
- Floating and free-floating exchange rate regimes
This highlights countries that employ either a floating or free-floating exchange rate arrangement. These countries typically hold less reserves as a percentage of GDP and proportionately more gold as a percentage of their total reserves. Because Western European countries have large gold legacy holdings they are excluded from the comparison; gold-producing countries have the potential to bolster their reserve holdings through the domestic purchase of gold using local currencies, and therefore they too are excluded.
- Export-driven economies in Asia
These are upper-middle to high-income economies in Asia with accumulated foreign exchange reserves that exceed three months of imports. Such economies are typically export driven and have large foreign exchange reserves accumulated over a long period of time. Excluding gold-producing Asian economies, this group holds the least amount of gold as a percentage of reserves compared to other regions.
- Belt and Road Central Asian economies
These central Asian economies are signatories to China’s Belt and Road Initiative. As a group, these countries have strong connections with China, either via export or FDI links. Some of them are also gold producers with large gold deposits. Compared to other regions they hold the largest average amount of gold as a percentage of total reserves.
The Central Bank Dashboard was developed after dialogues with central banks revealed an interest in determining the gold reserve holdings of economic peers. This information is a critical component in any gold reserve management decision-making process and the Dashboard aims to provide a comparative analysis approach to help inform central banks on the optimal level of their gold reserve holdings based on economic peers. The economic comparison of countries is facilitated through the use of three broad categories: geographical, qualitative and quantitative.
Geographical characteristics allow users to create a subset of central banks through selecting countries on an individual or regional basis. Countries in the same region may have similar cultural, political and economic systems that translate into similarities in reserve management objectives, including those concerning the purchase of gold.
Qualitative characteristics expand the comparison of central bank gold reserves beyond geography. Indicators in this category allow users to sort countries according to their income levels, exchange rate arrangements, monetary policies and other characteristics, including whether they are gold or oil producers.
Quantitative indicators look primarily at the capital adequacy ratios of countries. There are several conventional metrics used to measure reserve adequacy and the Dashboard explores five such measures, including the IMF’s ARA metric, which is a catch-all indicator for capital adequacy. Capital adequacy ratios are included because they can identify countries with high levels of reserves.
You can access the Central Bank Dashboard here. For more information on the Dashboard and for monthly and quarterly central bank gold reserve statistics, please visit Goldhub.com.
Central bank gold buying gathers steam
Shaokai Fan
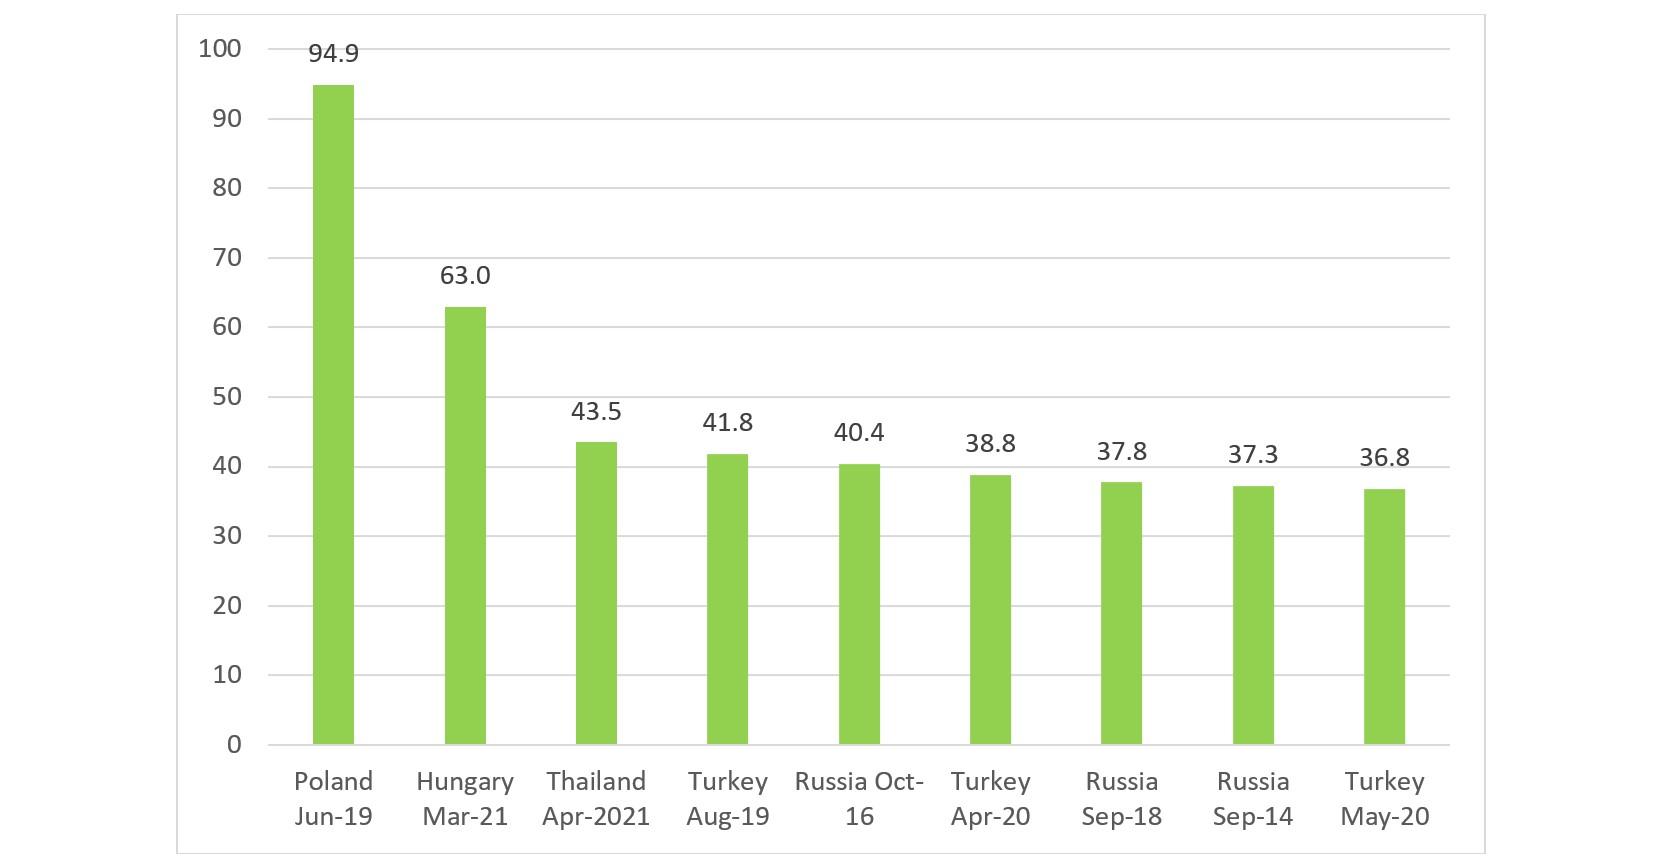
Head of Asia Pacific (ex China) & Global Head of Central Banks World Gold CouncilAs Krishan Gopaul’s blog post last week pointed out, central banks have been buying gold during the first four months of 2021. Over that period, we estimate that the official sector has added 150-200 tonnes of gold. A significant portion of this buying has come from the central banks of Hungary and Thailand, who added 63 tonnes in March and 43.5 tonnes in April, respectively. In fact, these two purchases are the second and third largest monthly central bank gold purchases in recent history, eclipsed only by Poland’s 100 tonne purchase in June 2019 (see chart below).
Thailand’s gold purchases appear to be continuing in May as well. The Bank of Thailand publishes weekly reserve position data on gold, although reported in US dollar terms and not tonnage. Between 30 April and 28 May 2021, the value of the Bank of Thailand’s gold reserves grew from US$11.2 billion to US$14.9 billion, an increase of US$3.7 billion. A back-of-the-envelope calculation shows that this growth may imply a 40-50 tonne increase. We will have to await the May update from the IMF to see what the exact change in Thailand’s gold reserves is.
The Bank of Zambia has also started to accumulate gold in recent months, albeit on a smaller scale than the aforementioned central banks. Since February 2021, it has added 2,100 ounces per month to its reserves. Zambia has already reported its May gold holdings to the IMF, which now total 8,400 ounces or 0.26 tonnes. These purchases are likely the result of the central bank’s decision to build its gold reserves from domestic production. Zambia now joins the central banks of Mongolia, the Philippines, and several other countries in sourcing gold reserves from domestic mine supply.
Hungary issued a press release that accompanied its March purchase which cited “new risks arising from the coronavirus pandemic” as playing a key role in its decision to buy. Bank of Zambia Governor Christopher Mvunga said that “during periods of market stress – when assets would be losing value – gold would be adding value, thereby shielding the whole portfolio from large losses.” Our 2021 Central Bank Gold Reserves survey found that gold’s performance during crisis periods is now the most relevant factor for central banks to hold gold, echoing the sentiments above. As uncertainty over the post-pandemic recovery hangs over global markets, it will undoubtedly continue to drive central bank investment decisions over the coming year.
Largest Monthly Central Bank Gold Purchases (Jan 2012 to present)
Source: World Gold Council
Latest research
Looking for insight and analysis on gold? Our team of experts produce market-leading research and macroeconomic commentary on gold.
