Today, we released the September and Q3 2020 gold ETF flows report as gold ETFs surpass 1,000 tonnes of new demand in 2020.
Highlights include:
10th straight month of inflows, matching the record twice met since the Financial Crisis
Today, we released the September and Q3 2020 gold ETF flows report as gold ETFs surpass 1,000 tonnes of new demand in 2020.
Highlights include:
10th straight month of inflows, matching the record twice met since the Financial Crisis
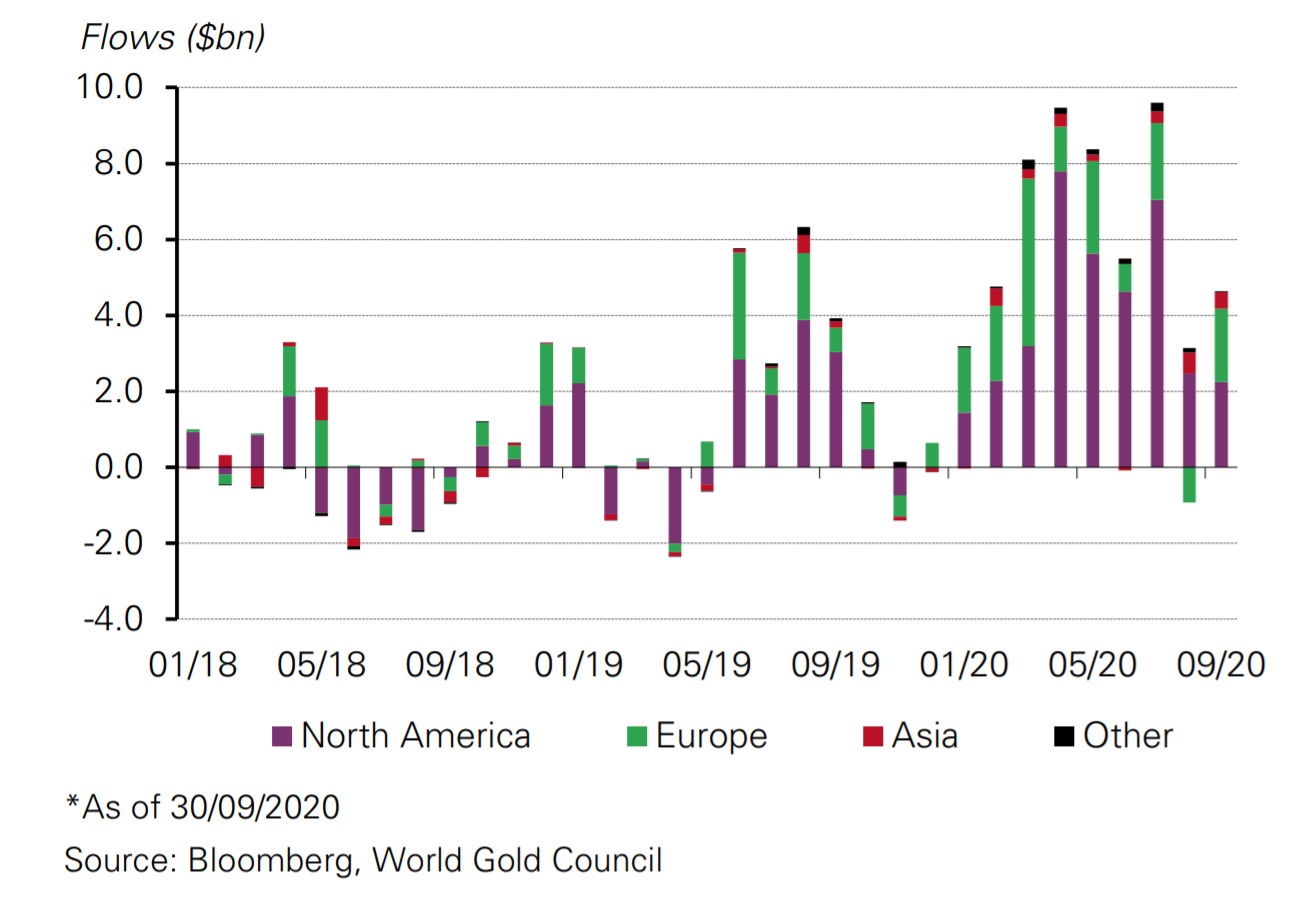
Inflows this year are over 1,000t for the first time ever, as assets continue to make new highs of 3,880t and US$235bn in AUM.
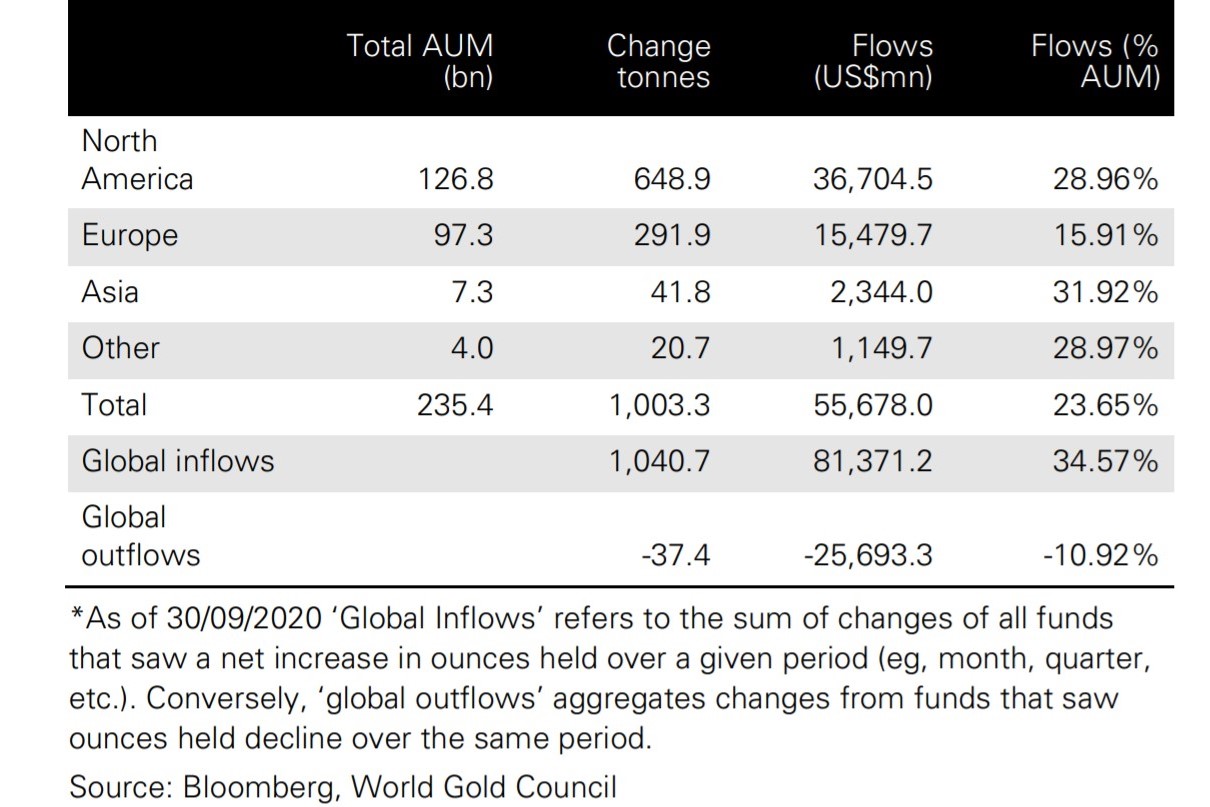
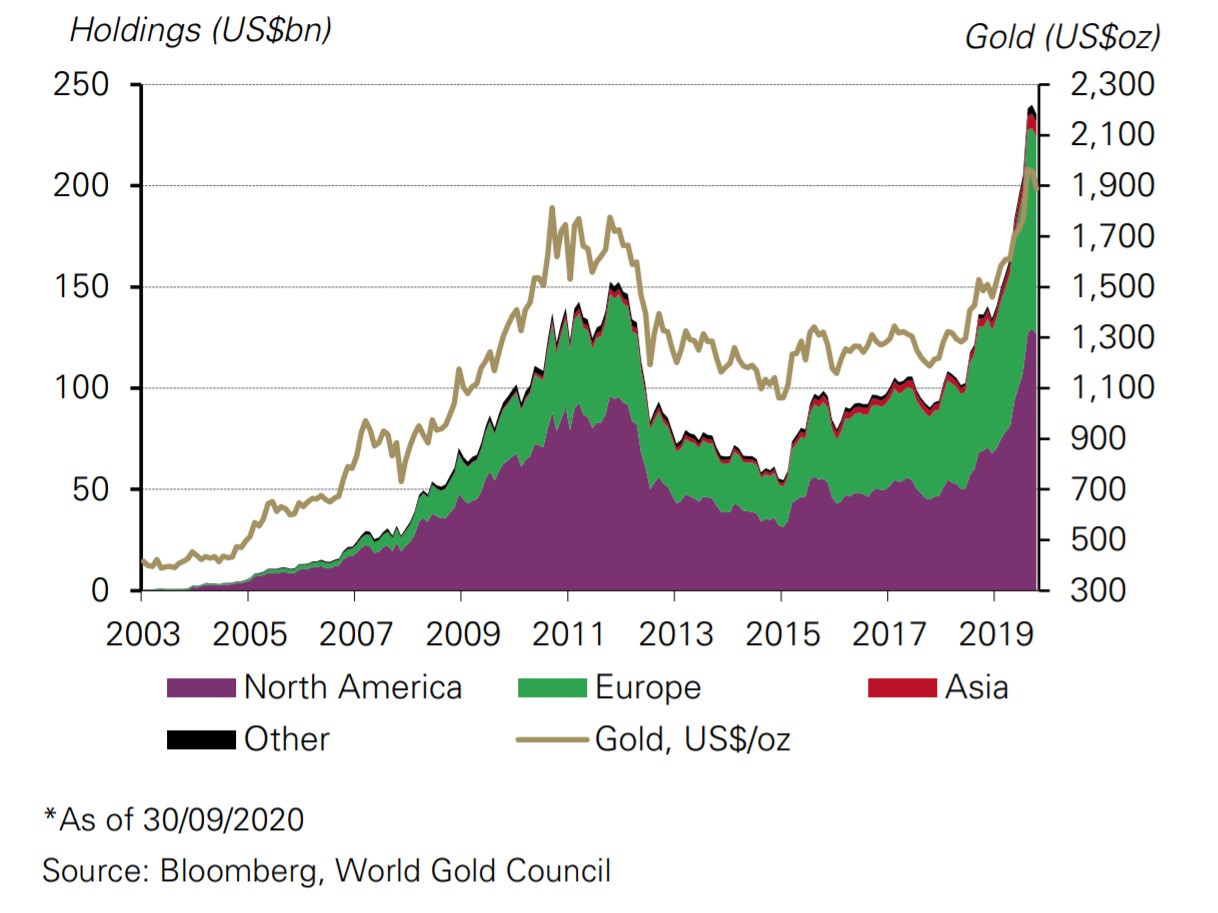
Q3 inflows were strong and positive in all regions. North America led, but Asian inflows were impressive, up 17% as China continues to list new funds.
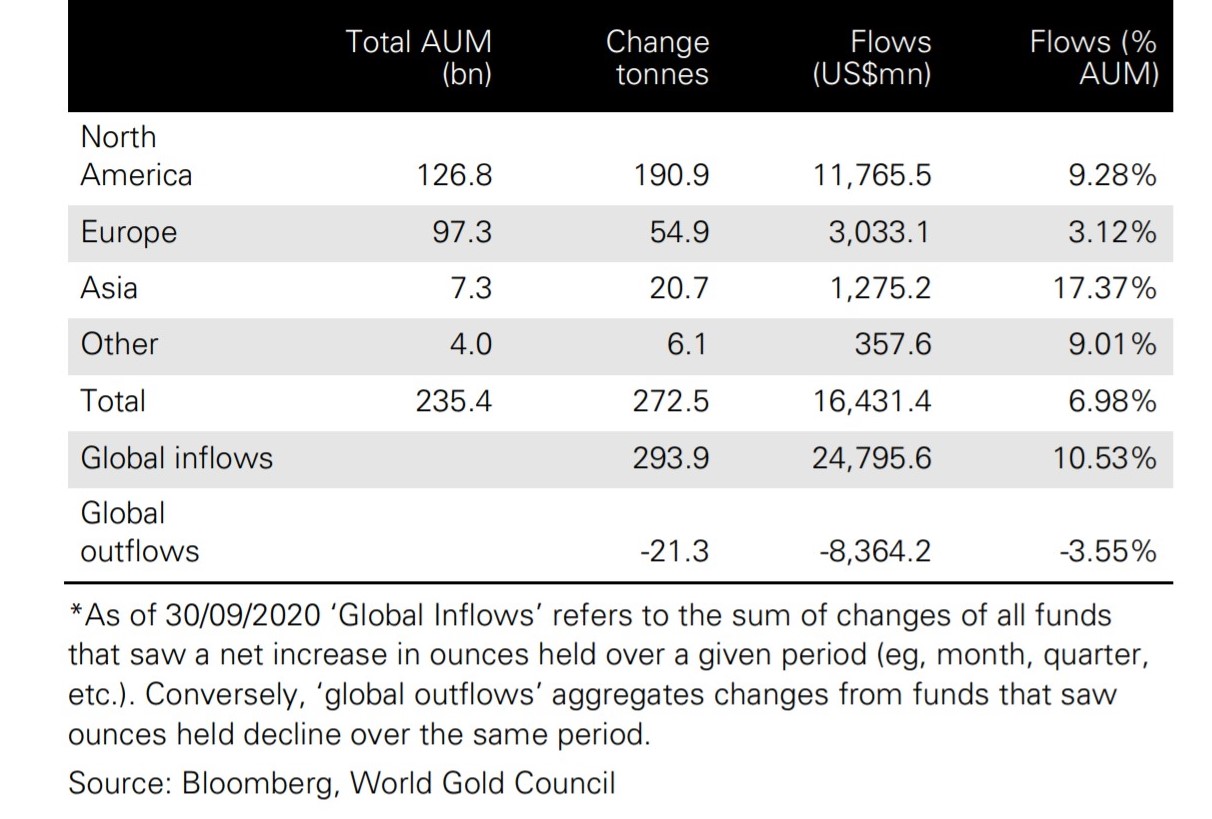
Other Highlights:
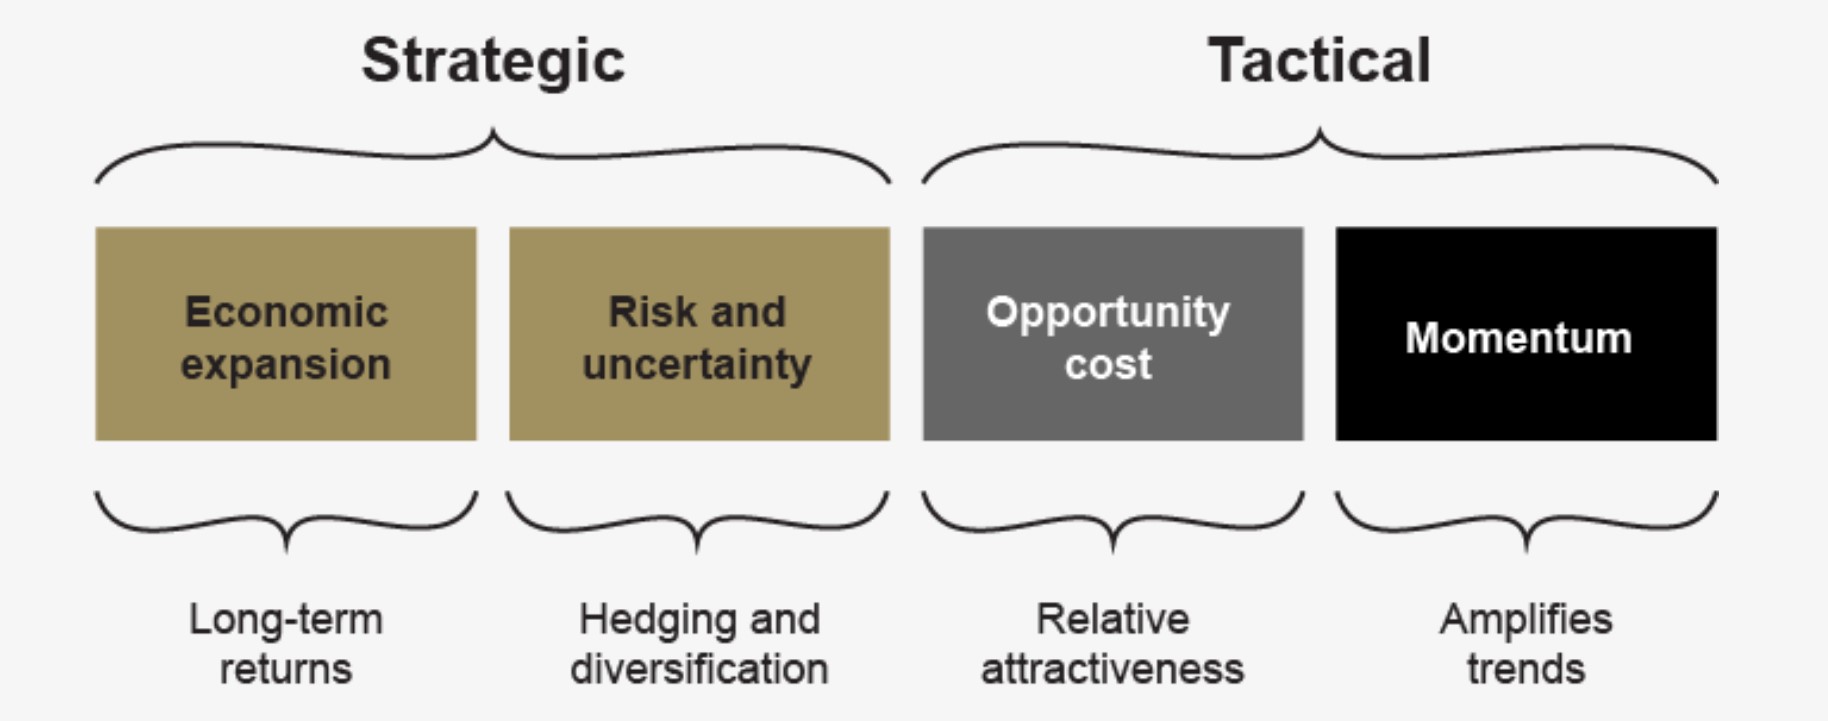
Strong inflows despite the weakest US dollar gold price performance in four years. Why? The growing acceptance of gold as a long-term strategic asset and increased investment demand amidst the headwinds of tactical, short-term reduced positioning, profit taking and a stronger dollar.
Looking ahead: Numerous catalysts for market volatility in the 4th quarter: US election and political posturing, potential no-deal Brexit trade deal, and of course the recent uptick in COVID cases. On the flip side, Chinese economic numbers looked better heading into the holiday season, and the solid monsoon season could spur demand in India as well.
Finally, global monetary policy continues to suggest a longer period of low rates, with the allowance of inflation running hotter for longer. These highlight gold’s improving opportunity cost.
I recently had the pleasure of joining Rob Tyson for an episode of 'Dig Deep - The Mining Podcast'. We had a great, in-depth chat on our Gold Demand Trends report and discussed the impact that the coronavirus pandemic has had on the gold market.
Listen below!
September summary
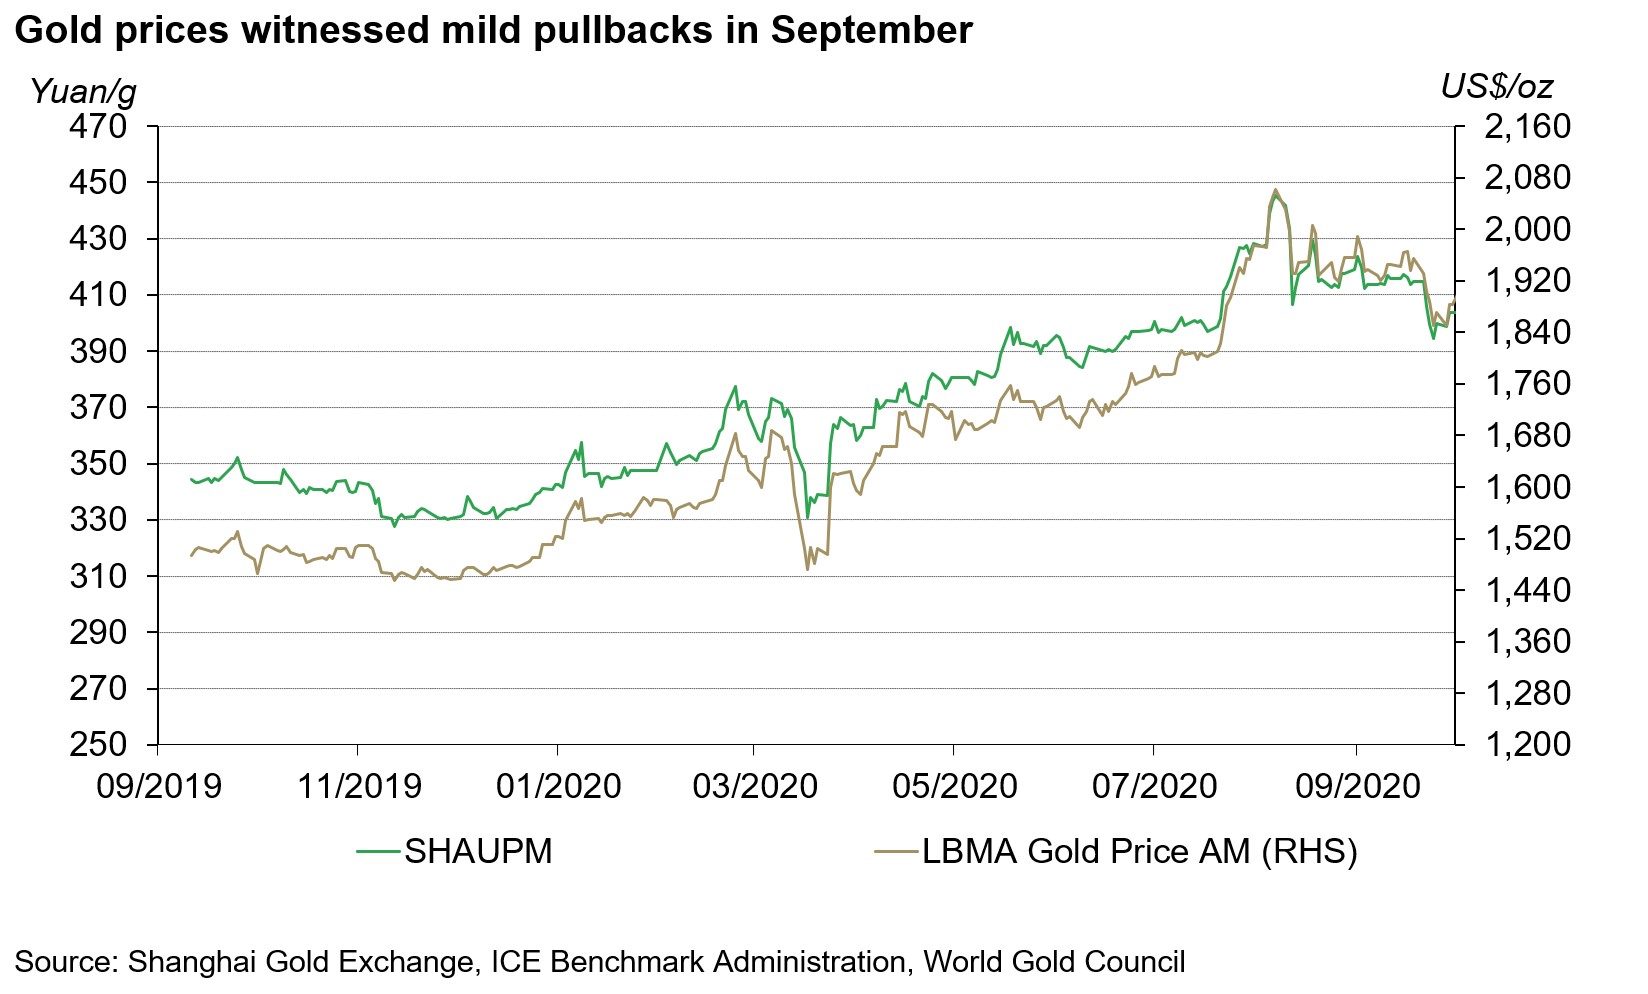
Gold prices witnessed marginal declines in September
Rebounding real rates in major markets, such as the US and China, were the main contributor to the 2.2% and 1.9% declines in the SHAUPM (RMB) and the LBMA Gold Price AM (USD). Meanwhile, with gold prices surging so far this year, a technical pullback related to profit-taking followed, as is often the case.
Primarily driven by the continued improvement in the domestic economy and policy makers’ prudent attitude towards monetary easing, the RMB strengthened further during the month, leading to a larger decline in the RMB-denominated gold price than in the USD.
China’s economic growth saw positive signs
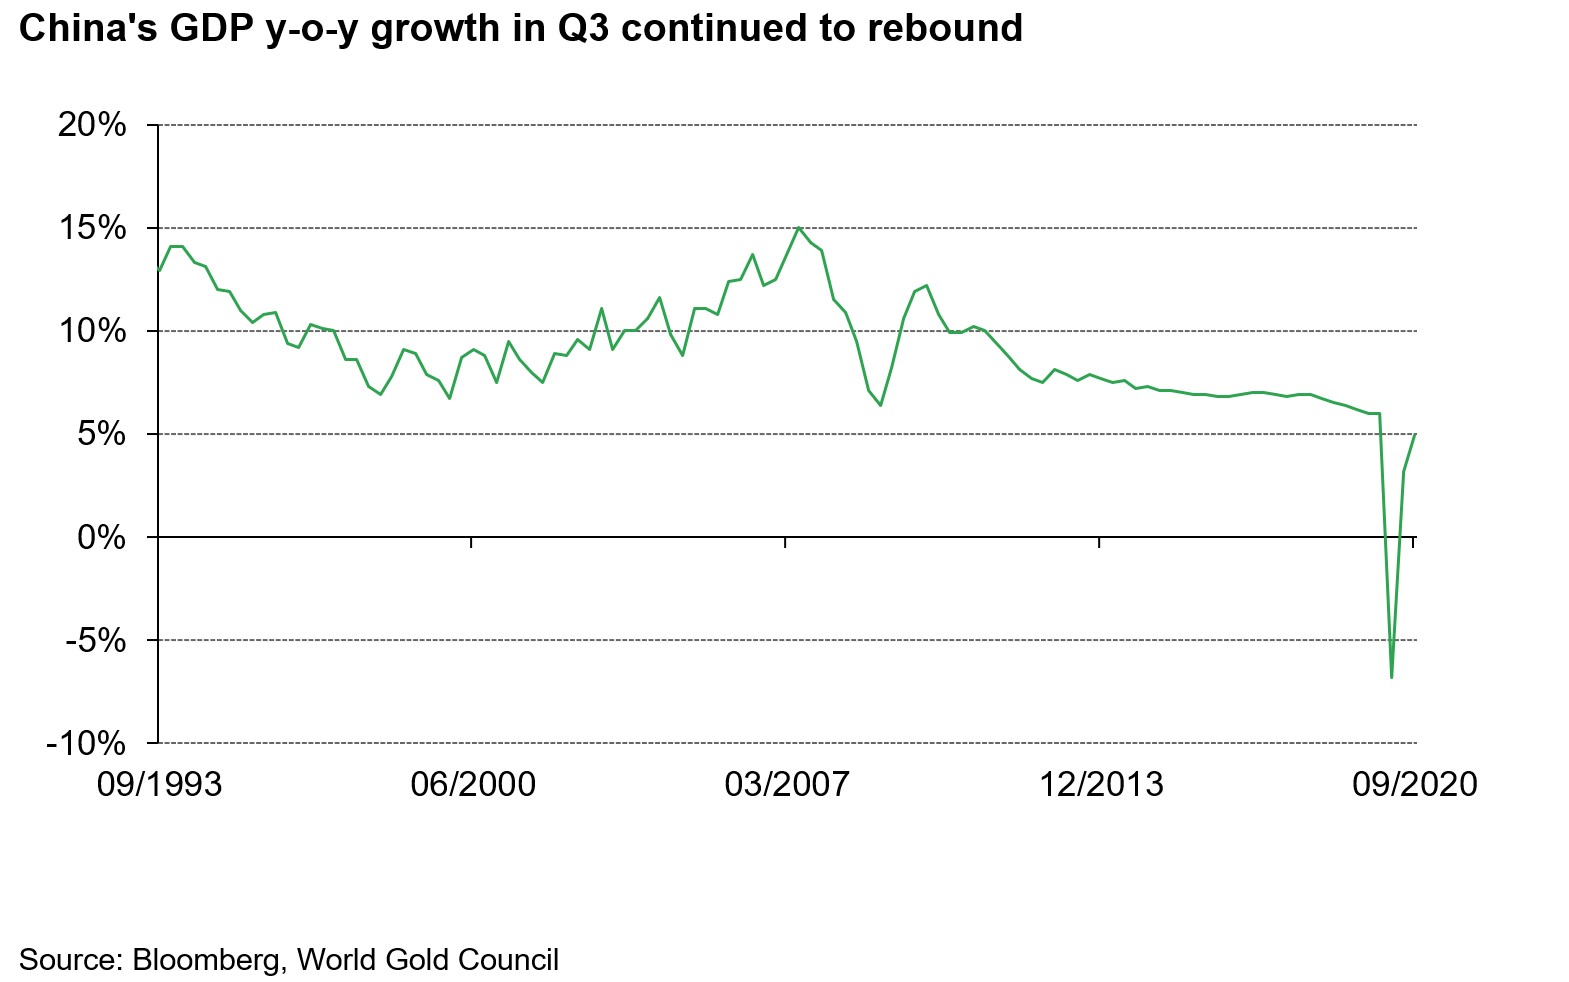
According to the Bureau of Statistics, China’s GDP y-o-y growth continued to recover, rising to 4.9% in Q3 from 3.2% in Q2. Meanwhile, other key supply side indicators, such as PMI and industrial output, also showed strong improvement in September, rising above their average 2019 levels. Y-o-y growth in demand side indicators, such as retail sales and disposable income, also improved further. However, the rebound in demand has been weaker than on the supply side, with these indicators remaining below their 2019 levels.
But there are reasons to be optimistic around China’s consumption:
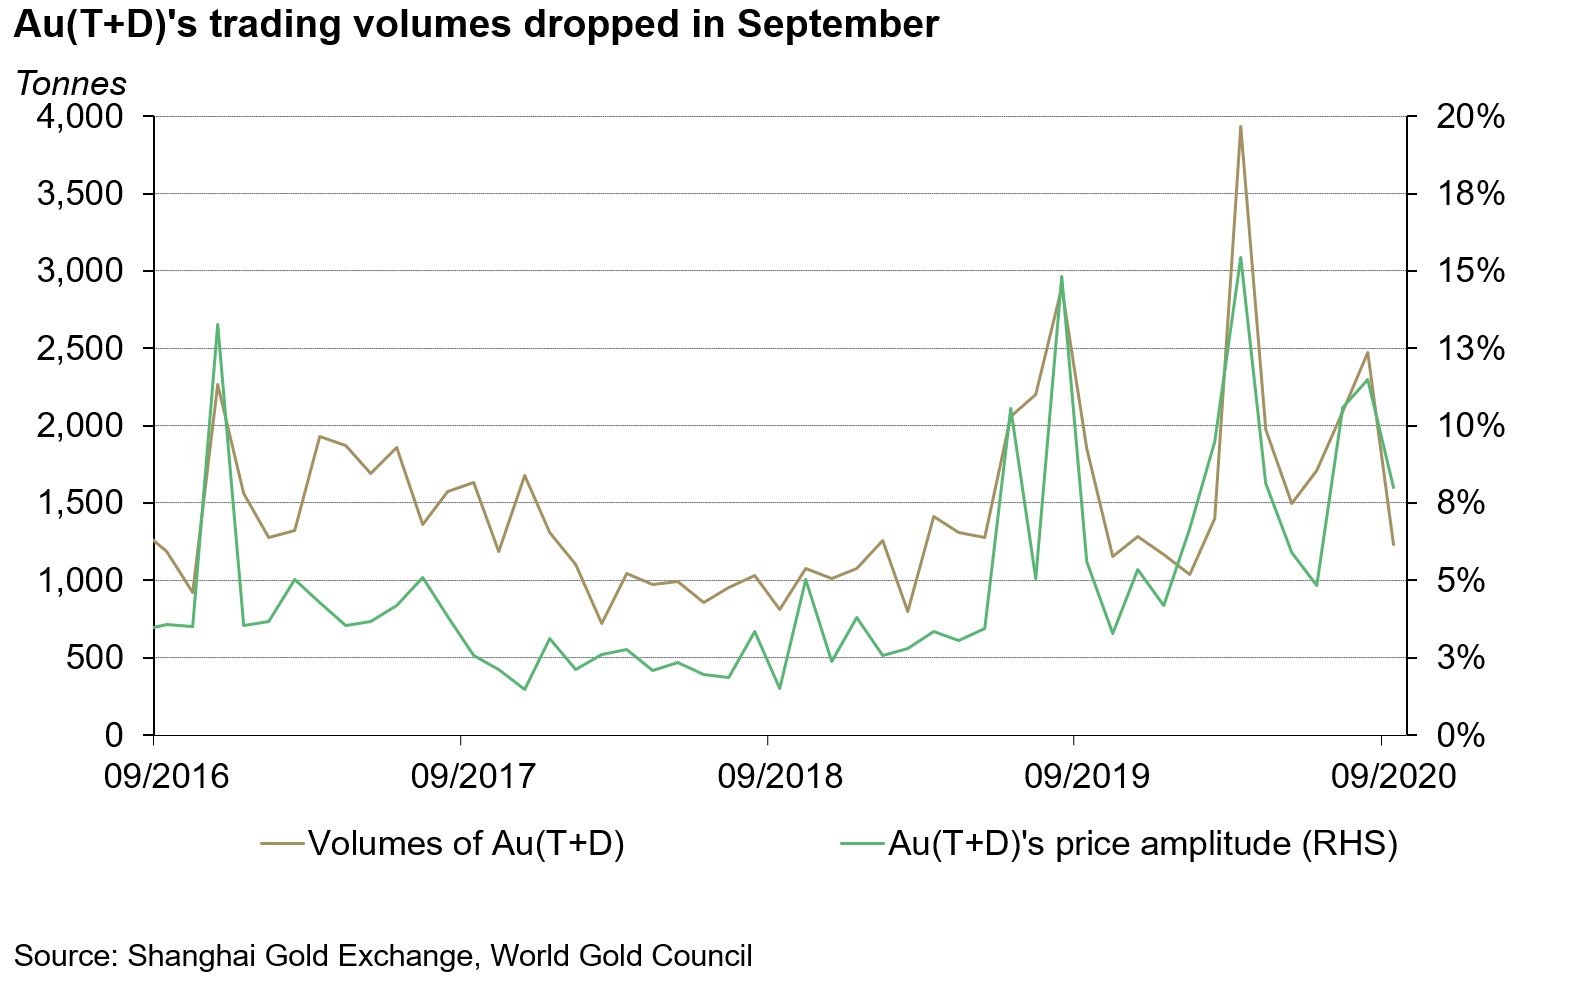
There was a 54% m-o-m drop in Au(T+D)’s trading volumes, totaling 1,149t last month
Tactical investors’ interest in the margin-traded gold contract faded as the local gold price became less volatile – providing fewer profiting opportunities for these shorter-term traders – and the bullish momentum in the gold price weakened.
The Chinese gold-backed ETF market continued to expand
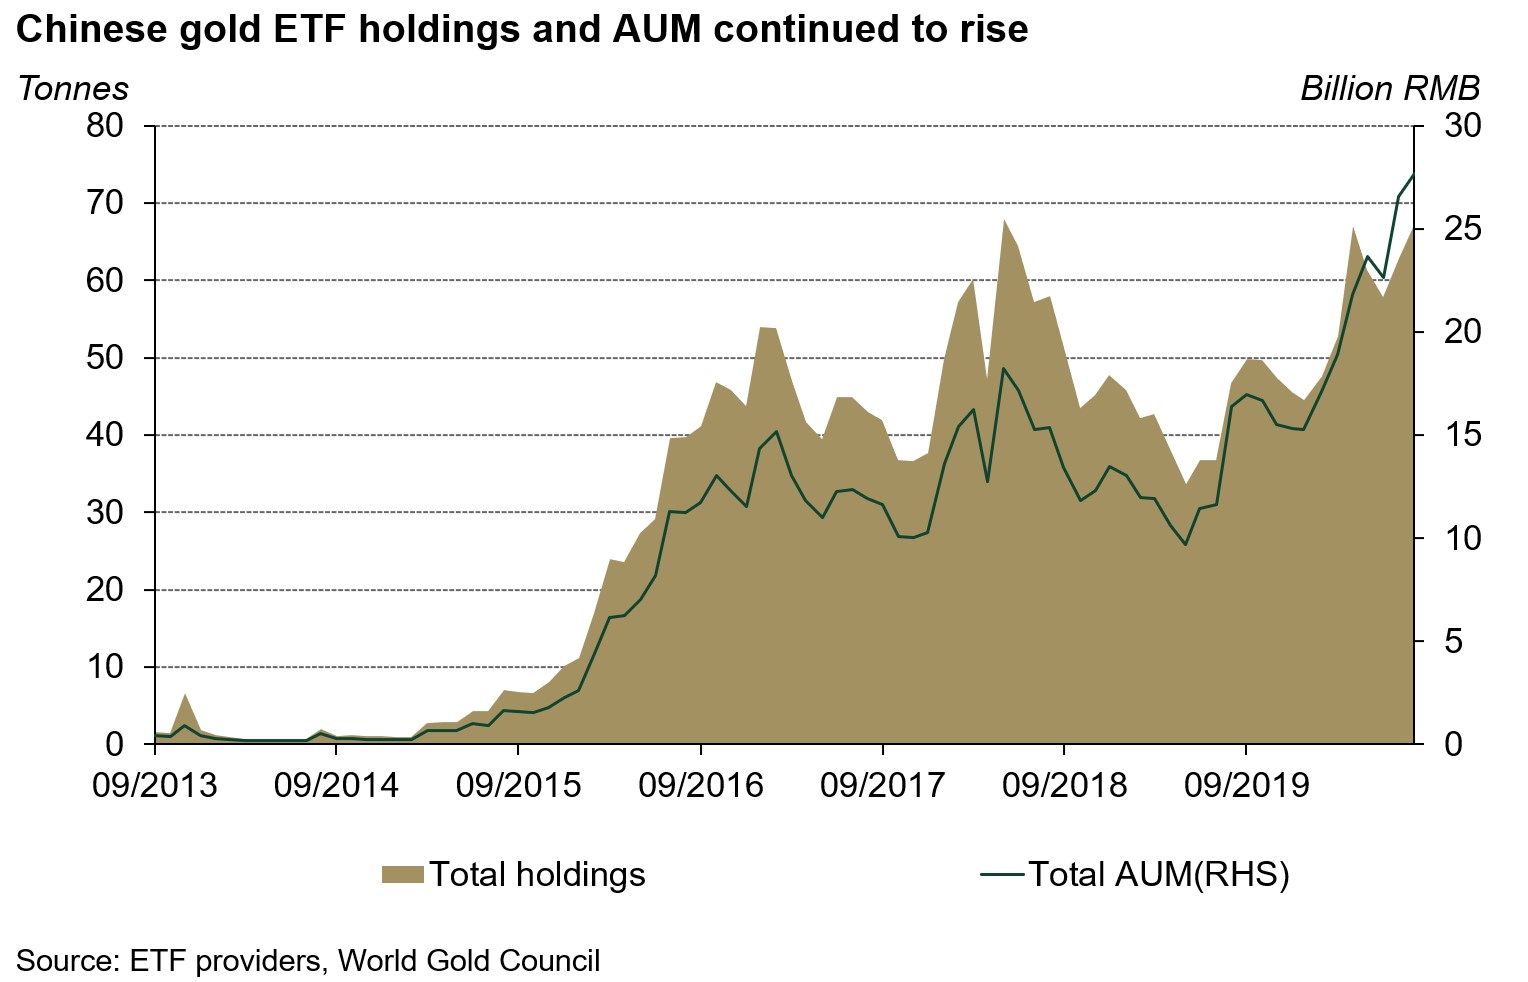
Both total gold holdings and assets under management in Chinese gold ETFs rose to their highest ever levels last month, at 69.5t and US$4.2bn respectively.3 Two Shanghai Gold ETFs, issued by CCB Principal Asset Management and Bank of China Asset Management, were listed in early September, expanding the choice for Chinese gold ETF investors to 11 funds. But this was not the only driver for growth: total gold holdings in the pre-existing nine funds also increased last month, as Chinese investors’ strategic allocation to gold kept rising as a hedge against possible future economic and geopolitical uncertainties in spite of the weakened bullish momentum in the gold price.
The wholesale physical gold demand continued to improve in September
Extending the rebound from August, both withdrawals from the SGE and trading volumes of Au9999 – the physical gold contract at the SGE and a proxy of China’s physical gold demand – rose further. This is due to two key factors. First, as mentioned in my last blog, many jewellery manufacturers and wholesalers held various promotional events in September in conjunction with the Shenzhen Jewellery Fair, attracting retailers from all over the country and boosting sales.
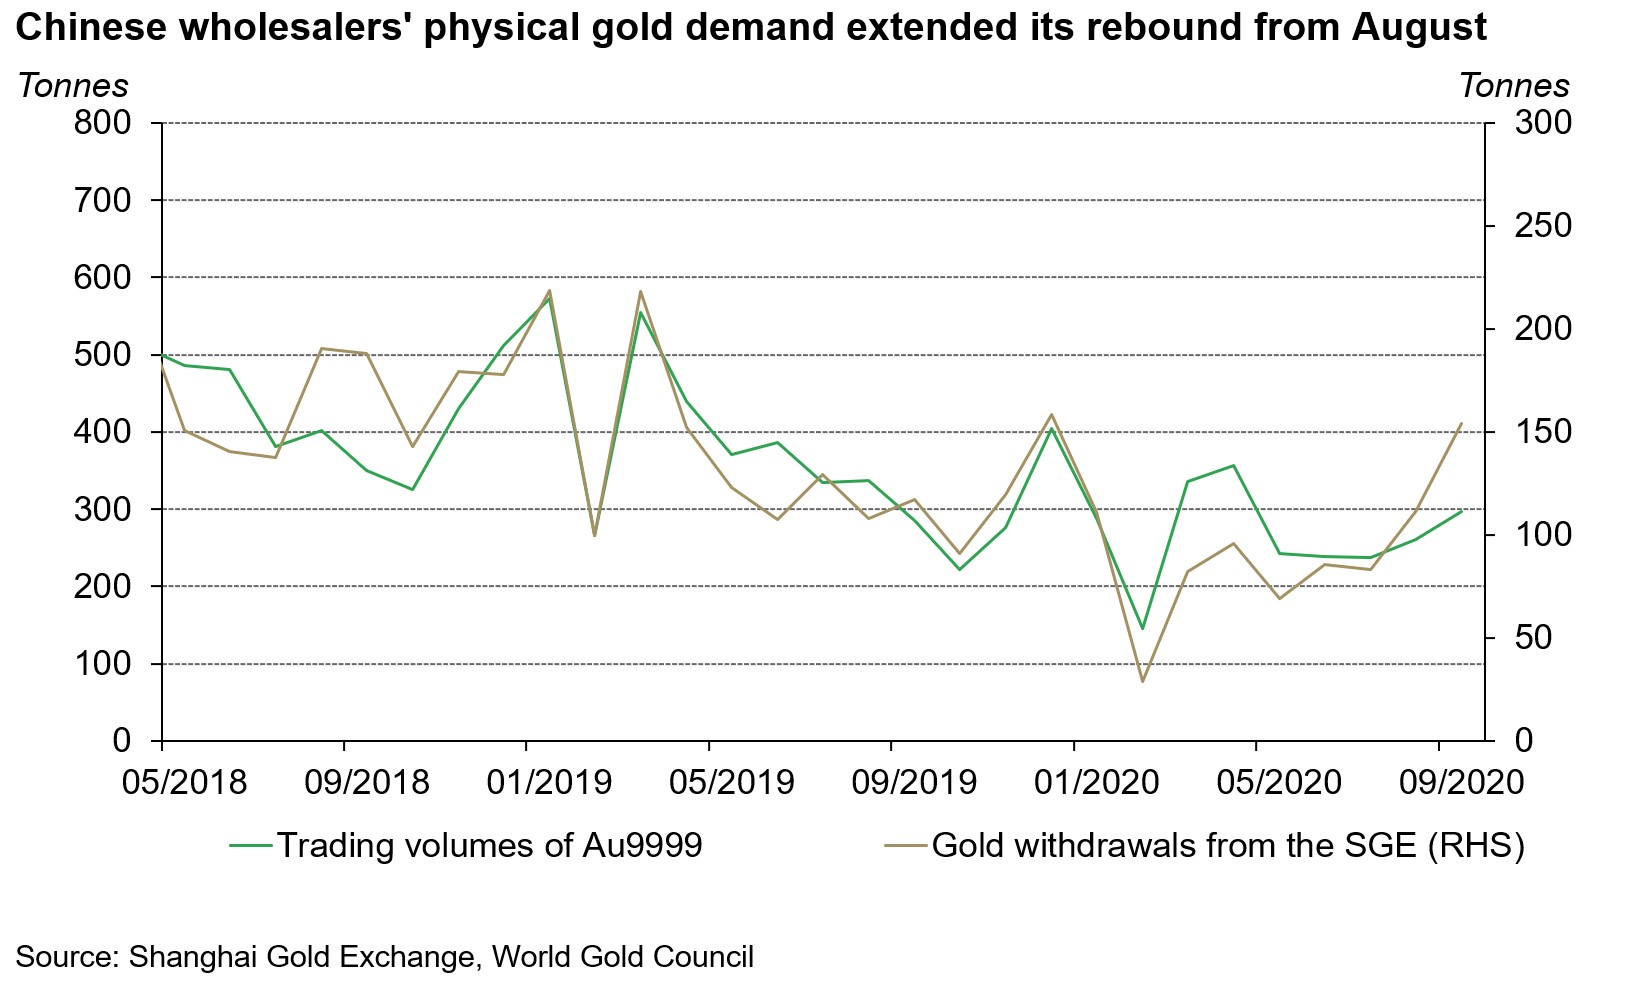
Second, Chinese jewellery retailers were stocking up in advance for the long-anticipated gold wedding jewellery sales boom during the eight-day ‘Golden Week’ holiday in early October.4 With many couples postponing their marriages D’amour to later in the year due to the pandemic, the number of weddings held during Golden Week – the traditional wedding peak – saw explosive growth. According to Hunliji – a main digital platform for wedding related products – over 600,000 Chinese couples held their weddings during this period, 11% higher y-o-y. And the Ministry of Commerce’s data showed that during Golden Week the sales of gold, silver, jade, and gem jewellery in key cities, such as Beijing, increased by more than 25% y-o-y.
The Chinese local gold price discount narrowed
The discount in SHAUPM relative to the LBMA Gold Price AM contracted to, on average, US$46/oz in September – US$24/oz narrower than August. While the recovery in China’s physical gold demand contributed to the contraction, the narrowing between real rates in China and other key markets such as the US – i.e. the difference in the opportunity costs of holding gold – also played a vital role.
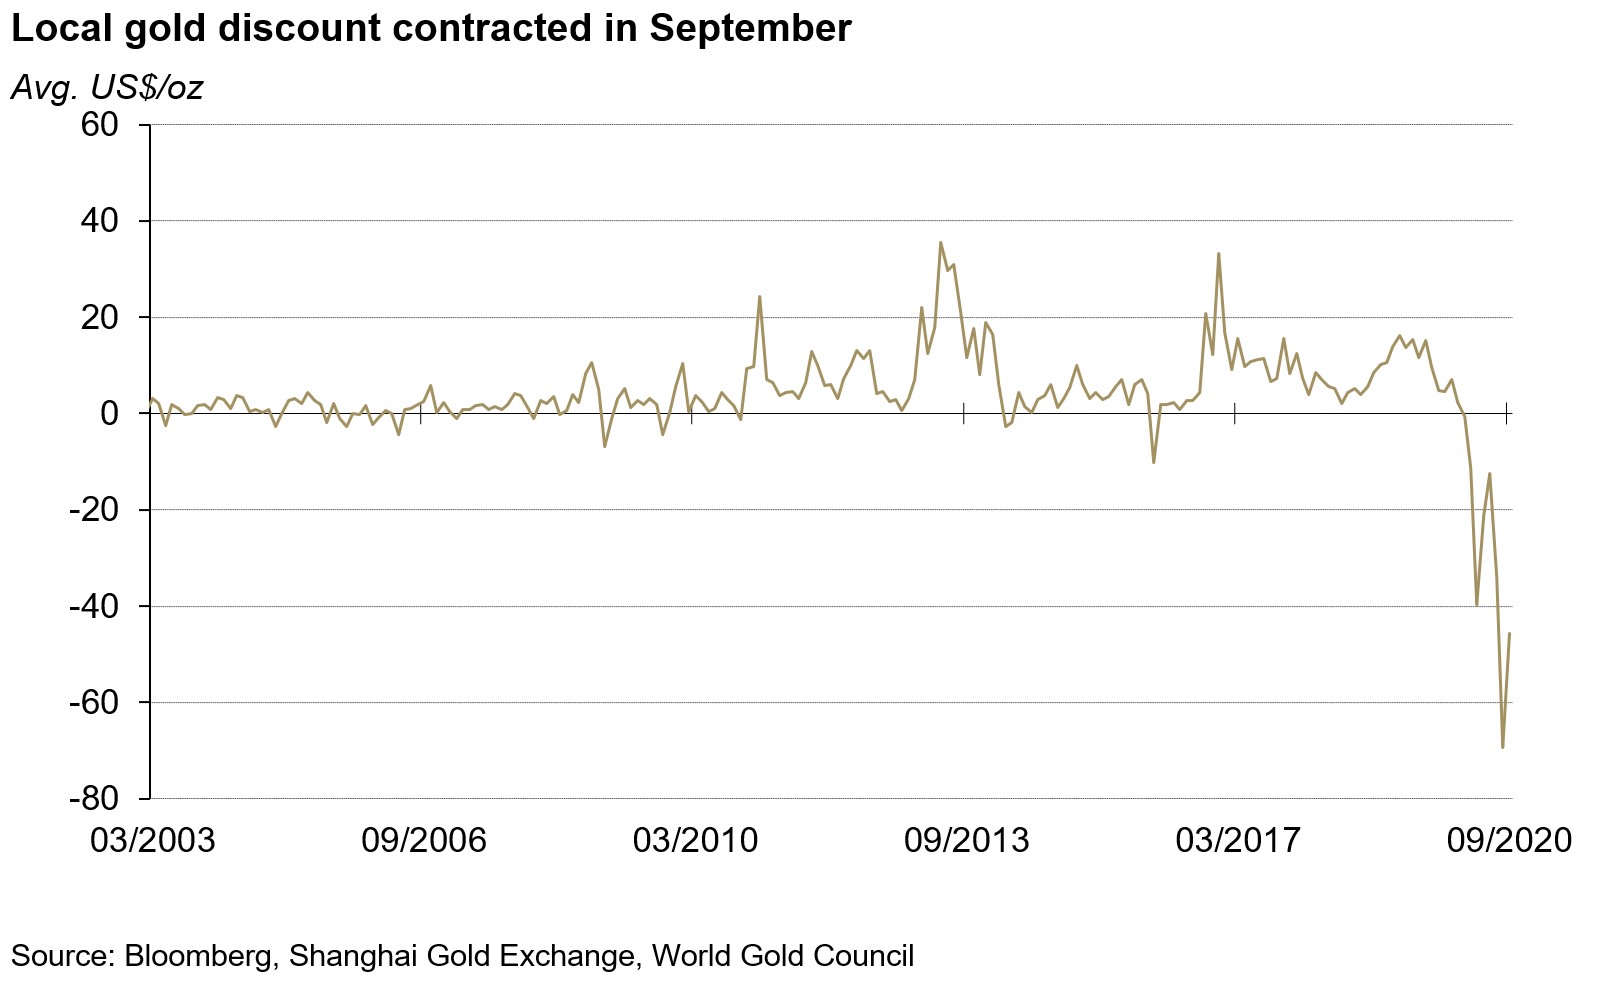
Note: SHAUPM vs LBMA Gold Price AM after April 2014; before that, Au9999 vs LBMA Gold Price AM is used. Click here for more.
Footnotes
1 We compare the LBMA Gold Price AM to SHAUPM because the trading windows used to determine them are closer to each other than those for the LBMA Gold Price PM. For more information about Shanghai Gold Benchmark Prices, please visit en.sge.com.cn/data_BenchmarkPrice.
2 For more information about premium calculation, please visit www.gold.org/goldhub/data/local-gold-price-premiumdiscount.
3 Please note that Bosera’s I & D shares only provide updates at the end of each quarter.
4 This year’s Golden Week holiday ran from 1 October to 8 October, covering the Mid-Autumn Festival and the National Day Holiday.
This morning I spoke to Bloomberg TV about key findings from our new Gold Demand Trends report. In particular, I discussed demand for gold in China, and its potential to improve as the country continues to recover from the impacts of the pandemic. I also discussed why investment demand tends to offset weaknesses in consumer demand, and the reasons why investors are increasingly attracted to gold in this period of uncertainty and low interest rate environment.
Watch below.
On Friday 30th October our sales and research teams hosted a webinar for professional investors, where they dived into the key findings from our industry-leading Q3 2020 Gold Demand Trends report. They explored global gold demand in the technology, jewellery and investment sectors, as well as across central banks and official institutions, in addition to providing some insights into gold supply.
Topics discussed include...
Watch below!
October summary
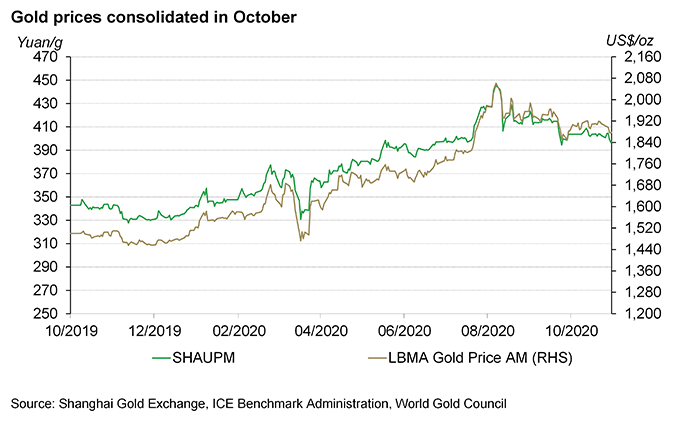
Gold prices saw marginal declines in October. Even though the US presidential election and a significant rebound in COVID-19 infection cases in many regions kept uncertainty elevated globally, climbing real interest rates in key markets such as the US and China weighed on local gold prices. As a result, the SHAUPM (RMB) and LBMA Gold Price AM (USD) fell by 1.8% and 0.4% respectively in the month.
The continuous appreciation in RMB and a rising real rate in China driven by the nation’s strong economic revival after Q1 could be the main factors contributing to weaker performance in the RMB gold price relative to the USD gold price.
Signals on China’s economic growth last month were mixed. While the manufacturing Purchasing Managers’ Index and the growth in industrial output continued to rise, local inflation – the y-o-y change in Consumer Price Index (CPI) – dropped to 0.5% in October from 1.7% in the previous month – the lowest in 12 years. In the meantime, the Producer Price Index (PPI) remained at its multi-year low.
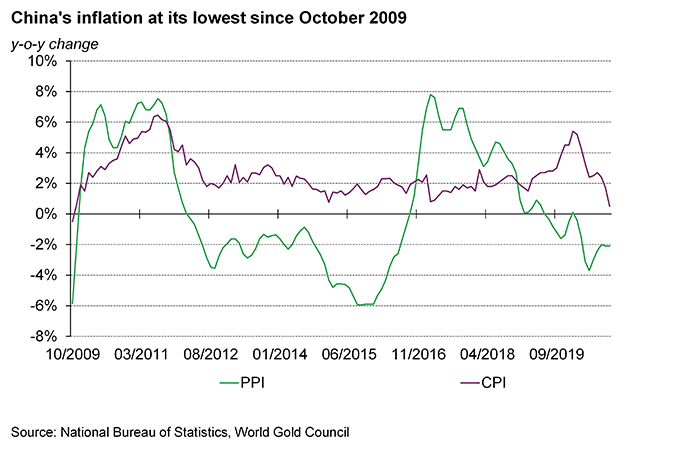
While we remain optimistic around the longer-term outlook of the demand side of the Chinese economy, the possibility of a deflationary scenario in the near term could be rising. And historical data shows that not only has RMB gold performed well during periods with high inflation, it has also delivered considerable returns in deflationary scenarios as local investors view gold as a store of value during uncertain times.3
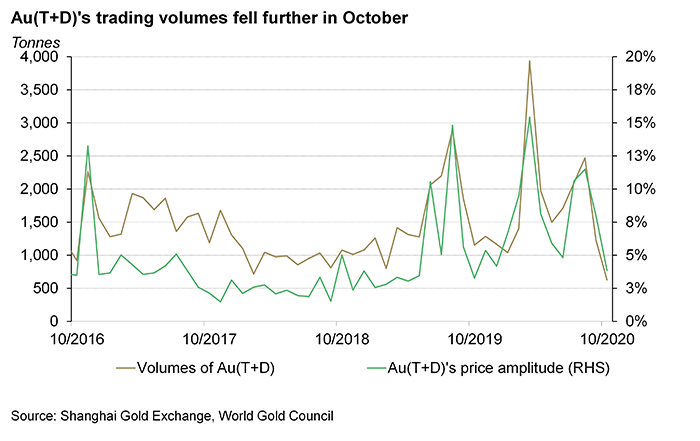
Au(T+D)’s trading volumes in October totalled 626t, 50% lower m-o-m and 46% lower y-o-y. We believe that fewer trading days in October due to holidays occurring early in the month and reduced volatility in the gold price, which limited short-term traders’ profiting opportunities, could be the main contributors to the significant drop in the contract’s trading volumes.4
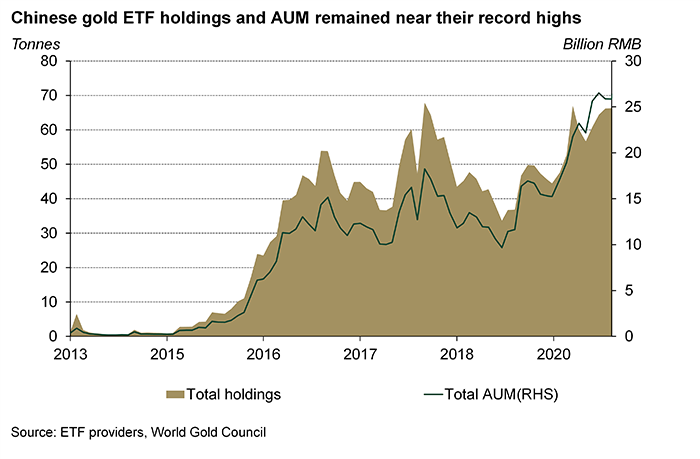
Total gold holdings in Chinese gold-backed ETFs saw a marginal inflow of 0.1t last month, reaching 66.3t as of October. Meanwhile, the total asset under management of the 11 Chinese funds totalled RMB25.9bn, or US$3.9bn, hovering around the highest level on record.5 With the local equity market stabilising and RMB strengthening, the pace of growth in Chinese investors’ strategic allocation to gold ETFs slowed in October.
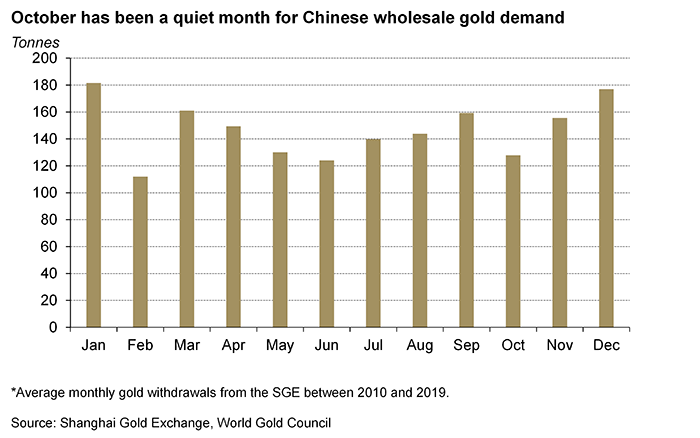
While there was a marginal y-o-y uptick in China’s wholesale physical gold demand in October, it was seasonally lower than the previous month. Historically, wholesale physical gold demand tends to be relatively lower in October than in September. First, after stocking up in September for the long-anticipated “Golden Week” holiday jewellery sales boom – which helped lift October’s jewellery sales by 17% y-o-y according to the National Bureau of Statistics – as my last blog mentioned, jewellery manufacturers’ gold supplies became relatively ample.6
Second, without major gold-related purchasing occasions and festivals, November’s gold retail sales tend to be weaker m-o-m, leading to lower wholesale gold demand in October than in September.7
The Chinese local gold price discount continued to narrow in October. The discount in SHAUPM relative to the LBMA Gold Price AM averaged US$39/oz last month, remaining around record levels. Primarily, a significantly weakened gold demand in China – gold consumption was 37% lower y-o-y in the first three quarters in 2020 – could be the fundamental driver of the record-level local gold price discounts. Meanwhile, reduced uncertainties amid the swift revival in the nation’s economic growth after the containment of COVID-19 in Q1 – the CNY has appreciated by 6% between March and October – also contributed.
With local gold demand recovering, the discount has been narrowing gradually. For instance, having narrowed by US$23/oz in September, October’s Chinese local gold price discount contracted further by US$7/oz. As noted in our recent Gold Demand Trends, while China’s gold consumption demand in the first three quarters was 37% lower y-o-y, there have been notable q-o-q rebounds in recent quarters. And as previously mentioned, gold, silver, jade and gem jewellery sales in October continued to improve, contributing to the m-o-m local gold price discount contraction.
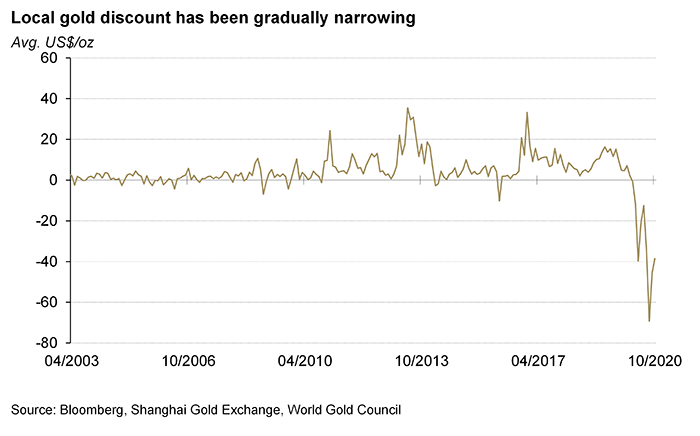
Note: SHAUPM vs LBMA Gold Price AM after April 2014; before that, Au9999 vs LBMA Gold Price AM is used.
Click here for more.
1We compare the LBMA Gold Price AM to SHAUPM because the trading windows used to determine them are closer to each other than those for the LBMA Gold Price PM. For more information about Shanghai Gold Benchmark Prices, please visit https://en.sge.com.cn/data_BenchmarkPrice.
2For more information about premium calculation, please visit www.gold.org/goldhub/data/local-gold-price-premiumdiscount.
3Au9999’s average annualised monthly return reached around 10% during periods with negative inflation between October 2002 and October 2020.
4Due to the National Day Holiday and Mid-Autumn Festival in early October, there were only 16 trading days last month.
5Please note that Bosera’s I & D shares only provide updates at the end of each quarter. As a result of these funds’ most recent quarterly reports, we made some adjustments to accurately reflect their sizes.
62020’s Golden Week holiday includes the National Day Holiday and Mid-Autumn Day holiday; it lasted from 1 October to 8 October. Jewellery sales include gold, silver, jade and gem jewellery products.
7While the 11 November (double 11) online shopping carnival initiated by major online shopping platforms in China provides notable boosts for online retail sales of many consumer goods, its contribution to the overall sales of gold products could be very limited as the majority of Chinese consumers tend to buy gold products offline, according to our most recent retail insights for the Chinese jewellery market.
Summary
Economic recovery momentum strengthened
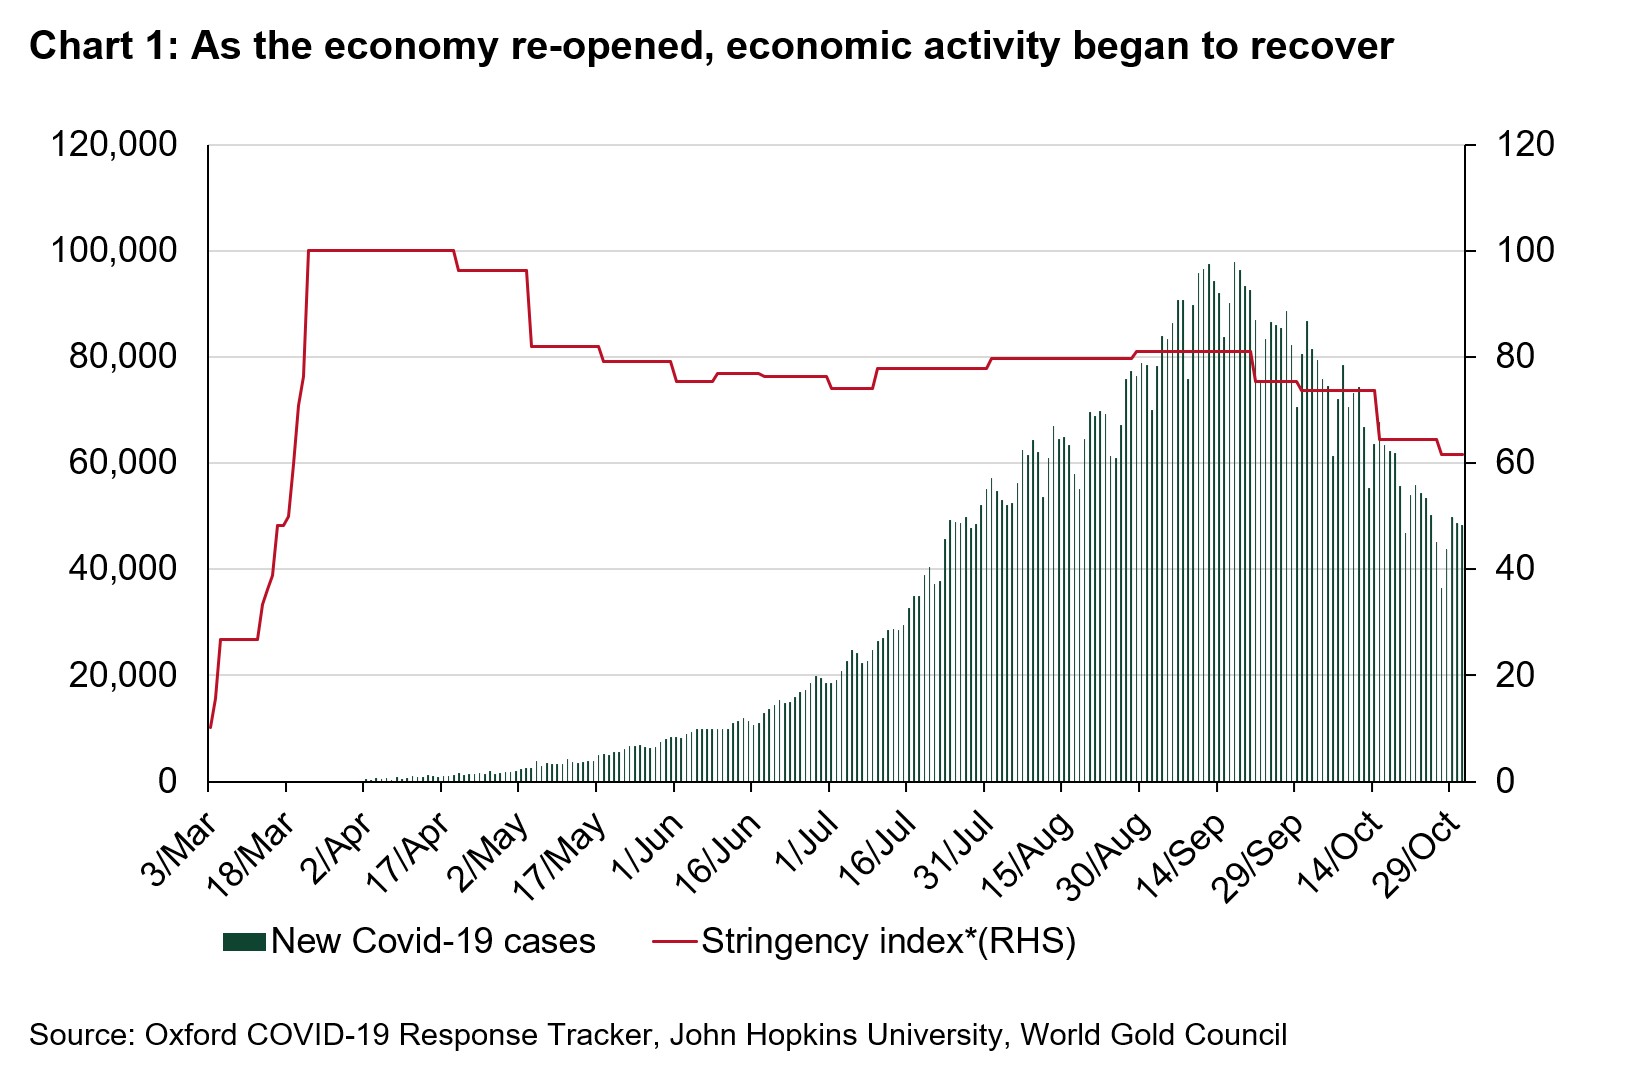
Daily new COVID-19 cases averaged ~62,000 during the month, down from ~87,000 in September. With lower daily infections lockdown restrictions were eased throughout India, helping the economy recover (Chart 1).
As restrictions eased, pent-up demand was released and several high frequency indicators started to show a recovery in economic activity:
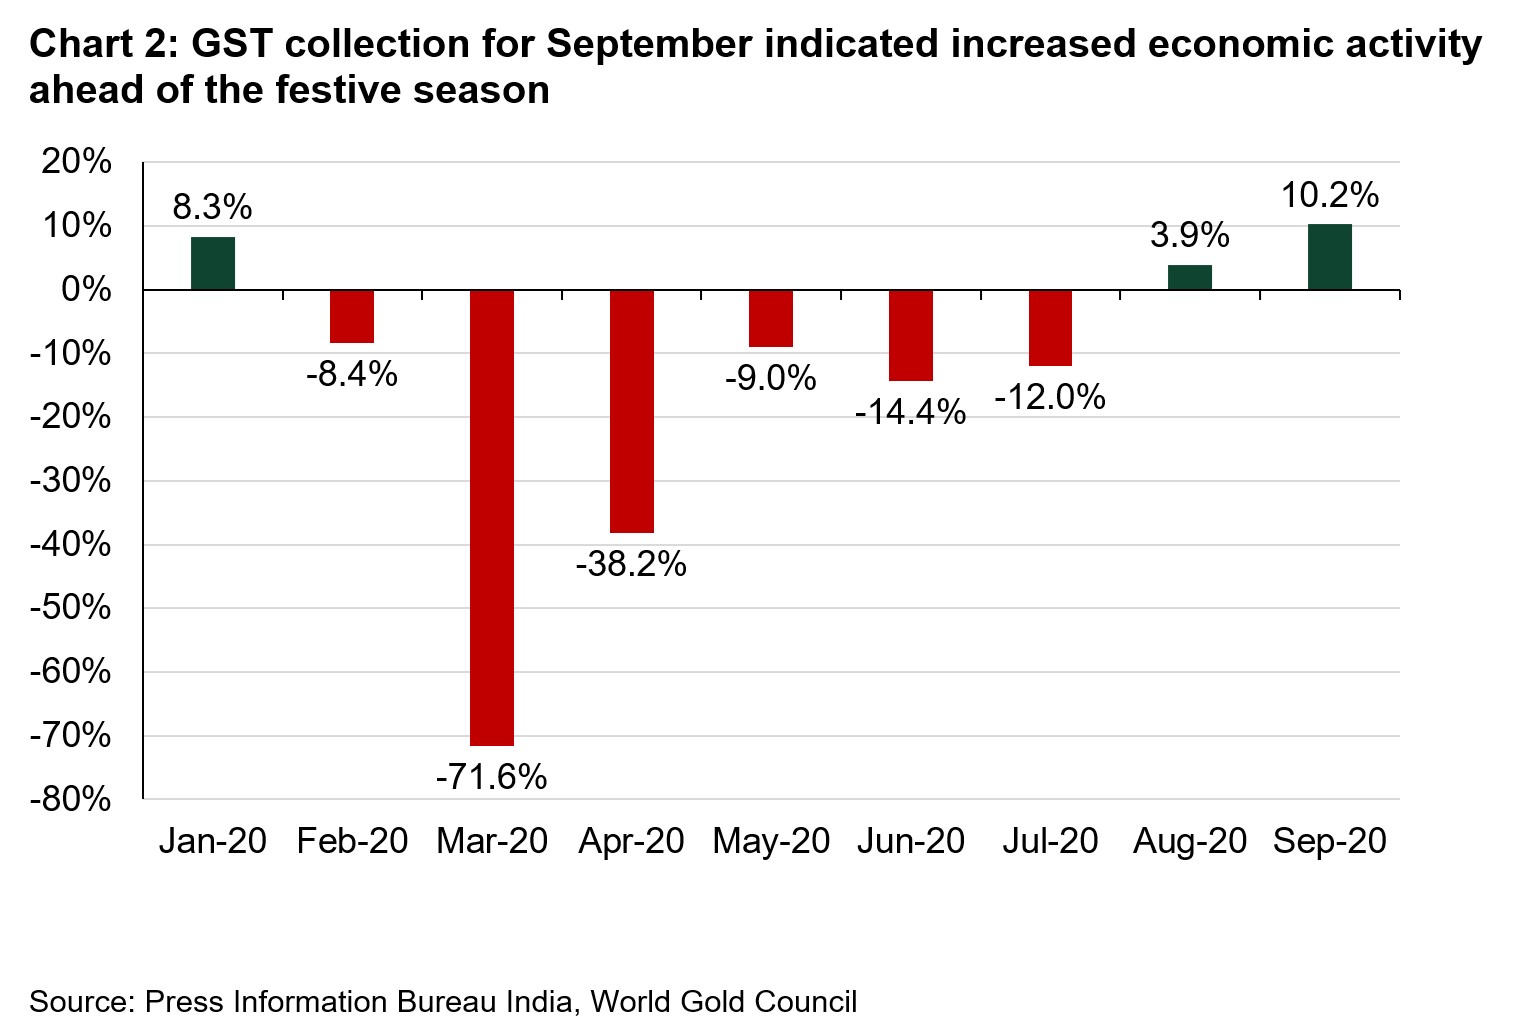
With an improvement in economic activity, GST collection for the month of September touched an eight month high at INR 1.05tn (10.2% higher y-o-y), reaching a pre-COVID level of GST collection last seen in February (Chart 2).4
The improvement in high frequency indicators bodes well for the economy, however investors remain cautious on the sustainability of this growth due to concerns that it has been skewed towards manufacturing or led by festival season demand (from October to December).
Retail demand improved in October but remained weak y-o-y
Retail demand improved following muted sales in September. The month got off to a slow start due to Adhik Maas – considered to be inauspicious for gold purchases – before picking up mid-month ahead of the Navratri festival. This seasonal demand, as well as a lower average gold price of Rs50,700/10gm (-0.4% lower m-o-m), supported gold sales. However, the average gold price in October was still 32.4% higher y-o-y, impacting retail gold demand compared to October 2019 (~25-30% lower in volume terms).
Focusing on Navratri sales, jewellers in the southern states of Tamilnadu and Karnataka reported marginally higher volume sales in the range of 5% to 15% y-o-y. A prominent southern-based retailer reported 12.5% y-o-y gold jewellery sales growth during October due to a lower gold price and Navratri sales. Retailers in tier 2 and tier 3 cities with strong rural demand also reported better sales during Navratri (Figure 1). In other states, including Gujarat, Maharashtra, Delhi and West Bengal, retailers reported more muted sales during Navratri, with 30-40% lower volume y-o-y. Retailers here reported that sales had primarily been impacted by a higher gold price and lower consumer income resulting from the impact of COVID-19. As a result, the overall volume of gold sales during Navratri was lower y-o-y.
Figure 1: Jewellery showroom getting busy during Navratri in Ratlam city

Safe haven demand and high y-t-d returns on gold attracted inflows into gold ETFs in October
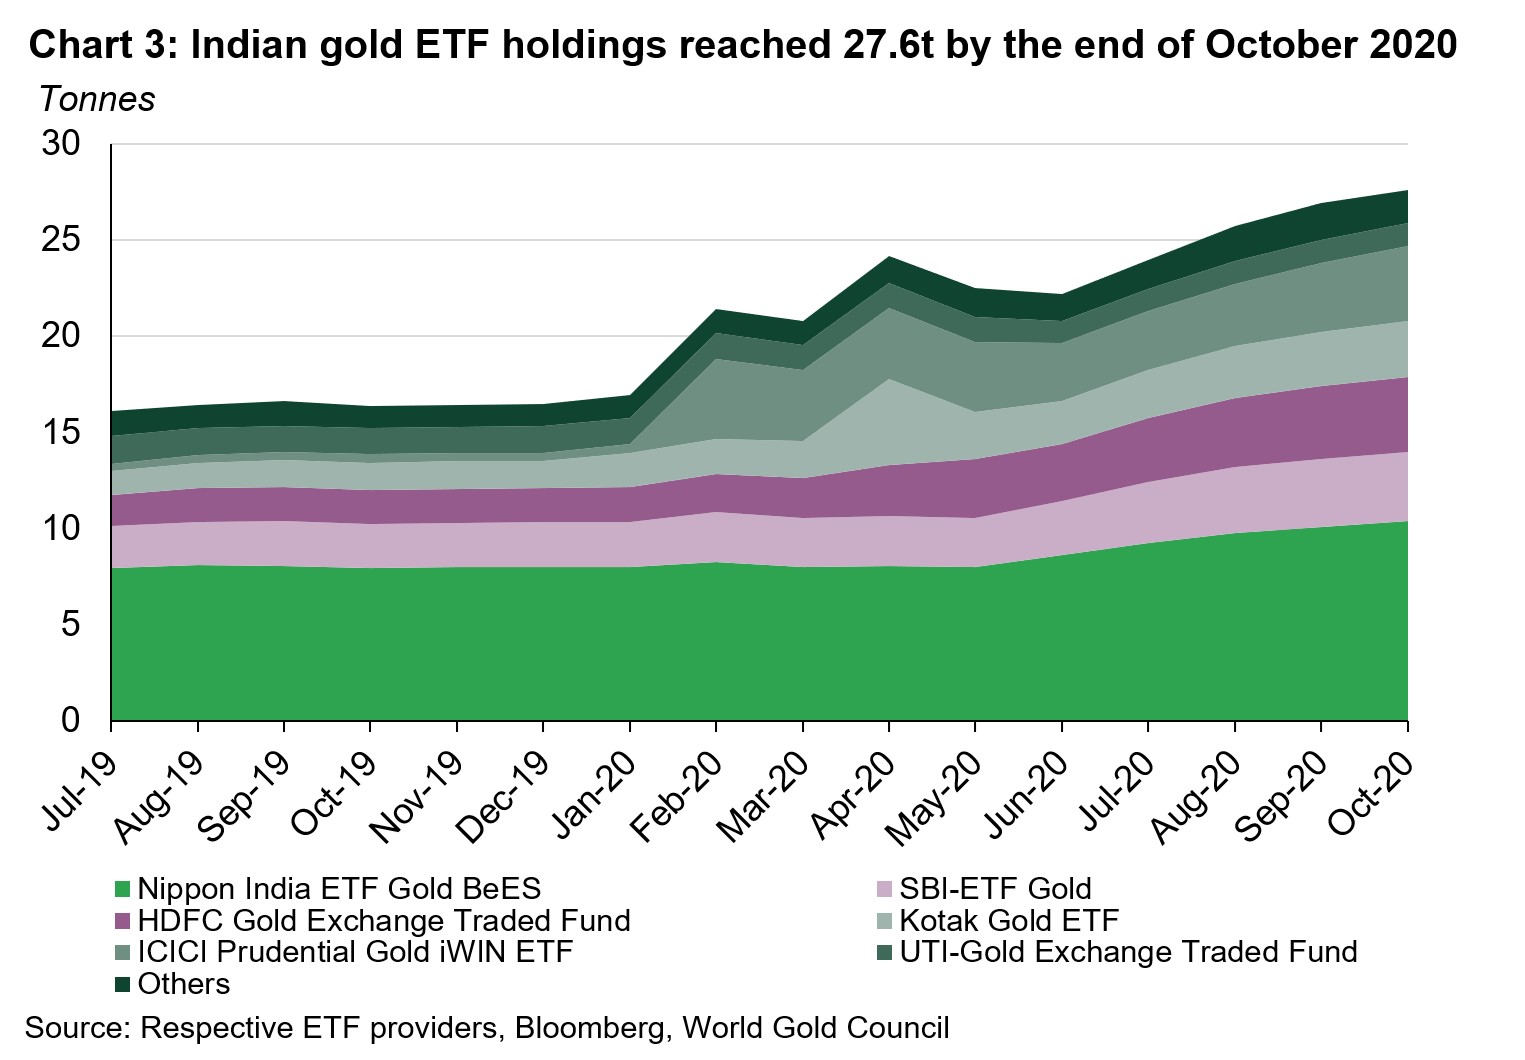
Indian gold ETFs saw inflows during the month, the seventh consecutive month of AUM growth. This was supported by safe haven demand and strong returns on gold y-t-d (29.6%). Gold has outperformed the BSE SENSEX (-2.8%) and 10-year government bonds (10.6%), supporting gold’s appeal as an asset.5 However, the net inflows of US$42.8mn were 40% lower m-o-m as some investors switched into equities (BSE SENSEX: + 4.1% m-o-m) as the economy improved and optimism grew over a potential coronavirus vaccine. Against such a backdrop, net inflows into Indian gold-backed ETFs were 0.7t during October, pushing total gold holdings to 27.6t by the end of the month (Chart 3).
Local markets was back in premia as retail demand improved ahead of Navratri
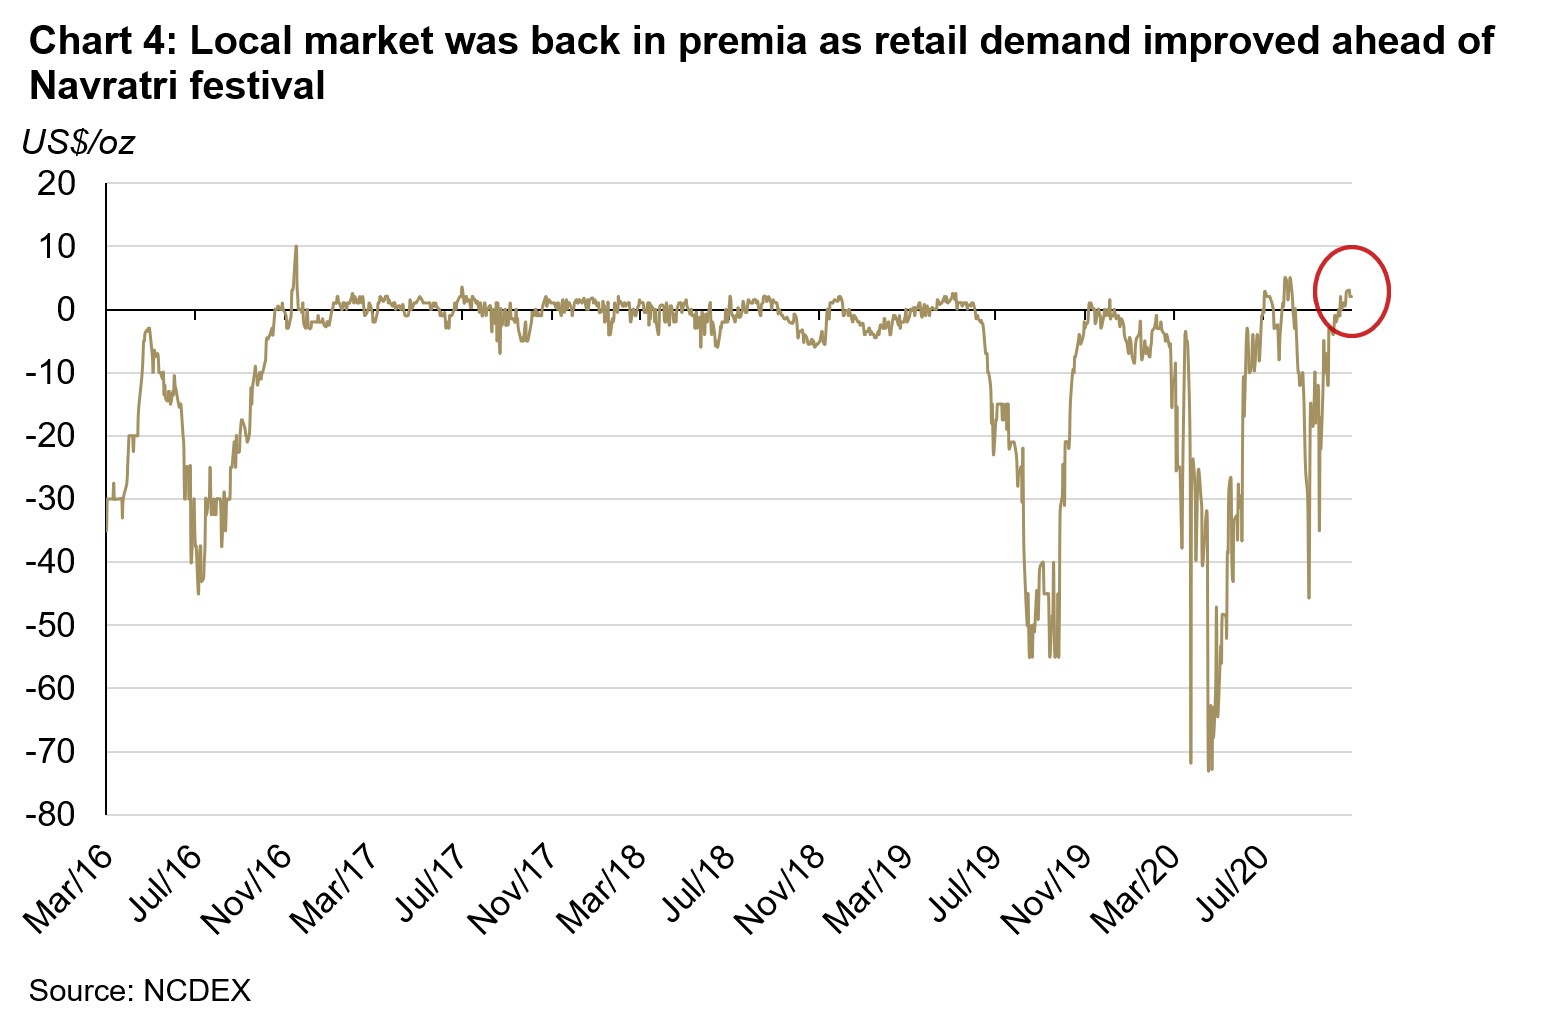
Local discount narrowed from US$40/oz to US$3/oz during September due to a gradual revival in retail demand and stocking by jewellers ahead of Navratri and the upcoming wedding season. Despite this, the local gold price was back in premium by mid-October, just ahead of the Navratri festival, with the average premium remaining at ~ US$2/oz during the second half of October (Chart 4).
India imported 40.9t of gold in October
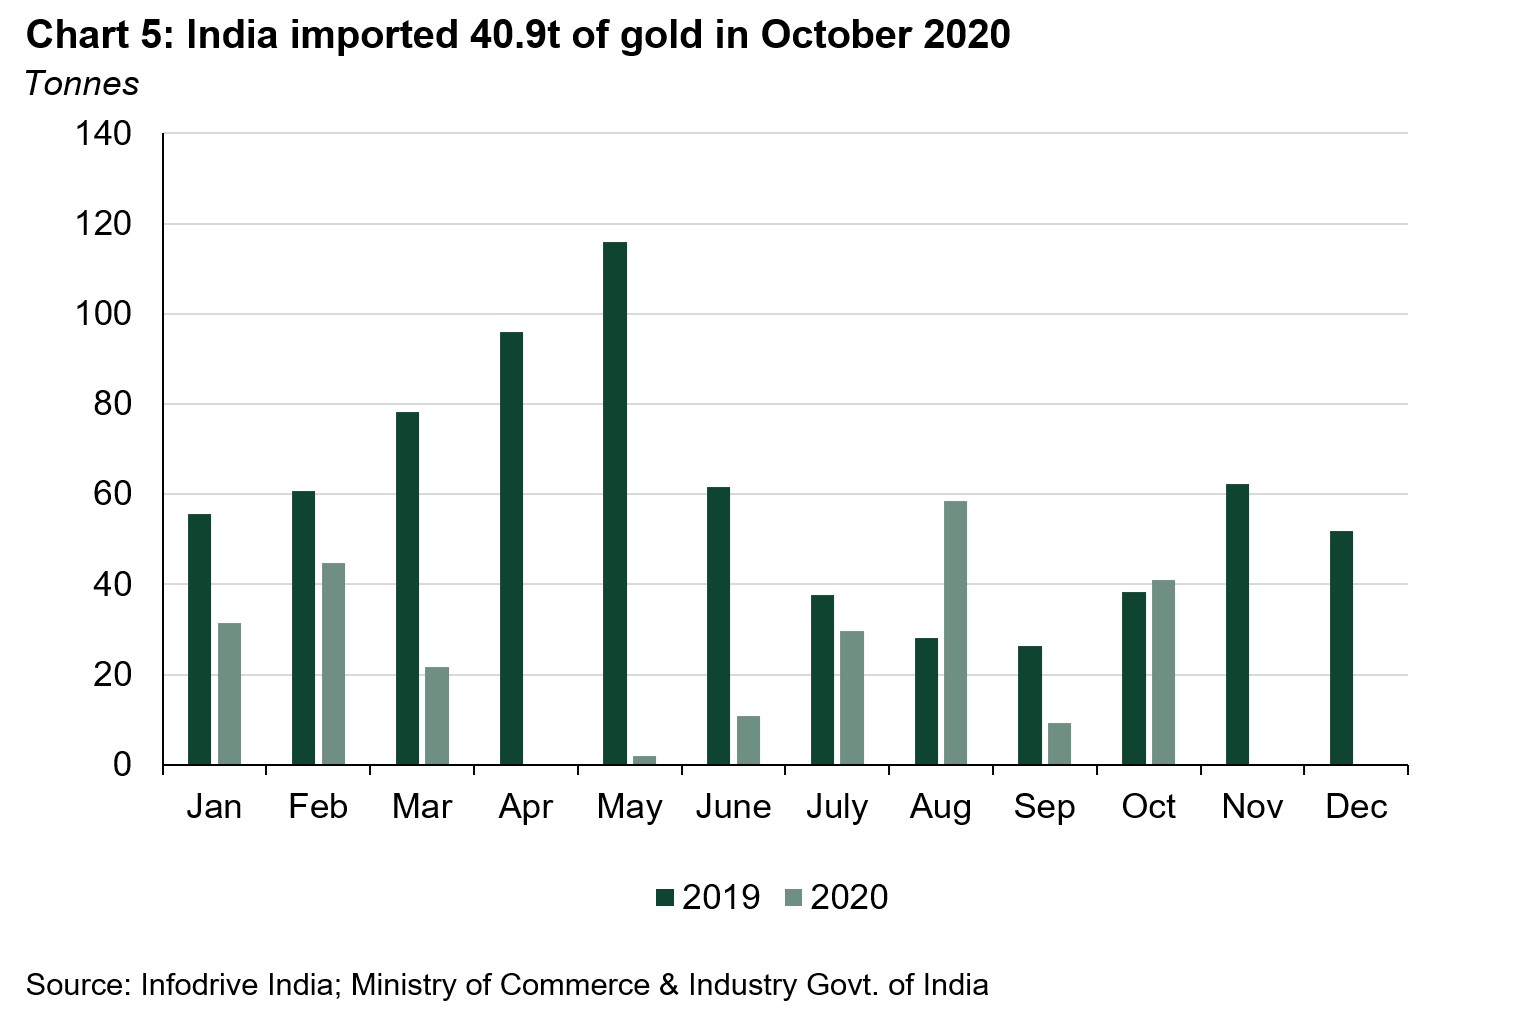
Indian official gold imports recovered to 40.9t in October, four times higher than the 9.2t seen in September. But y-t-d, gold imports remain very weak – 58% lower than the same period in 2019 (Chart 5). A total of nine banks, nominated agencies and exporters imported 24.3t of bullion during the month, and 17 refineries imported 16.3t of gold doré (fine gold content).
Looking at import data in October, ~66% of the official imports landed in India during the last two weeks of the month when the retail demand improved ahead of the Navratri festival. Further, out of a total of 40.9t official imports, 11.5t were imported in Sri City Free Trade Warehousing Zone (FTWZ).6 These imports landed in FTWZ with an expectation of recovery in demand at the beginning of the festival season – from Navratri in October to Dhanteras in November, as well as the wedding season.
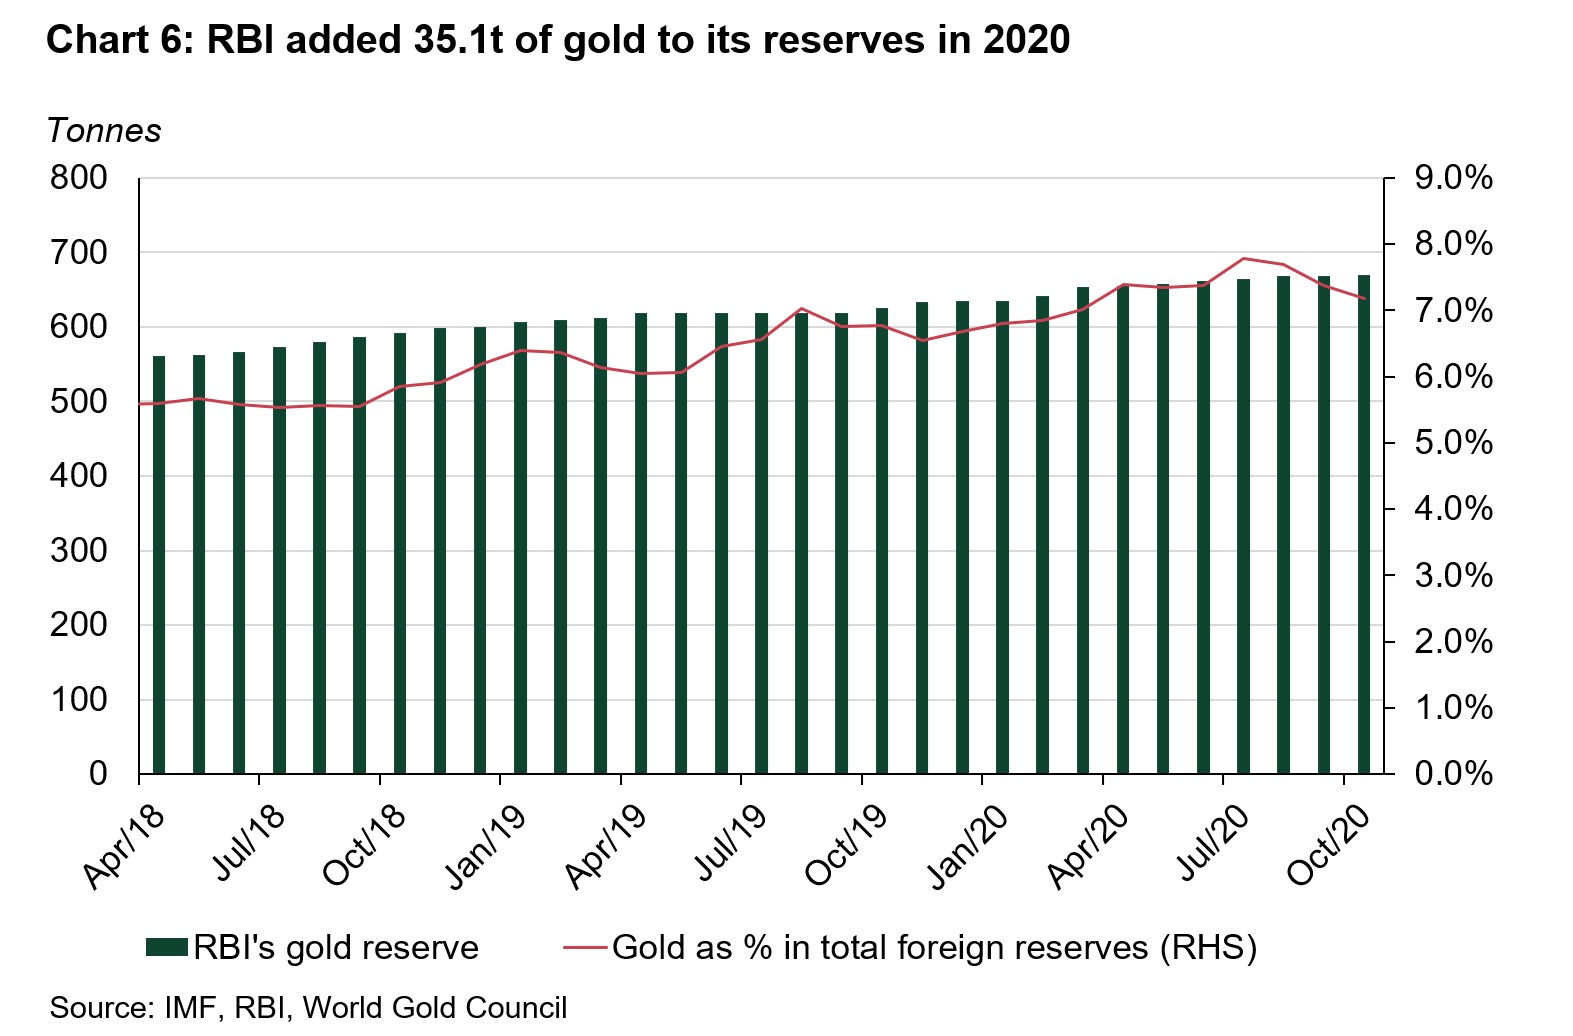
RBI added 35.1t of gold reserves in 2020
The RBI purchased an additional 1.9t in October, bringing y-t-d purchases to 35.1t and taking its total gold reserves to 670.1t – 7.2% of total reserves (Chart 6).7 The RBI has stepped up its gold purchases with the aim of diversifying its foreign reserves and maintaining the safety and liquidity of its forex reserves.
Footnotes
1As of 30 October 2020.
2 Navratri is an annual Hindu festival which spans nine nights and is celebrated as a mark of victory of good over evil. Navratri was celebrated in India from 17 October to 25 October.
3 E-Way bill is an electronic way bill for movement of goods generated on the E-Way bill portal. A GST registered person cannot transport goods valued more than Rs50,000 (single invoice/bill/delivery challan) in a vehicle without an E-Way bill that is generated on ewaybillgst.gov.in.; https://cleartax.in/s/eway-bill-gst-rules-compliance
4 GST collection data reported on 1 October 2020 is for the GST collection in the month of September. GST data is published on the first day of every month for the GST collected in the previous month.
5 As of 30 October 2020. Computations in Indian Rupee of total return indices for BSE Sensex and S&P BSE India Government Bond Index. For domestic gold price MCX India Gold Spot Index is considered.
6 FTWZ offers a distinct advantage as overseas suppliers can import gold into the custom-bonded warehouse of FTWZ without paying customs duty for authorised operations. Imported gold can be stored in FTWZ for a long period – as long as the letter of approval (LOA) is valid – thus reducing the logistics time in supplying to the domestic market as compared to importing from the overseas market.
7 Central Bank data is taken from IMF-IFS. IFS up until September and weekly statistics have been taken from RBI for October. Please refer to our latest Central Bank Statistics https://www.gold.org/goldhub/data/monthly-central-bank-statistics
Despite a challenging year due to the COVID-19 pandemic, gold miners are now benefiting from significantly higher margins resulting from a continued focus on operational and cost efficiencies combined with a strong gold price.
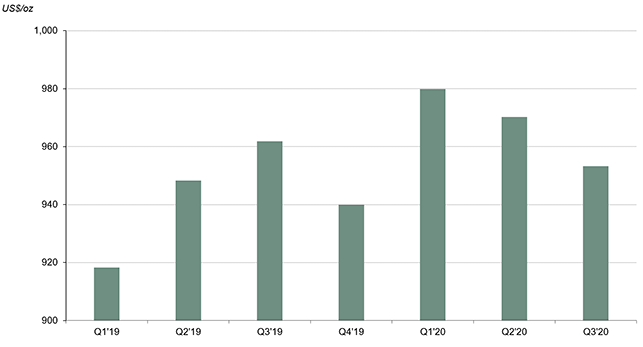
In Q3’20 the global average All-in Sustaining Cost (AISC) was US$953/oz, a 2% drop from the previous quarter. This decline was largely a result of mines returning to normal production rates following significant disruption in Q2’20 from COVID-19 lockdowns. Countries including South Africa, Peru and Mexico implemented policies that required mines to temporarily halt operations in an attempt to control the spread of the virus. This led to a 10% y/y drop in global output in Q2’20 and also pushed costs higher during ramp down and re-start phases between closures periods. The last of the these countrywide restrictions were lifted at the end of May and most mines returned to normal production rates in Q3’20. As a result unit costs were lower and global production for the quarter dropped by a more modest 3% y/y.
Source: Metals Focus Gold Mine Cost Service
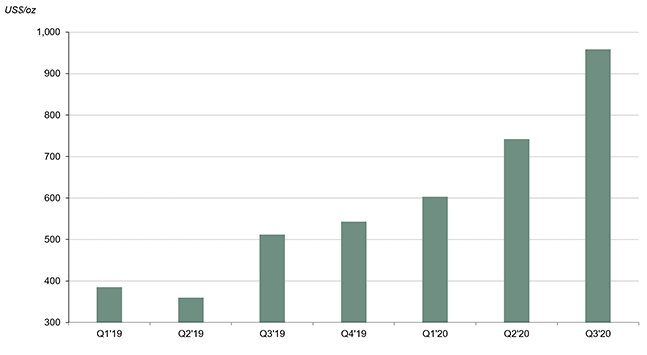
Meanwhile the gold price hit a new record high in August and the quarterly average price increased by 29% q/q in Q3’20 to US$1,912/oz. Despite strong gold prices this year producers are currently remaining focused on constraining costs in order to maximise the value from their assets and improve returns to shareholders. As a result of these efforts, combined with easing of COVID-19 disruption and higher gold prices, gold miners’ margins have increased significantly. The average AISC margin (gold price minus AISC) was US$959/oz in Q3’20, a rise of 29% q/q and a substantial 87% y/y. With producers currently remaining focused on cost control and gold prices expected to remain strong moving forward, similar levels of profitability are likely to remain in the near term.