An unprecedented H1
Global gold market trading volumes2 moderated in June, falling 13% m/m to an average of US$373bn/day as activity cooled across over-the-counter (OTC) and exchange-traded markets. OTC activities declined 13% to US$214bn/day, although continued to run well above the 2025 average of US$180bn/day. Trading volumes at the LBMA averaged US$187bn/day in June, 14% lower than May but 16% higher than the 2025 average. Meanwhile, exchange-traded contract volumes fell 13% to US$153bn/day. The notable exception was the gold ETF market, where trading activity increased 23% m/m to US$6.9bn/day, reflecting sustained investor interest.
Global gold market liquidity surged to record levels in H1 at US$488bn per day; the strongest semi-annual average in our data series (Chart 2). Strength was broad-based, with every major segment posting its most active semi-annual averages on record. OTC trading, led by the LBMA, averaged US$249bn/day, substantially above 2025 levels and underscoring the depth of institutional participation. Exchange-traded volumes also jumped, reaching US$227bn/day – 22% higher than the 2025 average – supported by elevated investor activity. Meanwhile, global gold ETF trading averaged US$12bn/day – up 73% from 2025 – fuelled primarily by robust trading in US funds as investors increasingly turned to gold amid heightened macroeconomic and geopolitical uncertainty.
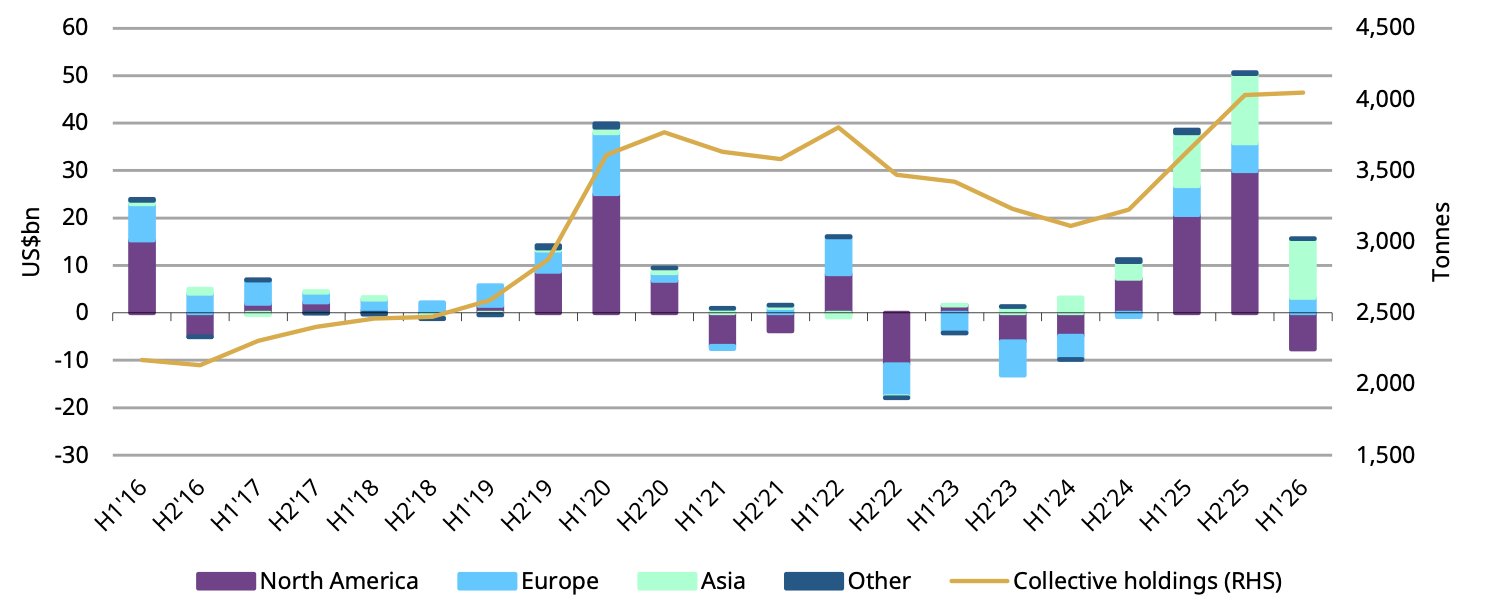
Despite a weaker gold price, total COMEX net longs rebounded by 16% m/m to 538t, the highest month-end level since January.3 It is noteworthy that managed money net longs have been rising since early June despite a weakening gold price. A closer look at the CFTC positioning data reveals a divergence across investor cohorts: while non-reportable net longs – a proxy for retail participation – reduced during the month, other reportables, which capture large trades outside the managed money category, increased by 16% m/m.
Over H1, managed money net longs remained broadly stable, declining by just 43t y-t-d. But as was evident in June, investor behaviour through H1 differed: retail positioning largely tracked short-term price movements while larger traders’ positions have, in general, stayed stable since mid-March.
Chart 2: H1 global gold market liquidity rose to the highest in our data series
Average daily trading volumes by segment*
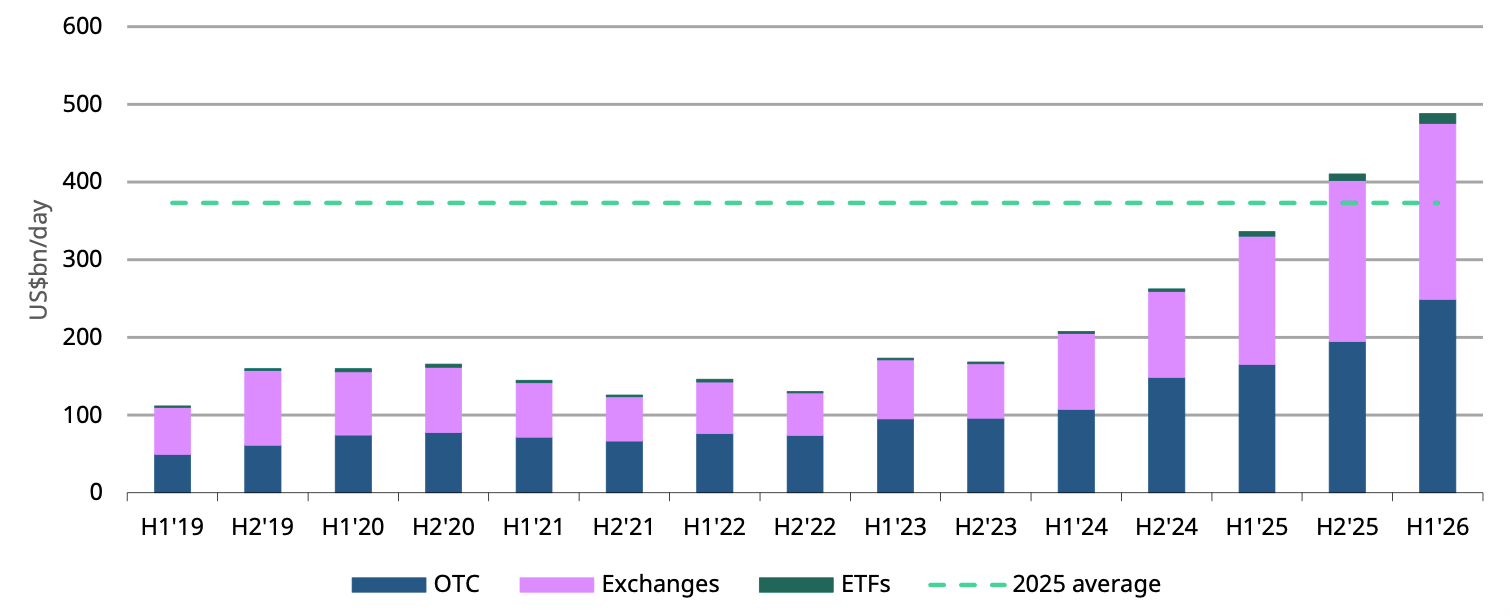
*Data as of 30 June 2026. Gold price based on the monthly average LBMA PM Gold Price USD.
For more information on trading volumes please visit our Trading Volumes page on Goldhub: Gold Trading Volume | Gold Daily Volume | World Gold Council.
Source: Bloomberg, Nasdaq, COMEX, ICE Benchmark Administration, Shanghai Gold Exchange, Shanghai Futures Exchange, ETF providers, Multi Commodity Exchange of India, Dubai Gold & Commodities Exchange, Japan Exchange Group, Thailand Futures Exchange, Borsa Istanbul, Bursa Malaysia, Korea Exchange, World Gold Council.
