China gold market update: Strong official sector buying in July
Ray Jia
Head of Research (Asia Pacific, ex-India) and Deputy Head of Trade Engagement (China) World Gold CouncilHighlights
- Gold prices stabilised in July: the LBMA Gold Price PM was unchanged and the Shanghai Benchmark Gold Price PM rose mildly by 0.7%; both broke higher in early August
- Chinese gold ETFs recorded positive flows, lifting total holdings 5t higher in July to 282t; this positive trend has continued so far in August, with inflows recorded almost every trading day1
- As the gold price volatility declined, gold futures’ trading volumes cooled but net longs rose in July
- Wholesale demand stayed tepid last month, reflecting ongoing weakness in the jewellery sector
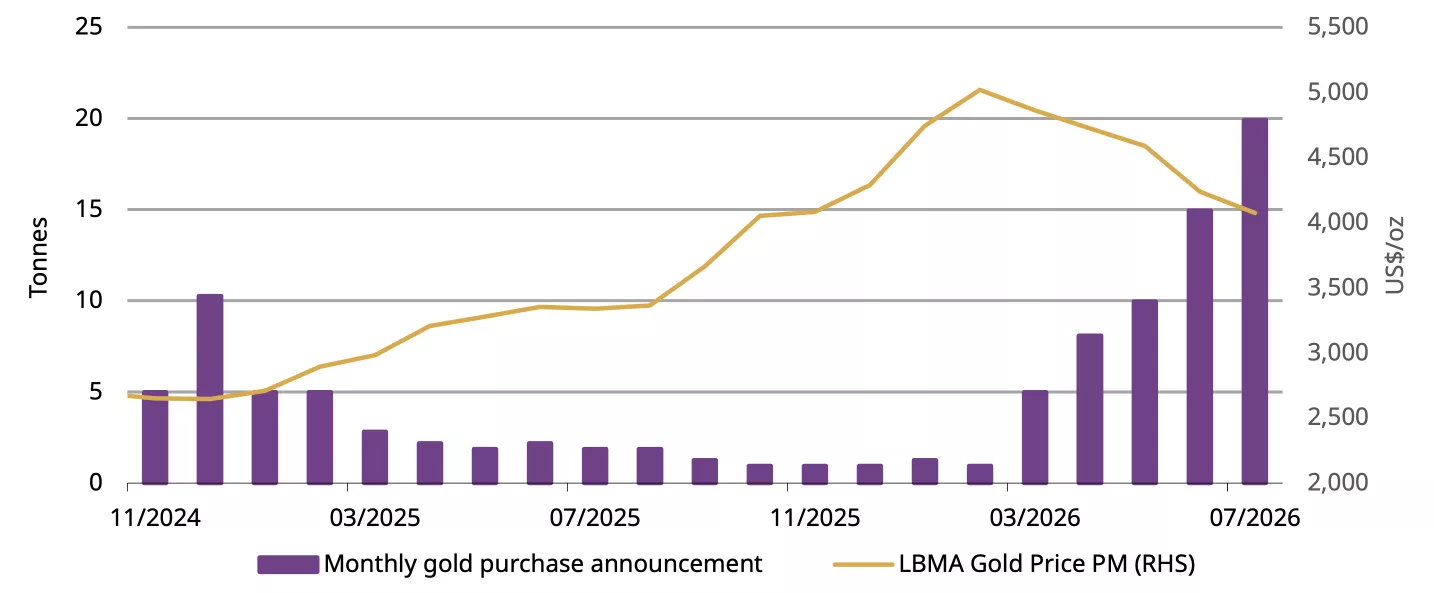
- The People’s Bank of China (PBoC) reported an addition of 20t of gold during July, the largest since late 2023 and the 21st consecutive monthly purchase.
Looking ahead
- If the gold price continues to break higher investment demand for gold may improve. However, the domestic equity market rebound in early August – should it persist – could divert attention. Wholesale gold demand could receive seasonal support from a rise in jewellers’ inventory replenishment ahead.
Gold steady in July
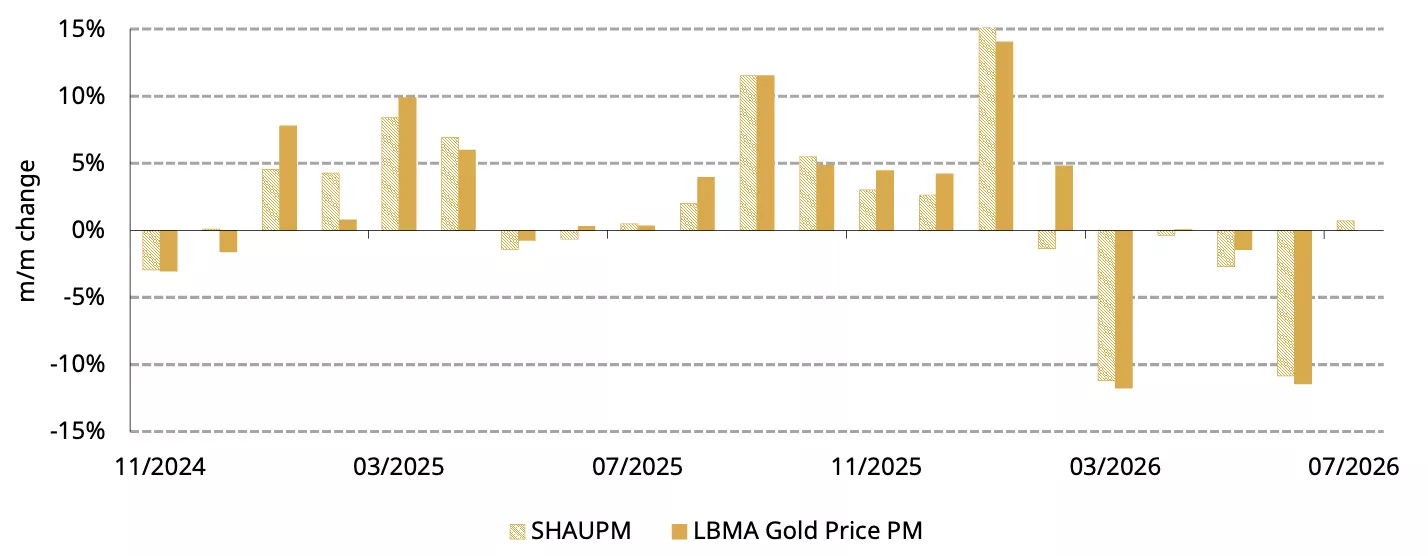
Gold stabilised in July. The LBMA Gold Price PM in USD and SHAUPM in RMB were almost unchanged during the month. Our gold return attribution model shows that a weaker dollar and improved investor positioning supported gold, offsetting pressure from rising yields (Chart 1). And in early August, gold rose higher on softer US labour market data and cooling inflation, which delayed expectations of rate hikes from the Fed; the RMB gold price rallied above its 60-day moving average of around RMB920/gram for the first time since mid-March.2
Chart 1: Gold stabilised in July
Monthly returns of gold prices in USD and RMB*
*Data to 31 July 2026. Based on the LBMA Gold Price PM in USD and the Shanghai Benchmark Gold Price PM in RMB.
Source: Shanghai Gold Exchange, ICE Benchmark Administration, World Gold Council
Chinese gold ETF flows flipped positive
Chinese gold ETFs attracted inflows of RMB5bn (US$744mn) in July, reversing the sizeable outflows over previous months. Healthy inflows lifted Chinese gold ETFs’ total AUM by 3% to RMB 250bn (US$37bn). In tonnage terms, holdings increased 5t to 282t. In July, investor interest was buoyed by recurring geopolitical uncertainty, weaker equities and persistent gold accumulation by the PBoC. Meanwhile, rising institutional investor participation as the gold price stabilised also supported demand in the month.
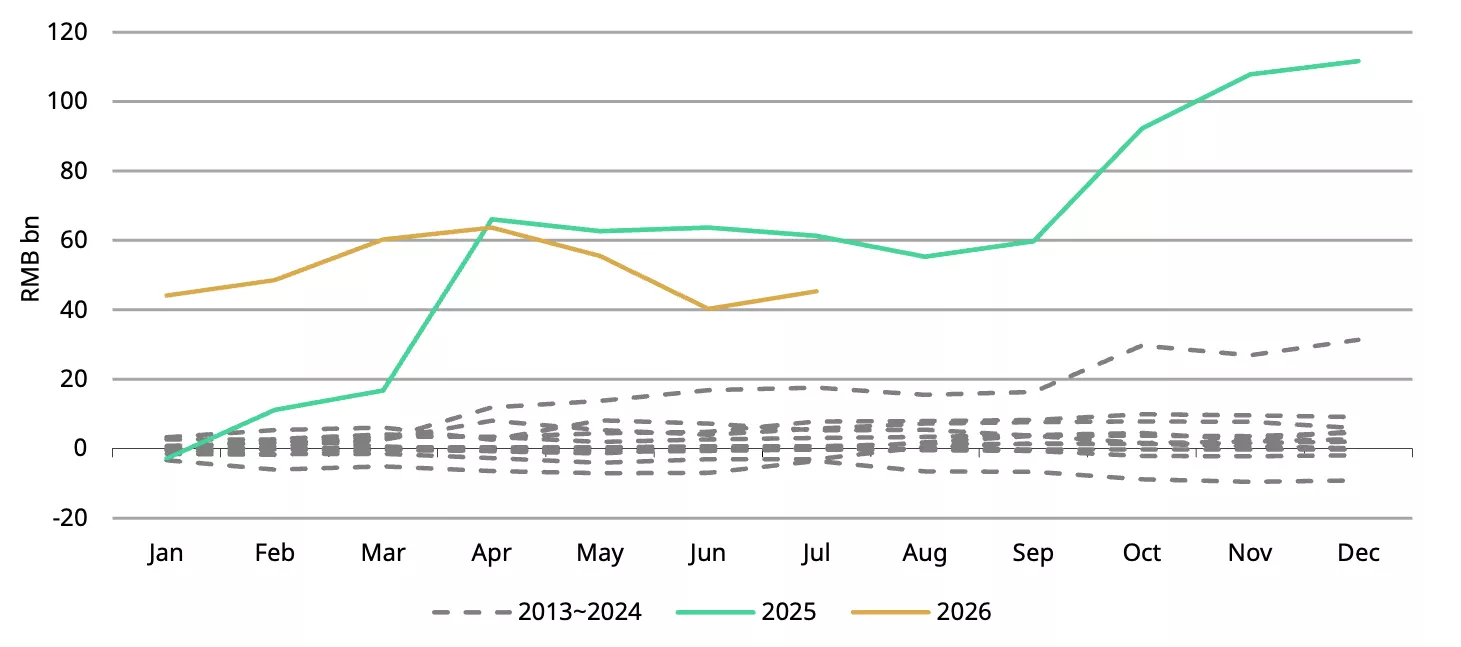
Despite outflows in May and June, Chinese gold ETFs attracted RMB45bn (US$6.3bn, 34t) between January and July, the second strongest y-t-d performance on record (Chart 2), reflecting increased institutional participation and higher allocations amid various uncertainties.
And it is worth noting that so far in August, Chinese gold ETFs have added ~8t with inflows seen almost every day in the month, mainly supported by the strong gold price momentum.3
Chart 2: Strong y-t-d performance of Chinese gold ETFs
Chinese gold ETF demand and holdings in tonnes*
*Data to 31 July 2026.
Source: Company filings, World Gold Council
Gold futures volumes down, net longs up last month
Gold futures trading volumes on the SHFE further moderated in July, falling 4% m/m to 292t/day. Trading activity cooled slightly as gold price volatility declined. Top 20 gold futures participants’ net longs – due to data limitation – at the SHFE rose 24t to 117t by the end of July, reflecting improved market sentiment.
Wholesale demand stayed tepid last month
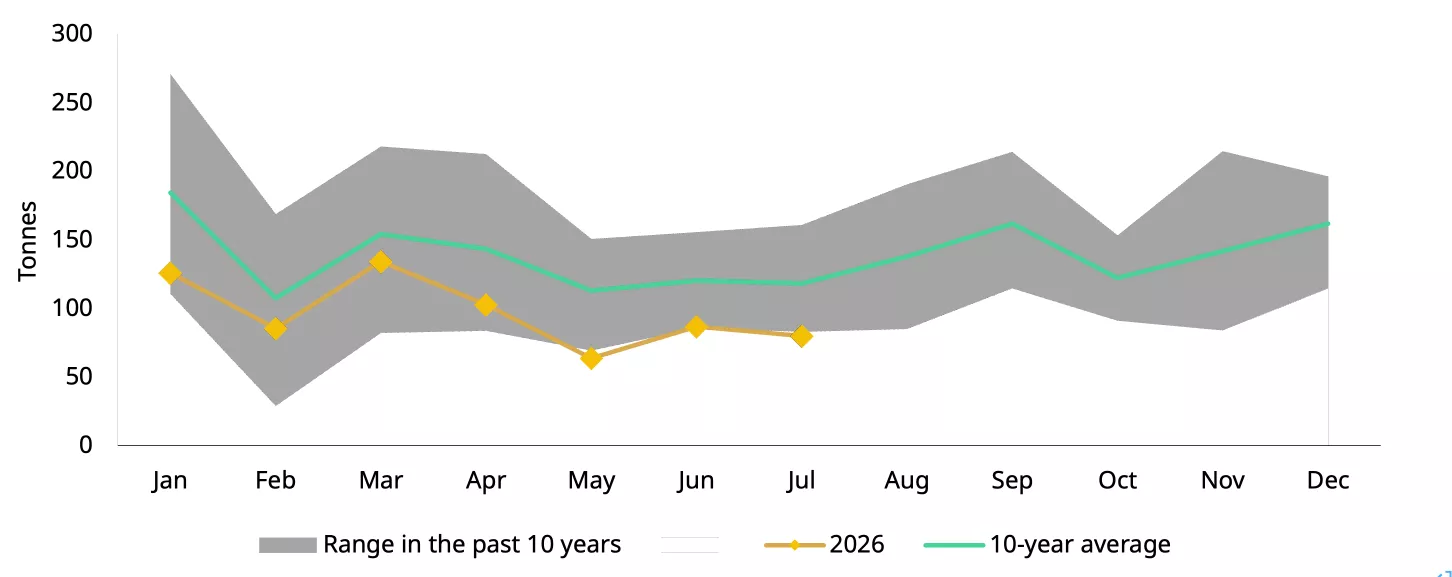
Wholesale gold demand, as measured by SGE withdrawals by banks, jewellers and refiners, fell 8% m/m to 80t in July (Chart 3). The decline was largely seasonal, as the jewellery sector is typically tepid in Q2 and early Q3. Industry feedback also suggests that investment demand was broadly unchanged from June and therefore failed to offset softer jewellery-related buying. On a y/y basis, SGE withdrawals were down 15%, reflecting subdued jewellery consumption amid higher gold prices than a year ago and still-weak consumer confidence.
Chart 3: Wholesale demand remains tepid in July
Gold withdrawals from the SGE by month and the ten-year monthly average*
*As of 31 July 2026. Ten-year average based on data between 2016 and 2025.
Source: Shanghai Gold Exchange, World Gold Council
The PBoC added more gold in July
The PBoC reported a 20t increase in gold reserves in July (Chart 4), bringing official gold holdings to 2,366t, 8% of total foreign exchange reserves. Following the largest monthly addition since October 2023, the PBoC’s gold-buying streak has now reached 21 months, the longest on record. The central bank continued to accelerate its buying, likely taking advantages of a lower gold price and underscoring gold’s strategic role in reserve diversification amid an increasingly fragmented geopolitical landscape.
Chart 4: The PBoC ramped up gold purchasing efforts as the price softened
The PBoC’s reported gold purchases and the gold price*
*Data to 31 July 2026.
Source: State Administration of Foreign Exchanges, World Gold Council
Imports elevated in June
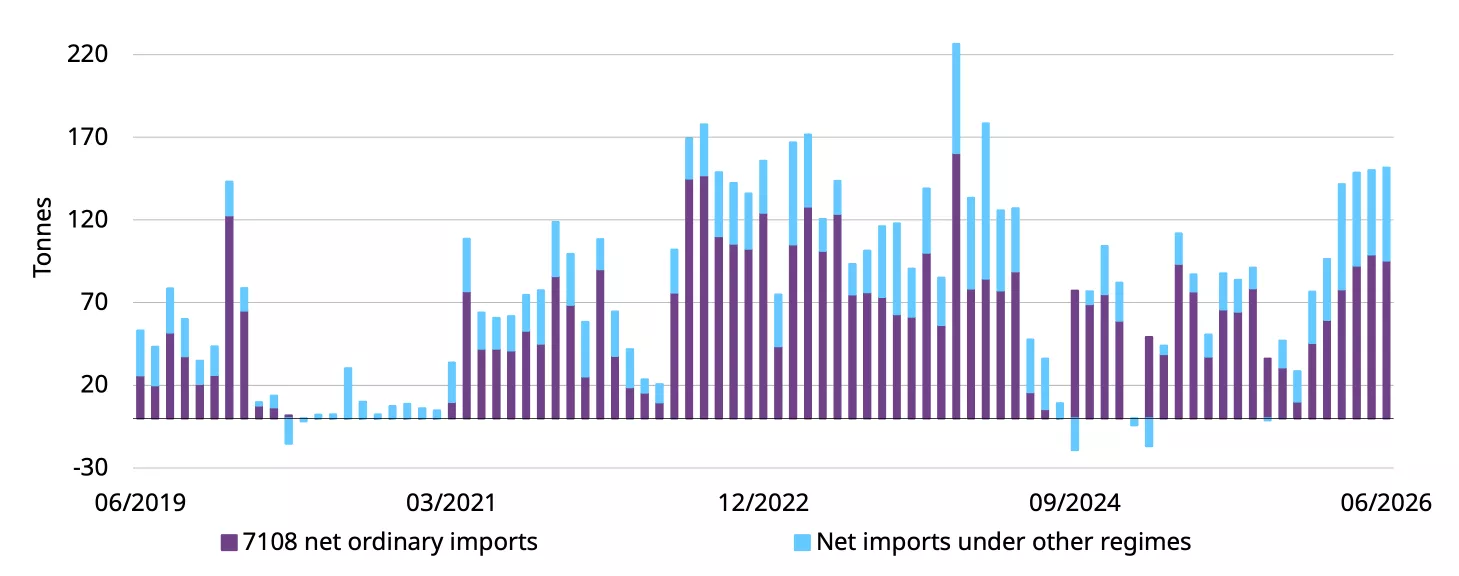
China’s net gold imports totalled 152t in June (Chart 5) according to the latest available data, a mild 2t m/m rise, but the highest since March 2024. Over the course of H1 China imported 764t of gold, 138% higher y/y, reflecting strong investment buying during the period.
Chart 5: Gold imports were higher in June
Net gold imports under HS7108*
*Data to June 2026.
Source: China Customs, World Gold Council
Footnotes
1Based on daily flows data as of 12 August; Chinese gold ETFs recorded non-stop inflows every day during the period except for 12 August.
2Based on the daily close prices of Au99.99 as of 12 August. For more, see: Gold Spot Prices & Market History | World Gold Council.
3Based on Chinese gold ETF demand as of 12 August. For more, see: Gold ETF: Stock, Holdings and Flows | World Gold Council.
Disclaimer
Important information and disclaimers
© 2026 World Gold Council. All rights reserved. World Gold Council and the Circle device are trademarks of the World Gold Council or its affiliates.
All references to LBMA Gold Price are used with the permission of ICE Benchmark Administration Limited and have been provided for informational purposes only. ICE Benchmark Administration Limited accepts no liability or responsibility for the accuracy of the prices or the underlying product to which the prices may be referenced. Other content is the intellectual property of the respective third party and all rights are reserved to them.
Reproduction or redistribution of any of this information is expressly prohibited without the prior written consent of World Gold Council or the appropriate copyright owners, except as specifically provided below. Information and statistics are copyright © and/or other intellectual property of the World Gold Council or its affiliates or third-party providers identified herein. All rights of the respective owners are reserved.
The use of the statistics in this information is permitted for the purposes of review and commentary (including media commentary) in line with fair industry practice, subject to the following two pre-conditions: (i) only limited extracts of data or analysis be used; and (ii) any and all use of these statistics is accompanied by a citation to World Gold Council and, where appropriate, to Metals Focus or other identified copyright owners as their source. World Gold Council is affiliated with Metals Focus.
The World Gold Council and its affiliates do not guarantee the accuracy or completeness of any information nor accept responsibility for any losses or damages arising directly or indirectly from the use of this information.
This information is for educational purposes only and by receiving this information, you agree with its intended purpose. Nothing contained herein is intended to constitute a recommendation, investment advice, or offer for the purchase or sale of gold, any gold-related products or services or any other products, services, securities or financial instruments (collectively, “Services”). This information does not take into account any investment objectives, financial situation or particular needs of any particular person.
Diversification does not guarantee any investment returns and does not eliminate the risk of loss. Past performance is not necessarily indicative of future results. The resulting performance of any investment outcomes that can be generated through allocation to gold are hypothetical in nature, may not reflect actual investment results and are not guarantees of future results. The World Gold Council and its affiliates do not guarantee or warranty any calculations and models used in any hypothetical portfolios or any outcomes resulting from any such use. Investors should discuss their individual circumstances with their appropriate investment professionals before making any decision regarding any Services or investments.
This information may contain forward-looking statements, such as statements which use the words “believes”, “expects”, “may”, or “suggests”, or similar terminology, which are based on current expectations and are subject to change. Forward-looking statements involve a number of risks and uncertainties. There can be no assurance that any forward-looking statements will be achieved. World Gold Council and its affiliates assume no responsibility for updating any forward-looking statements.
Information regarding the LBMA Gold Price
The LBMA Gold Price is used by the World Gold Council with permission under license by ICE Benchmark Administration Limited and is subject to the restrictions set forth here (www.gold.org/terms-and-conditions).
Information regarding QaurumSM and the Gold Valuation Framework
Note that the resulting performance of various investment outcomes that can be generated through use of Qaurum, the Gold Valuation Framework and other information are hypothetical in nature, may not reflect actual investment results and are not guarantees of future results. Neither World Gold Council (including its affiliates) nor Oxford Economics provides any warranty or guarantee regarding the functionality of the tool, including without limitation any projections, estimates or calculations.
Information from ICRA Analytics Limited
All information obtained from ICRA Analytics Limited contained in this document is subject to the disclaimer set forth here (www.icraanalytics.com/terms-of-use/disclaimer).
India gold market update: Recovery taking shape
Kavita Chacko
Research Head, India World Gold CouncilHighlights
- International and domestic gold prices1 gained ground in August, partially reversing June’s sharp correction after a period of stability in July
- Jewellery demand reportedly strengthened: consumers responded to lower and more stable prices, while retailers and manufacturers replenished inventories ahead of the festive season
- Investment demand remained steady; gold ETFs continue to attract inflows, bar and coin demand held up, albeit softer than the heightened levels seen earlier in the year
- Activity in the futures market picked up in July, lifting trading volumes and turnover
- Gold imports rebounded in July, signalling firmer demand conditions.
Looking ahead
- Demand conditions are improving, raising expectations of a stronger festive season. While elevated prices may continue to influence jewellery purchases, investment demand remains supportive.
Correction gives way to recovery
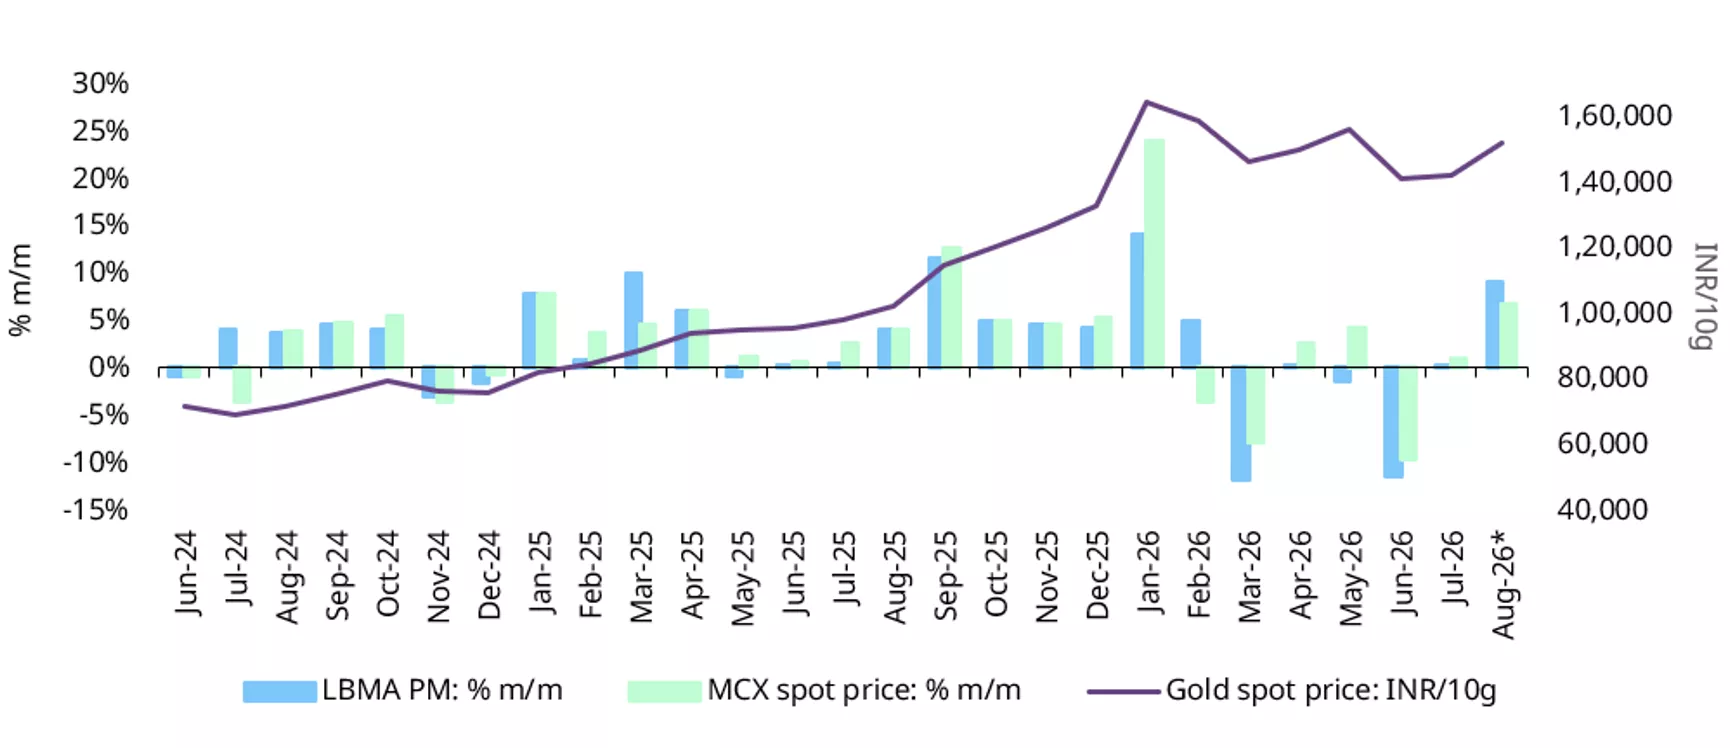
Following a sharp price correction in June, gold prices stabilised during July before recovering in early August, reaching their highest levels in over two months. International gold price (LBMA Gold PM) rose 9% in the first two weeks of August to US$4,391/oz, while domestic prices gained nearly 7% to INR151,744/10g.2 The appreciation of the INR against the US dollar partially offset the rise in the international price, limiting gains in domestic prices.
Shifting monetary policy expectations, a weaker US dollar, and renewed inflows into gold ETFs supported gold prices, contributing to the recent recovery in the gold market.
Chart 1: Gold regains ground
Month-end LBMA Gold Price PM and MCX spot gold price changes and movement*
*As of 14 August, 2026.
Source: Bloomberg, World Gold Council
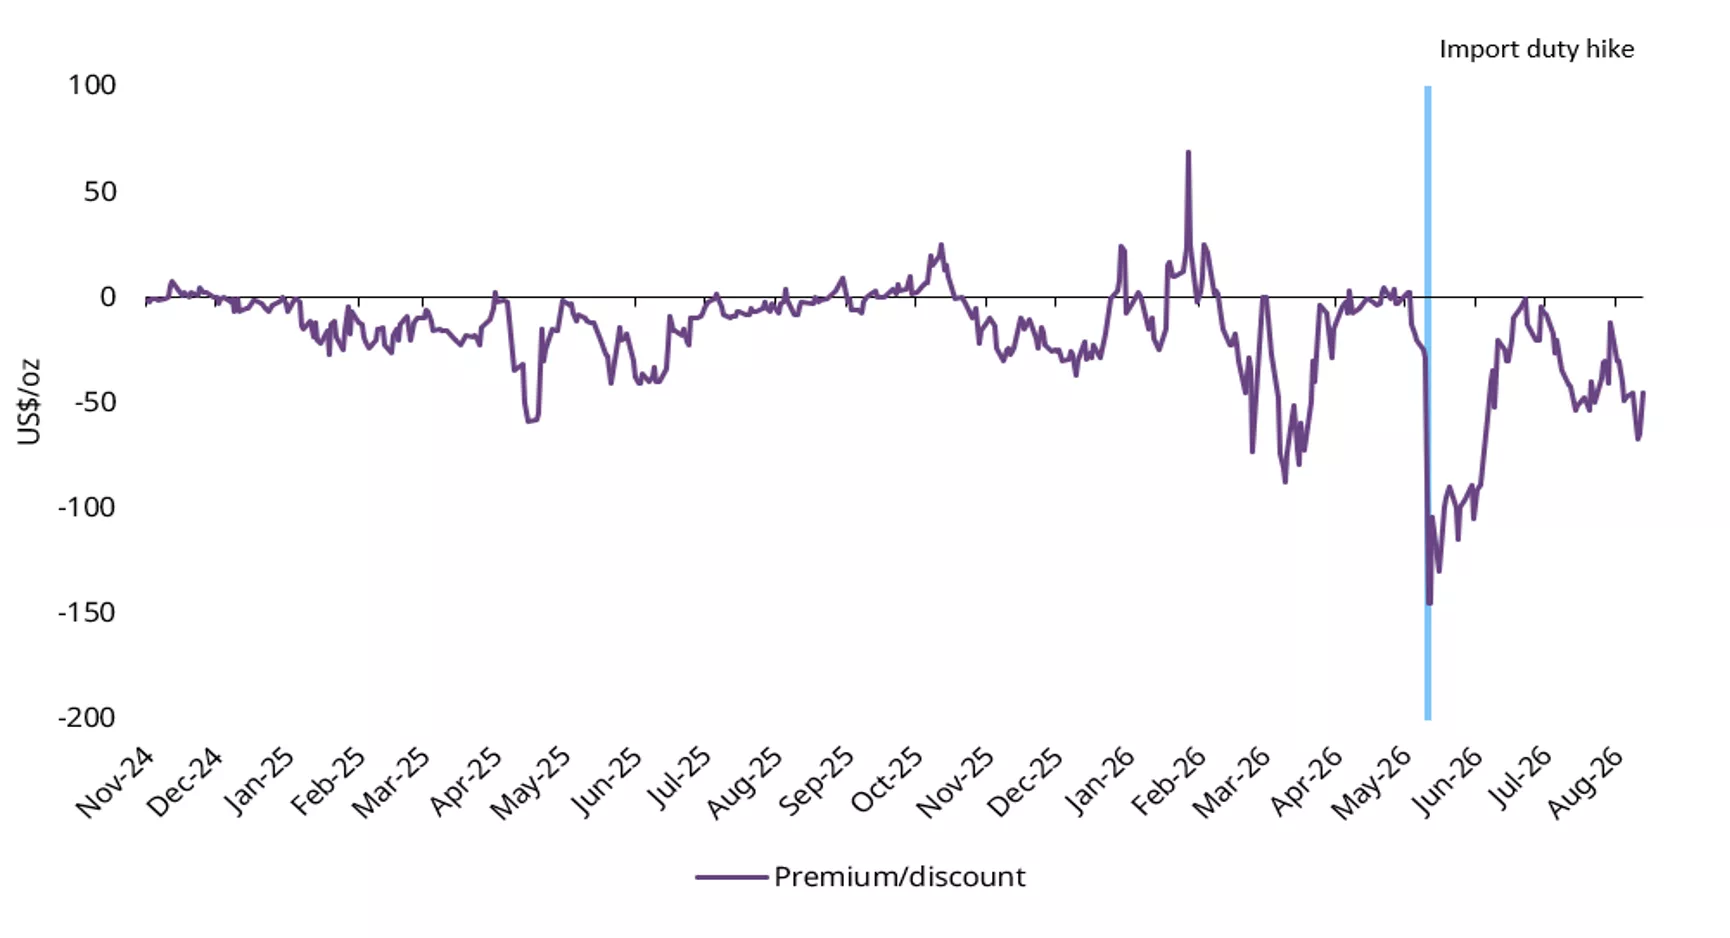
Domestic gold prices remain below import parity,3 indicating local supply availability. Market feedback suggests that the exchange of old gold for new jewellery has increased market supply and kept prices at a discount to the landed cost. While discounts narrowed meaningfully, from around US$100/oz in mid-May and early June, to about US$45/oz in mid-August, they remained above July’s average US$34/oz.
Chart 2: Improving market balance trims discounts
NCDEX gold premium/discount relative to the official domestic price*
*As of 14 August 2026.
Source: NCDEX, World Gold Council
Buyers return
Jewellery demand has reportedly strengthened, as consumers viewed recent price action as a buying opportunity. Industry feedback suggests that deferred purchases returned to the market, resulting in higher footfall and a recovery in demand beyond essential wedding-related purchases. Manufacturers have reportedly begun receiving higher order flows, and inventory replenishment by jewellers has picked up ahead of the festive season, suggesting growing confidence in seasonal demand. Old gold exchange remains elevated and continues to play an important role in facilitating purchases.
Physical investment demand, while moderating from earlier highs, remained supportive during the period of price correction. Lower prices continued to attract investors seeking strategic exposure to gold, while the recent rebound appears to have revived interest.
Continued inflows into gold ETFs
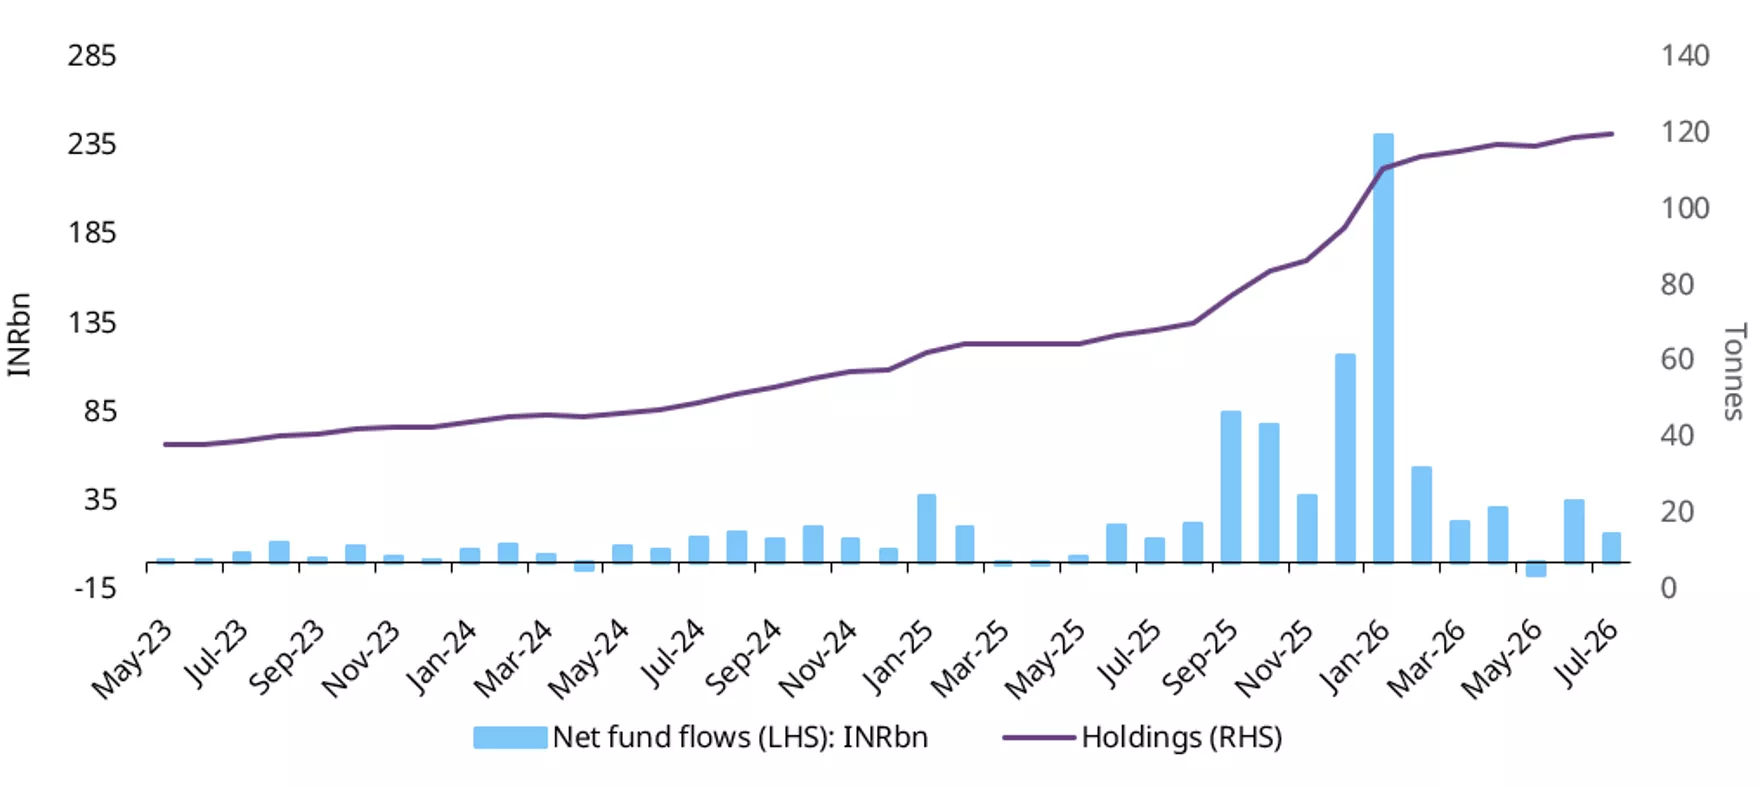
Indian gold ETFs continued to attract investor interest in July, albeit at a slower pace than in June. As per data from the Association of Mutual Funds of India (AMFI), net inflows totalled INR15.6bn (US$163mn) during the month, 55% lower m/m, while holdings increased by 1t to 120t, in line with our initial estimate. Total assets under management (AUM) rose 2% m/m to INR1,733bn(US$18.1bn). And positive flows are continuing; the first two weeks of August saw an estimated net inflow of INR11.79bn(US$124mn).
Investor participation also grew; a further 57k new folios (accounts) were added during July, taking the total number of accounts to 12.53mn.
Chart 3: Steady ETF demand
Gold ETF flows in INRbn, and total holdings in tonnes*
*As of end July 2026.
Source: AMFI, ICRA Analytics, CMIE, World Gold Council
Futures activity picks up
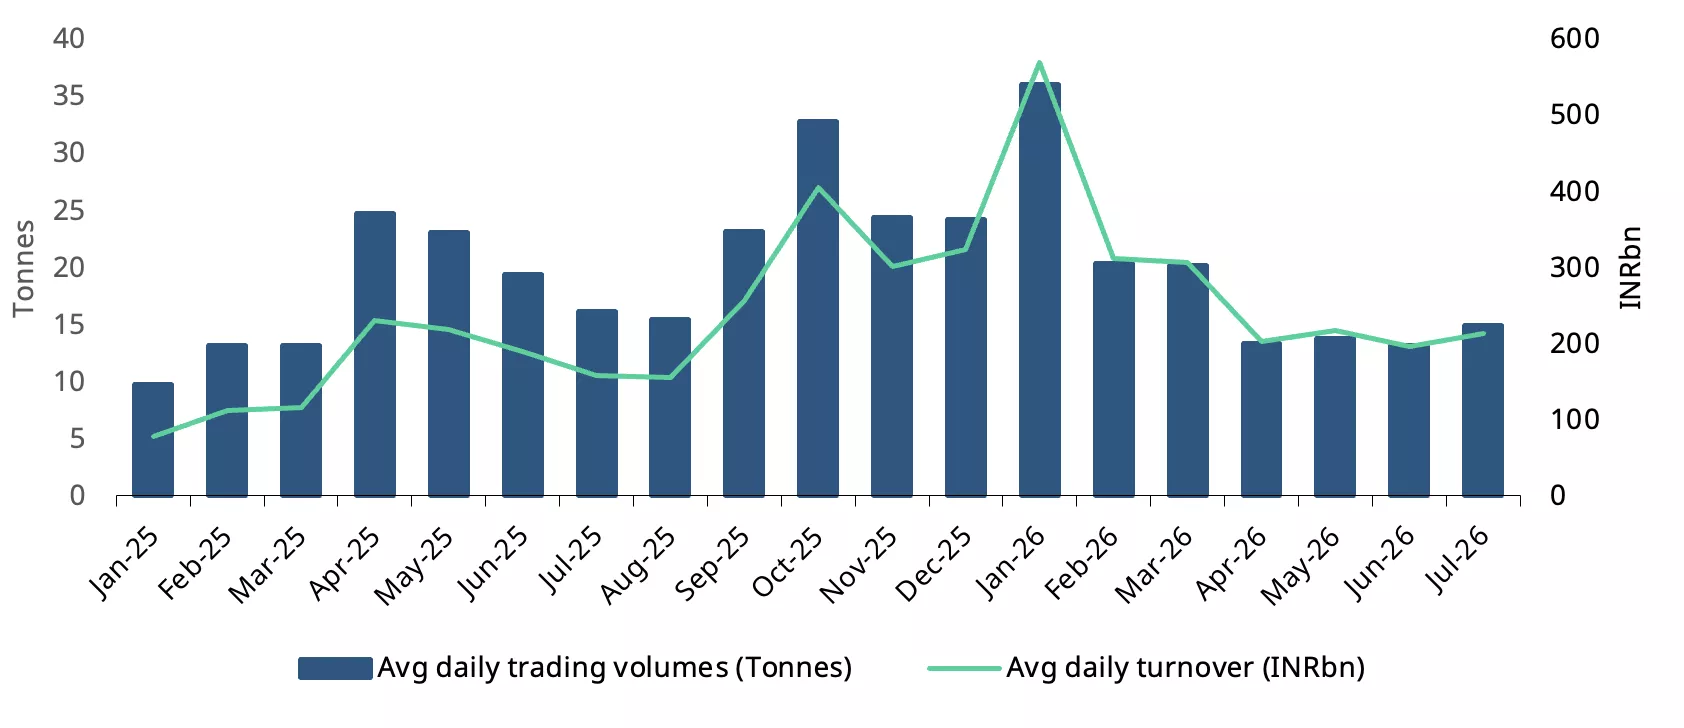
Following a softer April-June period, gold futures trading picked up in July, indicating greater trader participation and hedging activity as gold prices stabilised and began to recover. Average daily trading volumes on the Multi Commodity Exchange of India (MCX India) rose to 14.9t, up from an average 13.5t over the previous three months, while average daily turnover increased 9% m/m to INR214bn(US$2.2bn). Despite the improvement, activity remained below the earlier elevated levels: average daily trading volumes were 59% lower than January’s peak and 8% below July 2025 levels. Turnover, however, was 35% higher y/y, reflecting the impact of higher gold prices on traded value.
Chart 4: Futures trading edges higher
Gold futures trading on MCX; volume and turnover
Source: MCX India, World Gold Council
Imports rebound
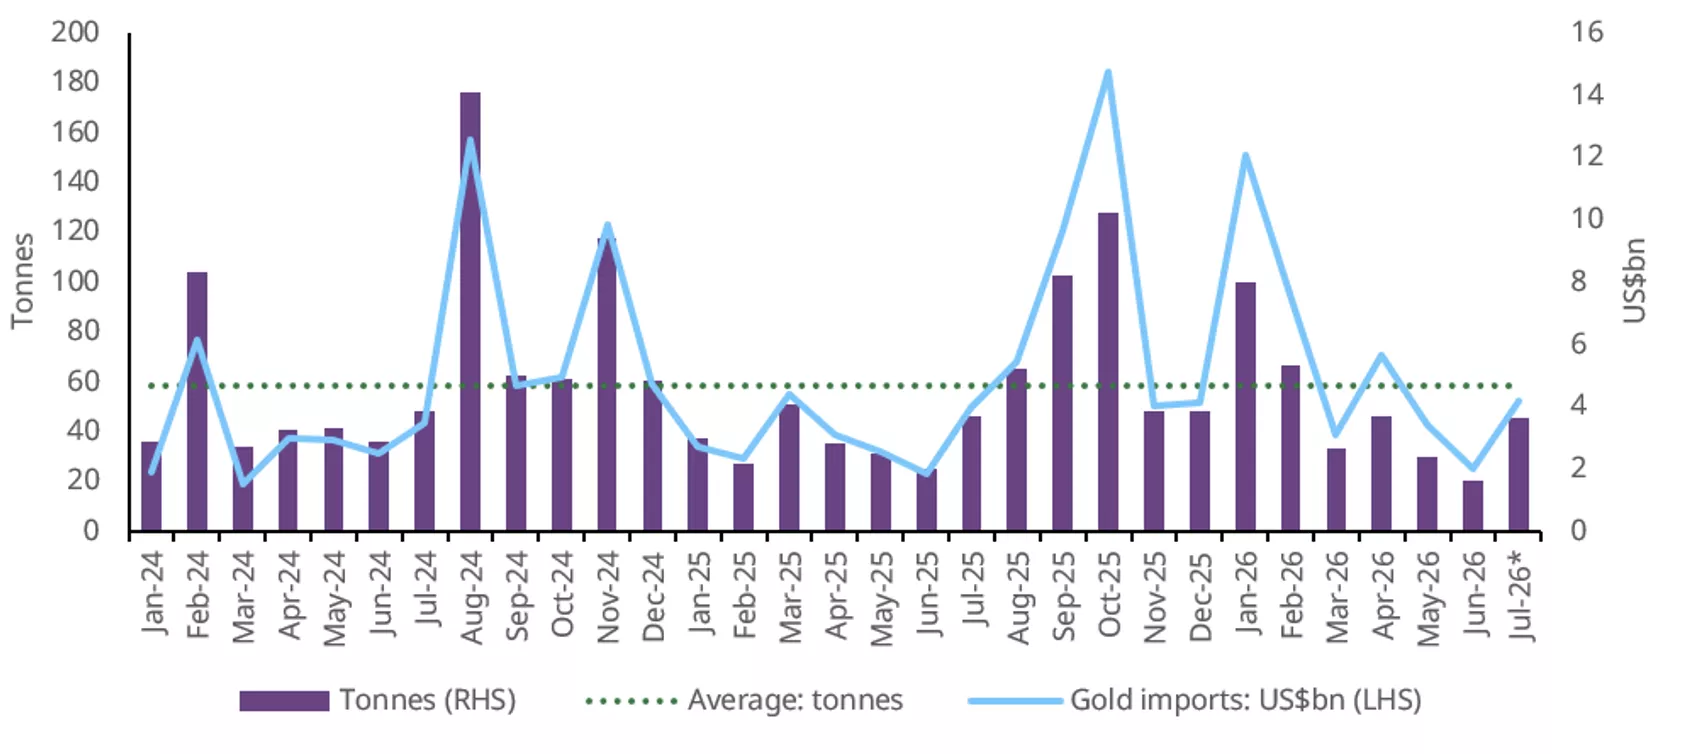
Gold imports rebounded in July after two consecutive months of weakness, suggesting an improvement in demand and inventory replenishment by manufacturers and retailers ahead of the festive season. Import value rose to US$4.16bn, more than double June’s US$1.97bn, while import volumes are estimated to have increased to 40-45t, up from 20t in June.
While recycled gold – primarily from the exchange of old gold jewellery for new – continues to supplement supply, the recovery in imports points to stronger physical demand compared with recent months. Despite the increase, gold's share of total merchandise imports remained relatively modest at 5%, compared with the average 11% during January-March.
Chart 5: Imports rise
Monthly gold imports in tonnes and US$bn*
*Includes World Gold Council estimates.
Source: Ministry of Commerce and Industry, CMIE, World Gold Council
Disclaimer
Important information and disclaimers
© 2026 World Gold Council. All rights reserved. World Gold Council and the Circle device are trademarks of the World Gold Council or its affiliates.
All references to LBMA Gold Price are used with the permission of ICE Benchmark Administration Limited and have been provided for informational purposes only. ICE Benchmark Administration Limited accepts no liability or responsibility for the accuracy of the prices or the underlying product to which the prices may be referenced. Other content is the intellectual property of the respective third party and all rights are reserved to them.
Reproduction or redistribution of any of this information is expressly prohibited without the prior written consent of World Gold Council or the appropriate copyright owners, except as specifically provided below. Information and statistics are copyright © and/or other intellectual property of the World Gold Council or its affiliates or third-party providers identified herein. All rights of the respective owners are reserved.
The use of the statistics in this information is permitted for the purposes of review and commentary (including media commentary) in line with fair industry practice, subject to the following two pre-conditions: (i) only limited extracts of data or analysis be used; and (ii) any and all use of these statistics is accompanied by a citation to World Gold Council and, where appropriate, to Metals Focus or other identified copyright owners as their source. World Gold Council is affiliated with Metals Focus.
The World Gold Council and its affiliates do not guarantee the accuracy or completeness of any information nor accept responsibility for any losses or damages arising directly or indirectly from the use of this information.
This information is for educational purposes only and by receiving this information, you agree with its intended purpose. Nothing contained herein is intended to constitute a recommendation, investment advice, or offer for the purchase or sale of gold, any gold-related products or services or any other products, services, securities or financial instruments (collectively, “Services”). This information does not take into account any investment objectives, financial situation or particular needs of any particular person.
Diversification does not guarantee any investment returns and does not eliminate the risk of loss. Past performance is not necessarily indicative of future results. The resulting performance of any investment outcomes that can be generated through allocation to gold are hypothetical in nature, may not reflect actual investment results and are not guarantees of future results. The World Gold Council and its affiliates do not guarantee or warranty any calculations and models used in any hypothetical portfolios or any outcomes resulting from any such use. Investors should discuss their individual circumstances with their appropriate investment professionals before making any decision regarding any Services or investments.
This information may contain forward-looking statements, such as statements which use the words “believes”, “expects”, “may”, or “suggests”, or similar terminology, which are based on current expectations and are subject to change. Forward-looking statements involve a number of risks and uncertainties. There can be no assurance that any forward-looking statements will be achieved. World Gold Council and its affiliates assume no responsibility for updating any forward-looking statements.
Information regarding the LBMA Gold Price
The LBMA Gold Price is used by the World Gold Council with permission under license by ICE Benchmark Administration Limited and is subject to the restrictions set forth here (www.gold.org/terms-and-conditions).
Information regarding QaurumSM and the Gold Valuation Framework
Note that the resulting performance of various investment outcomes that can be generated through use of Qaurum, the Gold Valuation Framework and other information are hypothetical in nature, may not reflect actual investment results and are not guarantees of future results. Neither World Gold Council (including its affiliates) nor Oxford Economics provides any warranty or guarantee regarding the functionality of the tool, including without limitation any projections, estimates or calculations.
Information from ICRA Analytics Limited
All information obtained from ICRA Analytics Limited contained in this document is subject to the disclaimer set forth here (www.icraanalytics.com/terms-of-use/disclaimer).
Footnotes
1LBMA Gold Price PM and MCX spot gold price as of 14 August 2026.
2LBMA Gold Price PM and MCX spot gold price as of 14 August 2026.
3Import parity or landed price is the international gold price (LBMA Gold Price AM) adjusted for import tax.
Record gold prices outpace rising mining costs in Q1’26
Oliver Blagden
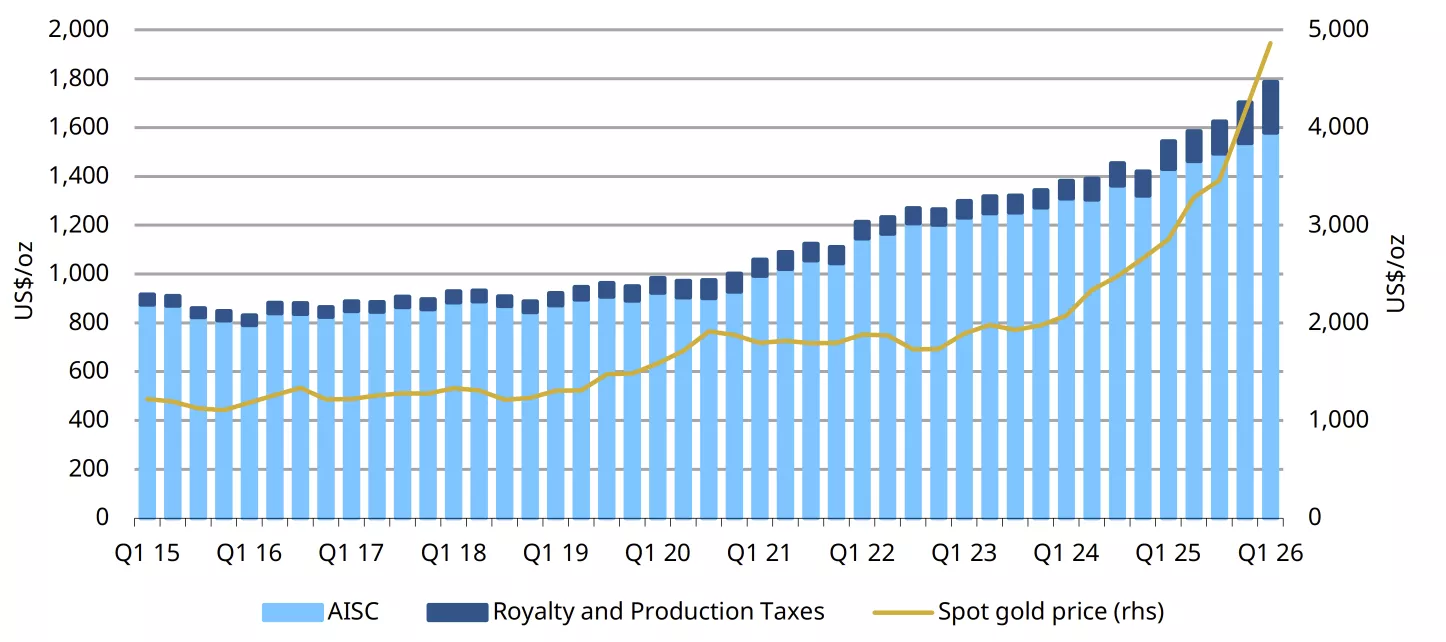
Mine Supply Analyst Metals Focus2026 started in dramatic fashion, as record gold prices and cash flows for miners were accompanied by the outbreak of war in Iran and the broader disruption across the Middle East. Against this backdrop, global average gold producer All-In Sustaining Costs (AISC) rose by 5% q/q and 16% y/y to US$1,785/oz in Q1’26. Rising costs have become a persistent feature of the industry, with the quarter marking the 28th consecutive year-on-year increase in AISC.
Numerous cost drivers contributed to the increase, but royalties were the most significant. Spot gold prices reached unprecedented new highs, momentarily hitting US$5,595/oz in January, while Q1’26 recorded by far the highest quarterly average nominal price on record. As revenues increased, royalty payments rose sharply, climbing by 24% q/q and 85% y/y. When compared with five years previous, the growing importance of royalties is clear. In Q1’21, royalties accounted for approximately 6% of AISC. By Q1’26, this share had doubled to 12% of the average operation’s cost base.
However, the effect was not uniform across the industry. Differences in fiscal regimes, combined with rising resource nationalism, accentuated the impact in some jurisdictions. Ghana introduced a new sliding scale royalty system in March, replacing the long-standing flat rate of 5%. The scale is linked to the gold price and can reach rates of 12% when prices exceed US$4,500/oz.1 In 2025, Burkina Faso introduced a new sliding royalty rate system, with rates of 10% for gold prices between US$4,000-4,500/oz. Mali implemented its new sliding scale in 2024, with higher royalty rates of 9.5% at a gold price of US$4,100/oz. 2 These higher royalty rates result in higher royalty costs for mines. For example, at IAMGOLD’s Essakane mine in Burkina Faso, royalty costs surged by 220% y/y, accounting for 35% of cash costs.3 Resolute Mining also identified higher royalties as a key factor pushing costs at Syama above guidance.4
Chart 1: AISC, of which royalty and production taxes, and quarterly average gold price US$/oz
Source: Bloomberg, Metals Focus Gold Mine Cost Service
The Cost of Conflict
While royalties were a major driver of higher AISC, attention has also been on the Iran conflict and the resulting disruption. The closure of the Strait of Hormuz and damage to resources and energy infrastructure in the region have disrupted global supply chains, contributing to higher fuel, power, freight, shipping, and consumable costs.
Fuel and power were among the largest concerns for gold miners as global energy prices spiked and diesel shortages became a risk in some jurisdictions. However, the scale of the impact varied considerably according to local supply chains. The average diesel price in the US ended the quarter 54% higher q/q, while wholesale diesel prices in Perth, Australia increased by 96% over the quarter.5 Western Australian miners came under particularly significant pressure, with some smaller operations reportedly suspending activity because of fuel constraints. The disruption also highlighted the differing levels of protection across the industry, as larger companies generally fared better than their junior counterparts.
Major and intermediate producers were mostly insulated from the March price volatility through fuel inventories, hedging, power purchase agreements and long-term procurement arrangements. For example, Evolution Mining noted in its Q1’26 release that its existing fuel contracts had prevented any disruption to operations.6 Newmont were also unaffected by fuel shortages, as they were able to leverage their scale and ensure that strong relations with suppliers mitigated exposure.7 OceanaGold, whose diesel costs make up around 6% of AISC, similarly reported that around 80% of annual consumption was hedged;8 and as a result, changes in oil prices had only a limited immediate effect on the company’s costs. Nevertheless, OceanaGold, Newmont and several other producers cautioned that a prolonged period of elevated fuel prices could have a greater impact in future quarters.9
Broader Supply-Chain Pressures
Higher fuel prices also had knock-on effects across global freight markets. Bunker fuel costs doubled in early March, while war risk insurance premiums increased.10 These costs were fed through to miners via the import of consumables, and spare parts. In their Q1’26 report, Gold Fields recorded a 40% rise in freight and consumables costs since the start of the Iran war.11
Disruption to natural gas and ammonia markets drove up prices for explosives and sodium cyanide and rising aluminium prices increased the cost of maintenance materials, fabricated components and replacement parts, adding to broader inflationary pressures across mining operations.
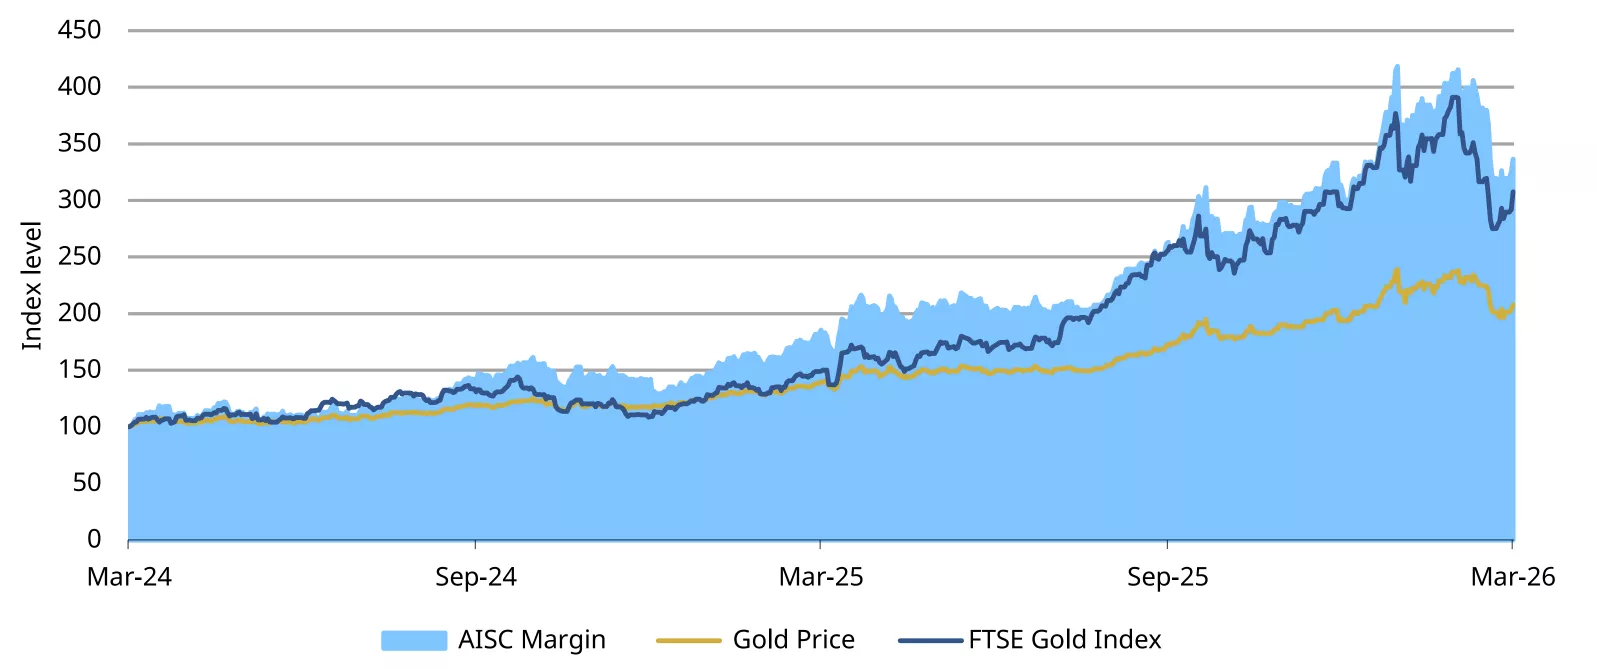
Chart 2: Gold miner margins surge ahead of the gold price
Note: Index: 31 March 2024 = 100.
Source: Bloomberg, Metals Focus
Record Margins and Cash Generation
Despite this cost inflation, the quarter remained exceptionally profitable for the gold mining industry. The surge in the average gold price far exceeded the increase in costs, with the yellow metal up by 17% q/q and 70% y/y. Consequently, average AISC margins rose by 25% q/q and 134% y/y to a record US$3,076/oz. Producers at the 90th percentile of the cost curve experienced particularly strong growth, with their AISC margins increasing by 32% q/q to US$2,363/oz.
In contrast to previous booms, gold miners have maintained relatively strict capital and cost discipline and so a host of producers now find themselves in net cash positions. A significant proportion of the cash generated is being returned to investors through dividends and share-buyback programmes. For example, Newmont returned US$2.7bn to shareholders after generating its highest ever quarterly free cash flow (FCF) of US$3.1bn and has approved an additional US$6.0bn share buyback programme.12 AngloGold Ashanti also generated record FCF of US$1.2bn and moved from a net debt position into net cash. The company raised its interim dividend to US$1.14/share, up from US$0.125/share in Q1’25.13
Outlook
Overall, Q1’26 was an exceptional quarter for gold miners. Record gold prices generated unprecedented margins and cash flows, despite the conflict in the Middle East contributing to mounting cost pressures. Looking ahead, the industry’s resilience may be tested following the pullback in gold prices from their January peak. In Q2’26, average prices were 7.2% lower q/q, but remained well supported above US$4,000/oz. At the same time, costs are expected to rise further, as the Iran conflict and associated supply chain disruptions persist. Given that much of the escalation occurred late in Q1’26, the full impact on fuel, freight and consumable costs is likely to become more apparent during Q2’26, placing additional pressure on margins.
Disclaimer
Important information and disclaimers
© 2026 World Gold Council. All rights reserved. World Gold Council and the Circle device are trademarks of the World Gold Council or its affiliates.
All references to LBMA Gold Price are used with the permission of ICE Benchmark Administration Limited and have been provided for informational purposes only. ICE Benchmark Administration Limited accepts no liability or responsibility for the accuracy of the prices or the underlying product to which the prices may be referenced. Other content is the intellectual property of the respective third party and all rights are reserved to them.
Reproduction or redistribution of any of this information is expressly prohibited without the prior written consent of World Gold Council or the appropriate copyright owners, except as specifically provided below. Information and statistics are copyright © and/or other intellectual property of the World Gold Council or its affiliates or third-party providers identified herein. All rights of the respective owners are reserved.
The use of the statistics in this information is permitted for the purposes of review and commentary (including media commentary) in line with fair industry practice, subject to the following two pre-conditions: (i) only limited extracts of data or analysis be used; and (ii) any and all use of these statistics is accompanied by a citation to World Gold Council and, where appropriate, to Metals Focus or other identified copyright owners as their source. World Gold Council is affiliated with Metals Focus.
The World Gold Council and its affiliates do not guarantee the accuracy or completeness of any information nor accept responsibility for any losses or damages arising directly or indirectly from the use of this information.
This information is for educational purposes only and by receiving this information, you agree with its intended purpose. Nothing contained herein is intended to constitute a recommendation, investment advice, or offer for the purchase or sale of gold, any gold-related products or services or any other products, services, securities or financial instruments (collectively, “Services”). This information does not take into account any investment objectives, financial situation or particular needs of any particular person.
Diversification does not guarantee any investment returns and does not eliminate the risk of loss. Past performance is not necessarily indicative of future results. The resulting performance of any investment outcomes that can be generated through allocation to gold are hypothetical in nature, may not reflect actual investment results and are not guarantees of future results. The World Gold Council and its affiliates do not guarantee or warranty any calculations and models used in any hypothetical portfolios or any outcomes resulting from any such use. Investors should discuss their individual circumstances with their appropriate investment professionals before making any decision regarding any Services or investments.
This information may contain forward-looking statements, such as statements which use the words “believes”, “expects”, “may”, or “suggests”, or similar terminology, which are based on current expectations and are subject to change. Forward-looking statements involve a number of risks and uncertainties. There can be no assurance that any forward-looking statements will be achieved. World Gold Council and its affiliates assume no responsibility for updating any forward-looking statements.
Information regarding the LBMA Gold Price
The LBMA Gold Price is used by the World Gold Council with permission under license by ICE Benchmark Administration Limited and is subject to the restrictions set forth here (www.gold.org/terms-and-conditions).
Information regarding QaurumSM and the Gold Valuation Framework
Note that the resulting performance of various investment outcomes that can be generated through use of Qaurum, the Gold Valuation Framework and other information are hypothetical in nature, may not reflect actual investment results and are not guarantees of future results. Neither World Gold Council (including its affiliates) nor Oxford Economics provides any warranty or guarantee regarding the functionality of the tool, including without limitation any projections, estimates or calculations.
Information from ICRA Analytics Limited
All information obtained from ICRA Analytics Limited contained in this document is subject to the disclaimer set forth here (www.icraanalytics.com/terms-of-use/disclaimer).
Footnotes
1Décret no2025-0331 /PRES/PM/MEMC/MEF portant fixation des taxes et redevance miniéres
2Décret no2024-0396/PT-RM du 09 juillet 2024
3IAMGOLD Q1 2026 Financial Report
4Resolute Mining Q1 2026 Activities Report
5Bloomberg.
6Evolution Mining Quarterly Report | March 2026
7NEM Q1 2026 Earnings Call Transcript, NEM Q1 2026 10-Q, NEM Q1 2026 Earnings Presentation
9OceanaGold MDA 2026 Q1, NEM Q1 2026 10-Q, Agnico Eagle Q1 2026 Results, GoldFields Operational Update Q1 2026
10Indonesian Institute for Foreign Affairs
11GoldFields Operational Update Q1 2026
Weekly Markets Monitor - Danger zone
Weekly Markets Monitor
Highlights
- Last week, markets were driven by geopolitical tensions and policy surprises. The expiry of the US-Iran ceasefire and threats of economic and military retaliation heightened geopolitical uncertainty, while the US Treasury's surprise announcement of bond buyback increases added to volatility. In economic updates, US services remained strong amid manufacturing and housing weakness; Europe's manufacturing recovery broadened, China showed broad-based weakness, prompting plans for fiscal stimulus; Japan saw slower GDP growth but strong exports and firmer inflation; and India's services sector regained momentum.
- Equities fell, bond yields rose, oil rallied, and the dollar weakened.
- While investors focus on the level of nominal bond yields, and they are high enough to warrant policy intervention as we saw last week, the change in real yields might matter more for equities. According to Dhaval Joshi of BCA Research, a rise in the 10-year real yield of around 75bps from a cyclical low preceded the equity market setbacks of 2018, 2022 and early 2025. We're near that threshold again (C.O.T.W.)
Chart of the week: Danger zone
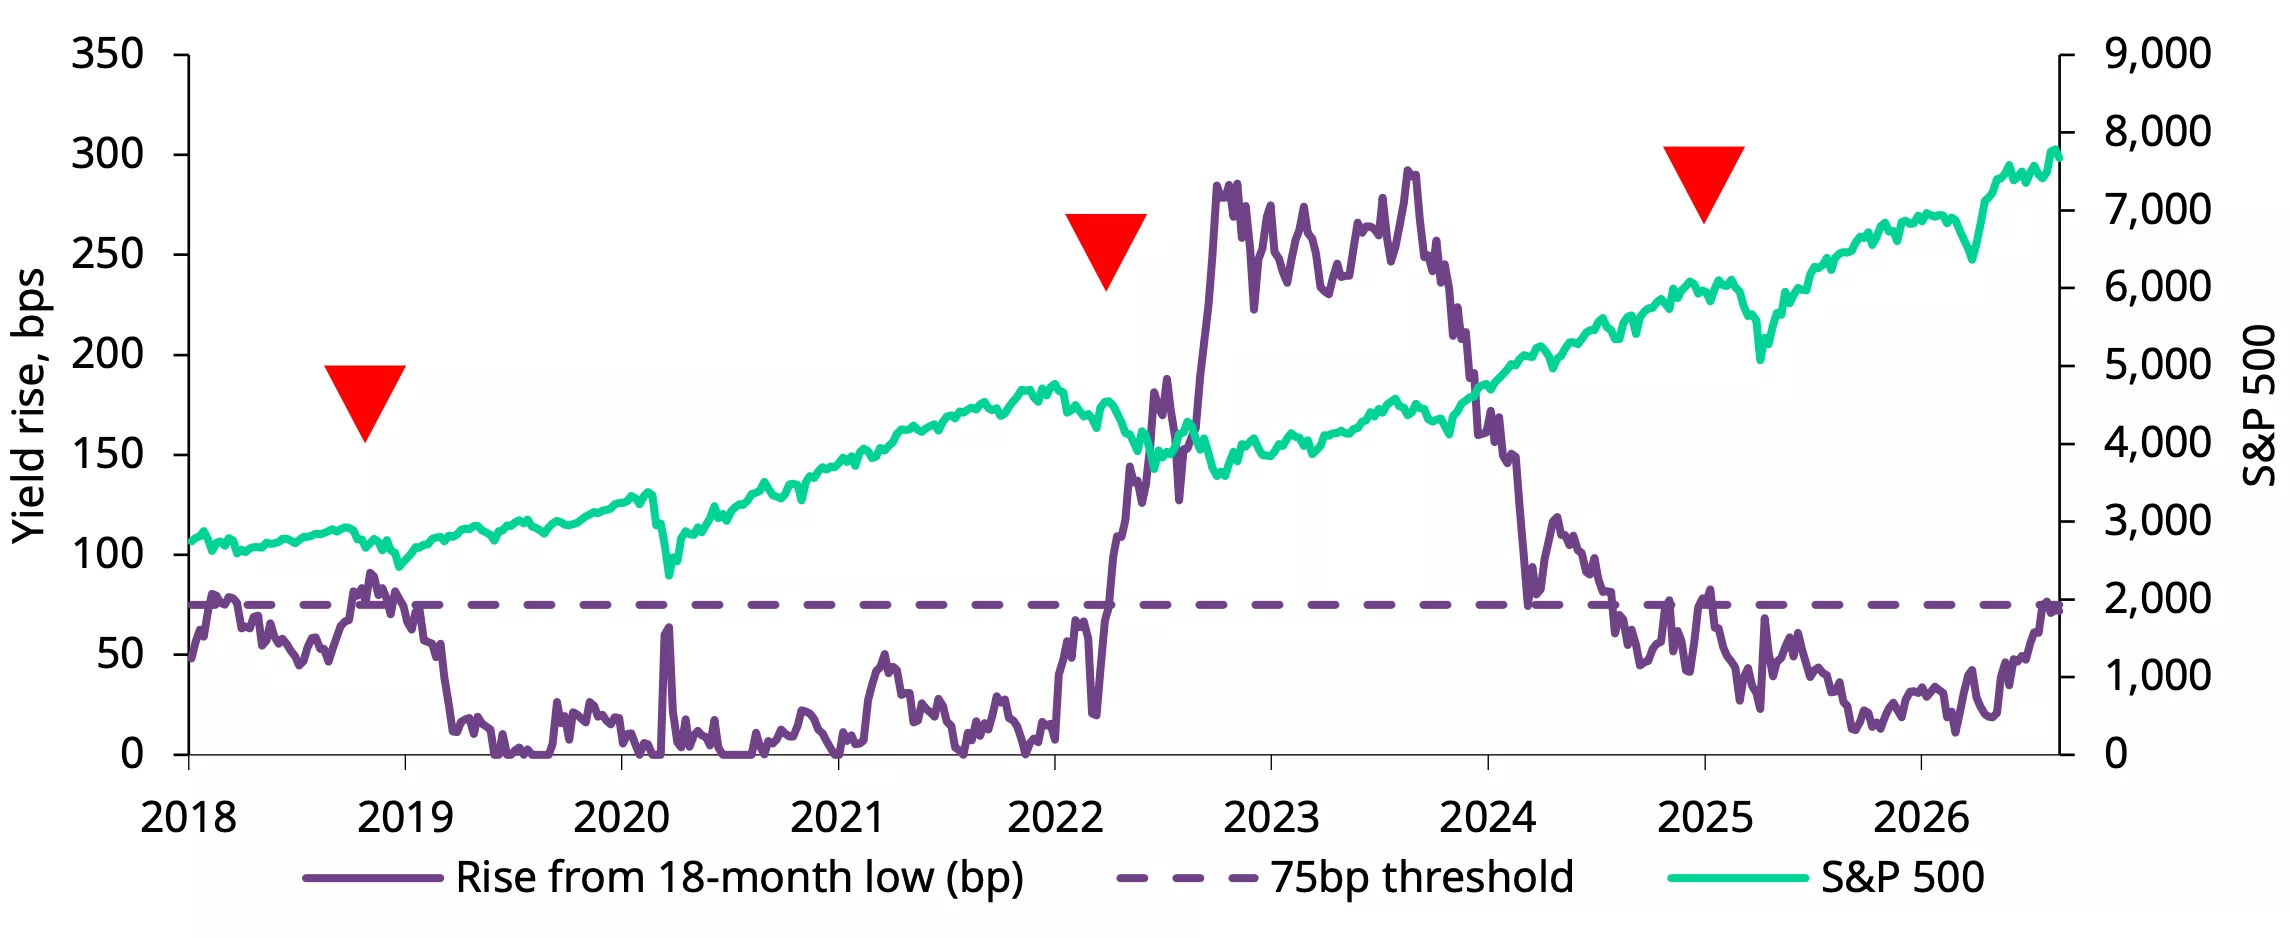
*Data as of 21 August 2026. Yield change in 10-year US TIPS (not 9y1y). Chart courtesy of Dhaval Joshi at BCA Research.
Sources: Bloomberg, World Gold Cou
Disclaimer
Important information and disclaimers
© 2026 World Gold Council. All rights reserved. World Gold Council and the Circle device are trademarks of the World Gold Council or its affiliates.
All references to LBMA Gold Price are used with the permission of ICE Benchmark Administration Limited and have been provided for informational purposes only. ICE Benchmark Administration Limited accepts no liability or responsibility for the accuracy of the prices or the underlying product to which the prices may be referenced. Other content is the intellectual property of the respective third party and all rights are reserved to them.
Reproduction or redistribution of any of this information is expressly prohibited without the prior written consent of World Gold Council or the appropriate copyright owners, except as specifically provided below. Information and statistics are copyright © and/or other intellectual property of the World Gold Council or its affiliates or third-party providers identified herein. All rights of the respective owners are reserved.
The use of the statistics in this information is permitted for the purposes of review and commentary (including media commentary) in line with fair industry practice, subject to the following two pre-conditions: (i) only limited extracts of data or analysis be used; and (ii) any and all use of these statistics is accompanied by a citation to World Gold Council and, where appropriate, to Metals Focus or other identified copyright owners as their source. World Gold Council is affiliated with Metals Focus.
The World Gold Council and its affiliates do not guarantee the accuracy or completeness of any information nor accept responsibility for any losses or damages arising directly or indirectly from the use of this information.
This information is for educational purposes only and by receiving this information, you agree with its intended purpose. Nothing contained herein is intended to constitute a recommendation, investment advice, or offer for the purchase or sale of gold, any gold-related products or services or any other products, services, securities or financial instruments (collectively, “Services”). This information does not take into account any investment objectives, financial situation or particular needs of any particular person.
Diversification does not guarantee any investment returns and does not eliminate the risk of loss. Past performance is not necessarily indicative of future results. The resulting performance of any investment outcomes that can be generated through allocation to gold are hypothetical in nature, may not reflect actual investment results and are not guarantees of future results. The World Gold Council and its affiliates do not guarantee or warranty any calculations and models used in any hypothetical portfolios or any outcomes resulting from any such use. Investors should discuss their individual circumstances with their appropriate investment professionals before making any decision regarding any Services or investments.
This information may contain forward-looking statements, such as statements which use the words “believes”, “expects”, “may”, or “suggests”, or similar terminology, which are based on current expectations and are subject to change. Forward-looking statements involve a number of risks and uncertainties. There can be no assurance that any forward-looking statements will be achieved. World Gold Council and its affiliates assume no responsibility for updating any forward-looking statements.
Information regarding the LBMA Gold Price
The LBMA Gold Price is used by the World Gold Council with permission under license by ICE Benchmark Administration Limited and is subject to the restrictions set forth here (www.gold.org/terms-and-conditions).
Information regarding QaurumSM and the Gold Valuation Framework
Note that the resulting performance of various investment outcomes that can be generated through use of Qaurum, the Gold Valuation Framework and other information are hypothetical in nature, may not reflect actual investment results and are not guarantees of future results. Neither World Gold Council (including its affiliates) nor Oxford Economics provides any warranty or guarantee regarding the functionality of the tool, including without limitation any projections, estimates or calculations.
Information from ICRA Analytics Limited
All information obtained from ICRA Analytics Limited contained in this document is subject to the disclaimer set forth here (www.icraanalytics.com/terms-of-use/disclaimer).
Get updates in your inbox
Get email updates
Unearthed: Inside the Refinery ft Dr Robin Kolvenbach, Argor-Heraeus
Unearthed Podcast
World Gold CouncilIn this episode of Unearthed, hosts John Reade and Joe Cavatoni are joined by Dr. Robin Kolvenbach, CEO of Argor-Heraeus a major precious metals refining company located in Mendrisio, Switzerland. Together they unpack the drivers behind the refining industry, often the least understood link in the gold value chain.
Episode one dives into the economics of the refining industry, why a rising gold price is a cost and a risk to refiners, and how metal lease rates shape the business. In the conversation they cover sourcing patterns reshaped by downstream demand for responsible supply, the scale and significance of bar and coin demand, physically segregated production lines and the tracing processes that allows a gold bar to be identified with a phone years after it leaves the refinery.
This episode was filmed on Wednesday 15th July and is part one of a two-part series with Argor-Heraeus.
Disclaimer
Important information and disclaimers
© 2026 World Gold Council. All rights reserved. World Gold Council and the Circle device are trademarks of the World Gold Council or its affiliates.
All references to LBMA Gold Price are used with the permission of ICE Benchmark Administration Limited and have been provided for informational purposes only. ICE Benchmark Administration Limited accepts no liability or responsibility for the accuracy of the prices or the underlying product to which the prices may be referenced. Other content is the intellectual property of the respective third party and all rights are reserved to them.
Reproduction or redistribution of any of this information is expressly prohibited without the prior written consent of World Gold Council or the appropriate copyright owners, except as specifically provided below. Information and statistics are copyright © and/or other intellectual property of the World Gold Council or its affiliates or third-party providers identified herein. All rights of the respective owners are reserved.
The use of the statistics in this information is permitted for the purposes of review and commentary (including media commentary) in line with fair industry practice, subject to the following two pre-conditions: (i) only limited extracts of data or analysis be used; and (ii) any and all use of these statistics is accompanied by a citation to World Gold Council and, where appropriate, to Metals Focus or other identified copyright owners as their source. World Gold Council is affiliated with Metals Focus.
The World Gold Council and its affiliates do not guarantee the accuracy or completeness of any information nor accept responsibility for any losses or damages arising directly or indirectly from the use of this information.
This information is for educational purposes only and by receiving this information, you agree with its intended purpose. Nothing contained herein is intended to constitute a recommendation, investment advice, or offer for the purchase or sale of gold, any gold-related products or services or any other products, services, securities or financial instruments (collectively, “Services”). This information does not take into account any investment objectives, financial situation or particular needs of any particular person.
Diversification does not guarantee any investment returns and does not eliminate the risk of loss. Past performance is not necessarily indicative of future results. The resulting performance of any investment outcomes that can be generated through allocation to gold are hypothetical in nature, may not reflect actual investment results and are not guarantees of future results. The World Gold Council and its affiliates do not guarantee or warranty any calculations and models used in any hypothetical portfolios or any outcomes resulting from any such use. Investors should discuss their individual circumstances with their appropriate investment professionals before making any decision regarding any Services or investments.
This information may contain forward-looking statements, such as statements which use the words “believes”, “expects”, “may”, or “suggests”, or similar terminology, which are based on current expectations and are subject to change. Forward-looking statements involve a number of risks and uncertainties. There can be no assurance that any forward-looking statements will be achieved. World Gold Council and its affiliates assume no responsibility for updating any forward-looking statements.
Information regarding the LBMA Gold Price
The LBMA Gold Price is used by the World Gold Council with permission under license by ICE Benchmark Administration Limited and is subject to the restrictions set forth here (www.gold.org/terms-and-conditions).
Information regarding QaurumSM and the Gold Valuation Framework
Note that the resulting performance of various investment outcomes that can be generated through use of Qaurum, the Gold Valuation Framework and other information are hypothetical in nature, may not reflect actual investment results and are not guarantees of future results. Neither World Gold Council (including its affiliates) nor Oxford Economics provides any warranty or guarantee regarding the functionality of the tool, including without limitation any projections, estimates or calculations.
Information from ICRA Analytics Limited
All information obtained from ICRA Analytics Limited contained in this document is subject to the disclaimer set forth here (www.icraanalytics.com/terms-of-use/disclaimer).
Weekly Markets Monitor - Treasury tribalism
Weekly Markets Monitor
Highlights
- Stronger-than-expected US economic data dominated the week, reviving rate-hike expectations, while escalating US-Iran tensions and fresh sanctions added to geopolitical risks. US labour market and business activity data remained robust, Europe saw a rise in inflation and weaker retail sales, China's manufacturing sector remained under pressure, Japan's services sector stayed resilient despite weak consumption, and India's Q2 GDP growth of 7.8% y/y exceeded expectations.
- Global equities closed mixed as bond yields rose sharply, the US dollar weakened, and oil prices gained.
- Despite strong US data, the dollar's correlation with 30-year Treasury yields has weakened sharply while its relationship with the 2-year remains intact. Markets probably interpret higher short-term rates as a sign of monetary credibility and required tightening, but higher long-term rates as compensation for fiscal and inflation risks. This distinction likely explains why the dollar looks technically precarious, despite elevated Treasury yields (C.O.T.W)
Chart of the week: Treasury tribalism
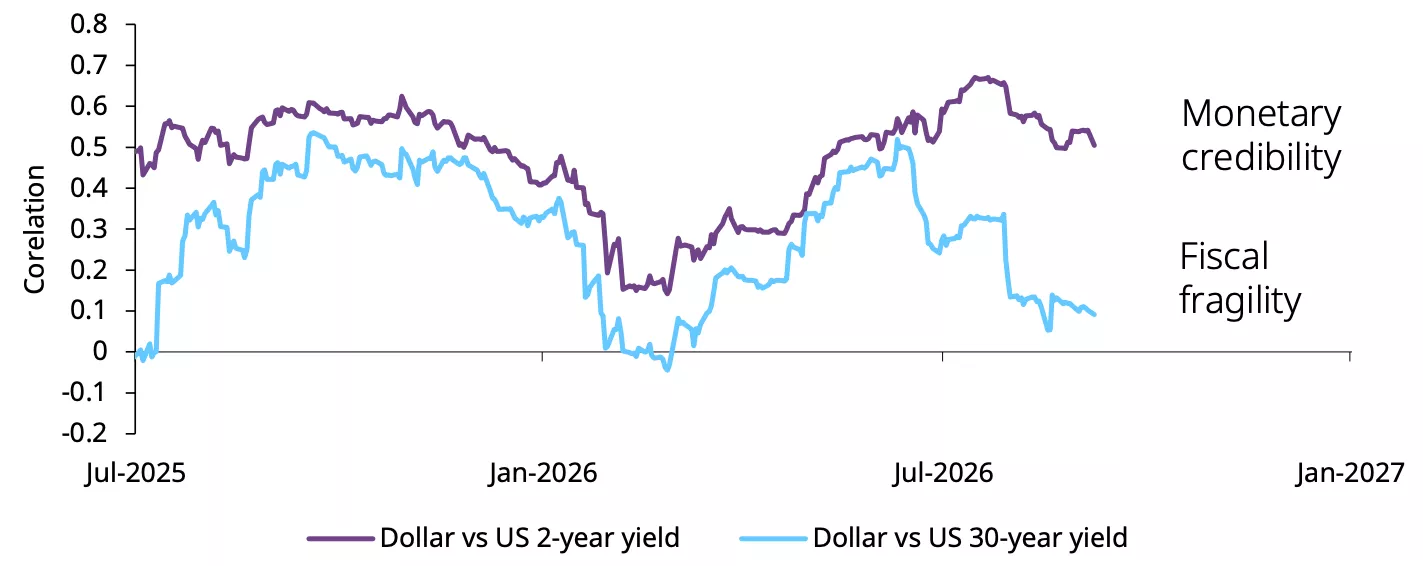
*Data as of 4 September 2026. Rolling 66-day correlation between log changes in US dollar index (DXY) and yields.
Sources: Bloomberg, World Gold Council
Disclaimer
Important information and disclaimers
© 2026 World Gold Council. All rights reserved. World Gold Council and the Circle device are trademarks of the World Gold Council or its affiliates.
All references to LBMA Gold Price are used with the permission of ICE Benchmark Administration Limited and have been provided for informational purposes only. ICE Benchmark Administration Limited accepts no liability or responsibility for the accuracy of the prices or the underlying product to which the prices may be referenced. Other content is the intellectual property of the respective third party and all rights are reserved to them.
Reproduction or redistribution of any of this information is expressly prohibited without the prior written consent of World Gold Council or the appropriate copyright owners, except as specifically provided below. Information and statistics are copyright © and/or other intellectual property of the World Gold Council or its affiliates or third-party providers identified herein. All rights of the respective owners are reserved.
The use of the statistics in this information is permitted for the purposes of review and commentary (including media commentary) in line with fair industry practice, subject to the following two pre-conditions: (i) only limited extracts of data or analysis be used; and (ii) any and all use of these statistics is accompanied by a citation to World Gold Council and, where appropriate, to Metals Focus or other identified copyright owners as their source. World Gold Council is affiliated with Metals Focus.
The World Gold Council and its affiliates do not guarantee the accuracy or completeness of any information nor accept responsibility for any losses or damages arising directly or indirectly from the use of this information.
This information is for educational purposes only and by receiving this information, you agree with its intended purpose. Nothing contained herein is intended to constitute a recommendation, investment advice, or offer for the purchase or sale of gold, any gold-related products or services or any other products, services, securities or financial instruments (collectively, “Services”). This information does not take into account any investment objectives, financial situation or particular needs of any particular person.
Diversification does not guarantee any investment returns and does not eliminate the risk of loss. Past performance is not necessarily indicative of future results. The resulting performance of any investment outcomes that can be generated through allocation to gold are hypothetical in nature, may not reflect actual investment results and are not guarantees of future results. The World Gold Council and its affiliates do not guarantee or warranty any calculations and models used in any hypothetical portfolios or any outcomes resulting from any such use. Investors should discuss their individual circumstances with their appropriate investment professionals before making any decision regarding any Services or investments.
This information may contain forward-looking statements, such as statements which use the words “believes”, “expects”, “may”, or “suggests”, or similar terminology, which are based on current expectations and are subject to change. Forward-looking statements involve a number of risks and uncertainties. There can be no assurance that any forward-looking statements will be achieved. World Gold Council and its affiliates assume no responsibility for updating any forward-looking statements.
Information regarding the LBMA Gold Price
The LBMA Gold Price is used by the World Gold Council with permission under license by ICE Benchmark Administration Limited and is subject to the restrictions set forth here (www.gold.org/terms-and-conditions).
Information regarding QaurumSM and the Gold Valuation Framework
Note that the resulting performance of various investment outcomes that can be generated through use of Qaurum, the Gold Valuation Framework and other information are hypothetical in nature, may not reflect actual investment results and are not guarantees of future results. Neither World Gold Council (including its affiliates) nor Oxford Economics provides any warranty or guarantee regarding the functionality of the tool, including without limitation any projections, estimates or calculations.
Information from ICRA Analytics Limited
All information obtained from ICRA Analytics Limited contained in this document is subject to the disclaimer set forth here (www.icraanalytics.com/terms-of-use/disclaimer).
Get updates in your inbox
Get email updates
China gold market update: Official buying accelerated in August
Ray Jia
Head of Research (Asia Pacific, ex-India) and Deputy Head of Trade Engagement (China) World Gold CouncilHighlights
- Gold prices surged in August, with both the LBMA Gold Price PM and Shanghai benchmark Gold Price PM (SHAUPM) capping notable gains; yet momentum eased in early September
- Chinese gold ETFs’ total asset under management (AUM) and collective holdings both rose further; in early September, inflows persisted1
- The rallying gold price and improved market sentiment led to stronger activity in gold futures
- Gold withdrawals from the Shanghai Gold Exchange (SGE) fell unseasonally last month, reflecting cooling bullion demand and ongoing weakness in the jewellery sector
- The People’s Bank of China (PBoC) reported a 20t gold purchase in August, the highest since October 2023.
Looking ahead
- The gold price trend should remain key to bullion investment but falling yields and equity market uncertainties may provide support. Meanwhile, gold jewellery demand is likely to receive a seasonal boost as, historically, retailers ramp up their restocking ahead of the peak season in Q4.
Gold bounced in August
Gold experienced its strongest month since January (Chart 1). The LBMA Gold Price PM in USD and SHAUPM in RMB rose 13% and 8.4% respectively. Our gold return attribution model identifies momentum as the primary driver of gold's rebound, underpinned largely by a marked improvement in ETF and futures positioning. Investors ramped up gold buying amid shifting Fed rate expectations and mounting US debt concerns. However, the softer performance of RMB-denominated gold largely reflects an appreciating yuan and weaker domestic investment momentum.
Gold’s momentum weakened in early September as US Fed Chair’s hawkish remarks and strong US labour market data revived investor bets of a Fed rate hike later in the month – though a weaker dollar provided some support.2
Chart 1: Gold’s comeback in August
Monthly returns of gold prices in USD and RMB*
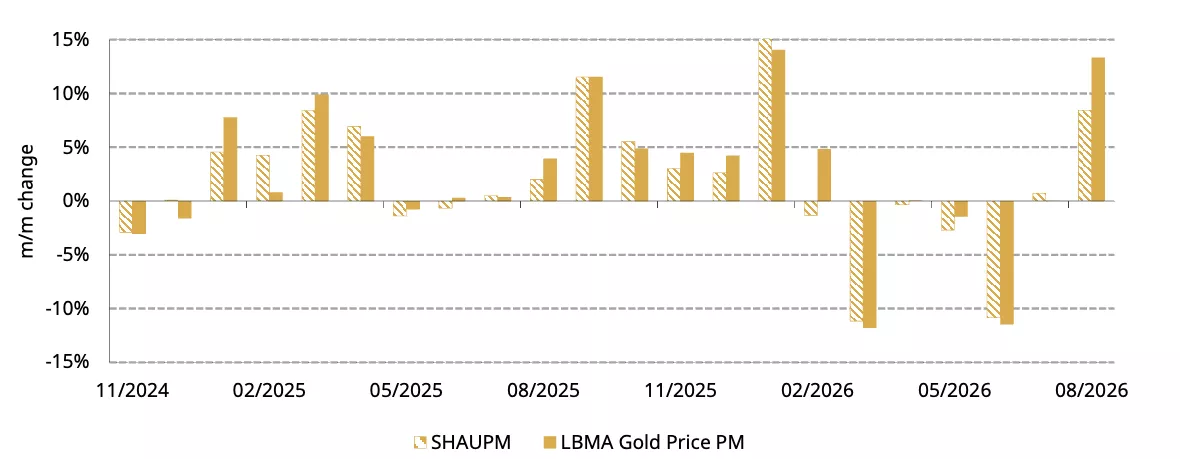
*Data to 31 August 2026. Based on the LBMA Gold Price PM in USD and the Shanghai Benchmark Gold Price PM in RMB.
Source: Shanghai Gold Exchange, ICE Benchmark Administration, World Gold Council
Chinese gold ETFs saw continued inflows
Chinese gold ETFs added 11t in August, pushing their collective holdings to 293t (Chart 2). Meanwhile, total AUM climbed RMB10bn (US$1.5bn) to RMB282bn (US$42bn), driven by both the higher gold price and the month's inflows. A stabilising and rebounding local gold price, alongside further declines in government bond yields, sustained investor interest – as did the PBoC's continued gold purchase announcements.
Chinese investors continued to buy gold ETFs in early September as local yields kept declining and equities remained sluggish.
Chart 2: Chinese investors continued to add gold ETFs to their portfolios
Chinese gold ETF demand and holdings in tonnes*
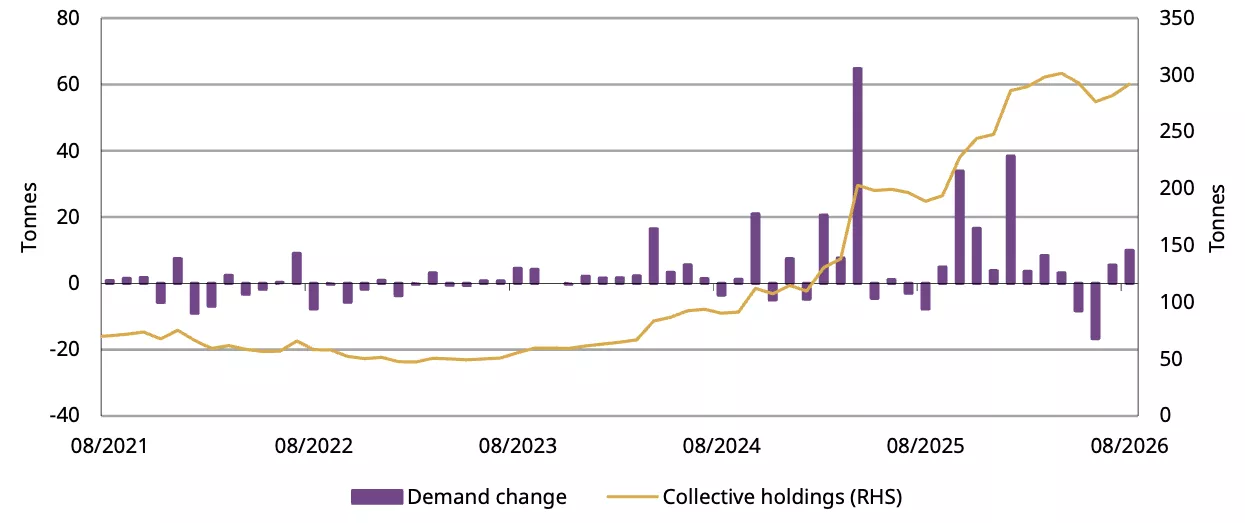
*Data to 31 August 2026.
Source: Company filings, World Gold Council
Gold futures volumes and net longs rose in tandem
Gold futures market activity improved in August (Chart 3). The average daily trading volume of gold futures on the SHFE surged 36% m/m to 396t/day. Net longs held by the top 20 market participants – due to data limitation – increased to 154t, up 37t from July. Both reflected improved market sentiment as the gold price rebounded during the month.
Chart 3: SHFE gold futures net longs and volumes both picked up in August
Top 20 net longs of SHFE’s gold futures and average daily trading volumes*
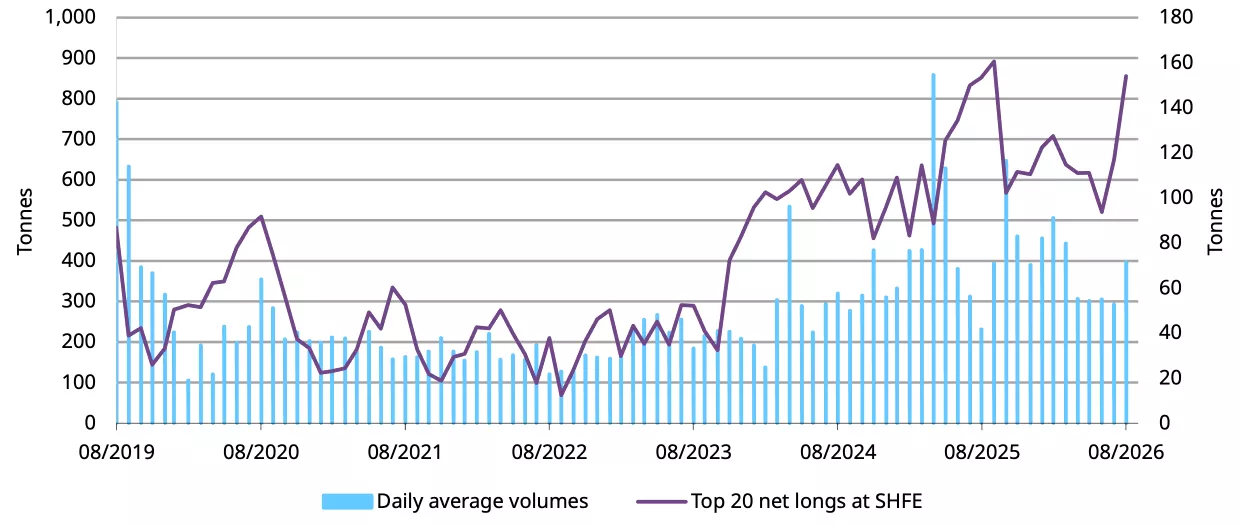
*Data to 31 August 2026.
Source: Shanghai Futures Exchange, World Gold Council
August gold withdrawals from the SGE slid further
Gold withdrawals from the SGE contracted 22% m/m and 27% y/y to 62t in August (Chart 4). This unseasonal wholesale demand fall is mainly a result of cooling momentum in bullion investment and still tepid gold jewellery demand overall. Although gold ended August higher, some longer-term physical gold investors chose to wait on the sidelines for a clearer price uptrend while some continued to look for a better entry point.
Jewellery wholesale demand stayed tepid y/y as a notably higher price and the additional VAT burden compared to last year kept weighing on consumption. Nonetheless, there was a slight upturn in restocking by jewellery manufacturers as they prepared for new product launch events, which usually occur in September. Anecdotal evidence suggests that manufacturers increased replenishment earlier in August when the gold price started to rally. But as gold’s volatility rose later in the month, they stayed cautious. Meanwhile, the lightweight product trend continued to contribute to a reduction in the jewellery sector’s tonnage wholesale demand.
Chart 4: Wholesale demand softened unseasonally in August
Gold withdrawals from the SGE by month and the ten-year monthly average*
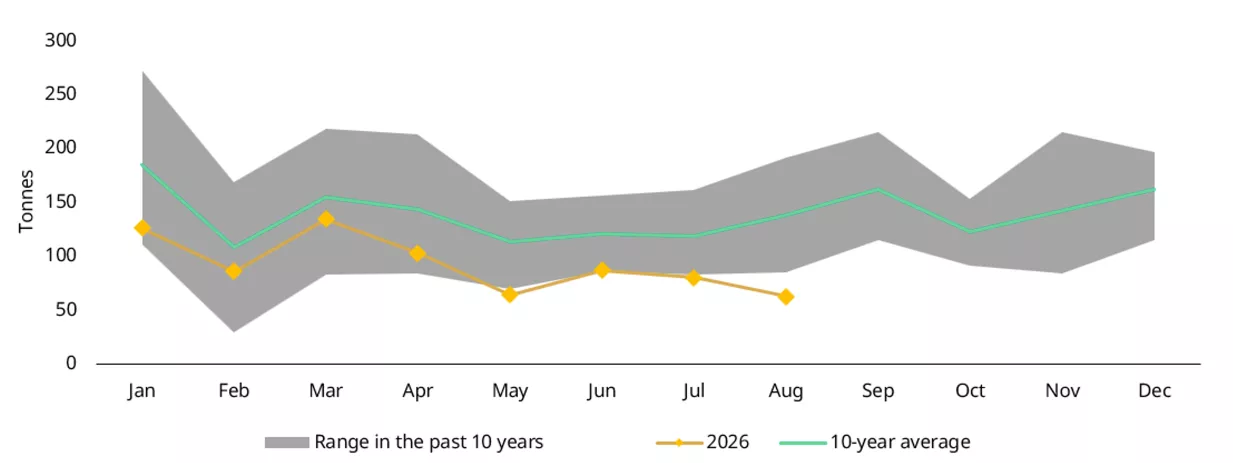
*As of 31 August 2026. Ten-year average based on data between 2016 and 2025.
Source: Shanghai Gold Exchange, World Gold Council
The PBoC accelerated gold accumulation
The PBoC reported a 20.2t gold reserve addition in August, the largest monthly increase since October 2023 (Chart 5). Official gold holdings have now risen for 22 consecutive months, reaching 2,387t by the end of August and accounting for 9% of total foreign exchange reserves, up from 8% in July. This underscores the central bank’s commitment to strengthening reserve diversification and resilience in an increasingly uncertain geopolitical environment.
Chart 5: The PBoC extended its gold purchasing streak to 22 months
The PBoC’s reported gold purchases and the gold price*
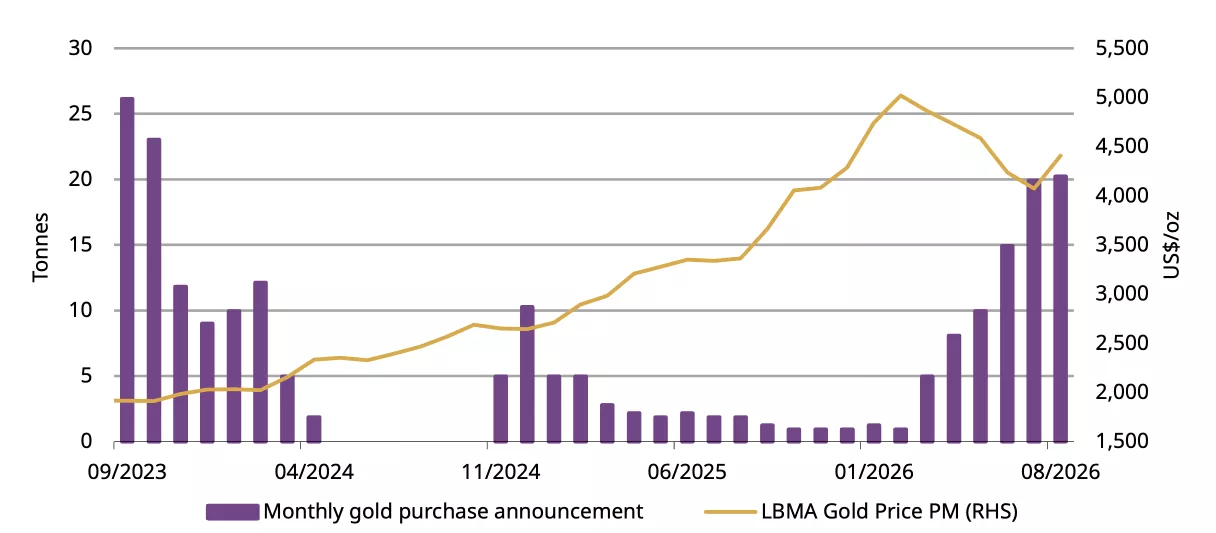
*Data to 31 August 2026.
Source: State Administration of Foreign Exchanges, World Gold Council
Imports moderated in July
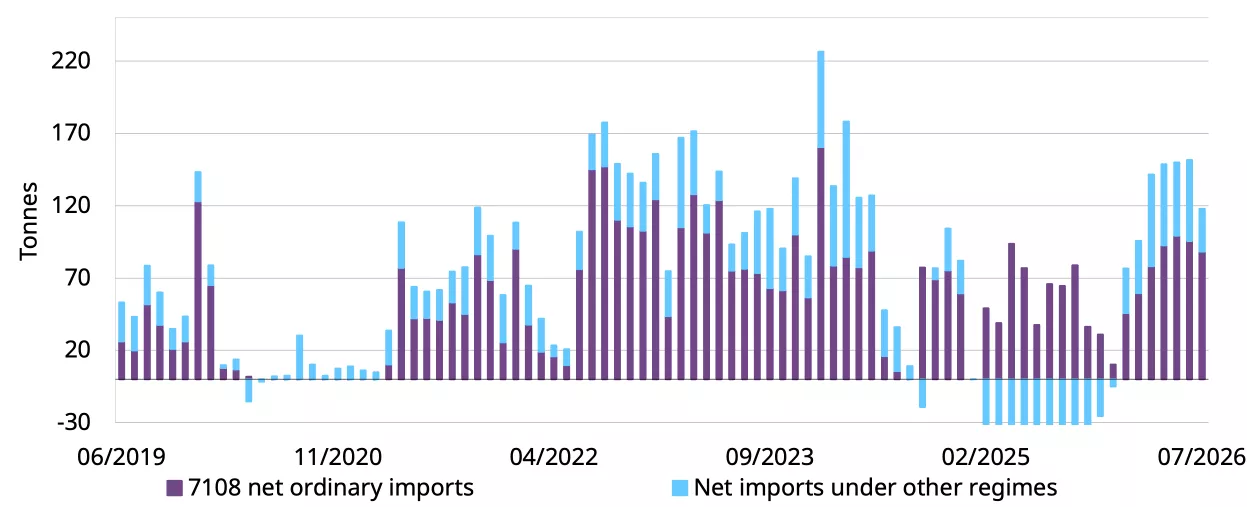
China’s 118t net gold imports in July represent a 34t contraction from June (Chart 6). The m/m decline was largely due to softer wholesale demand in the month. And on a y/y basis, there was a 34% rise – we believe a higher local gold price premium in July compared to last year and strong gold bullion demand momentum, despite jewellery weakness, contributed to the y/y improvement in imports.
Chart 6: Gold imports moderated in July
Net gold imports under HS7108*
*Data to July 2026.
Source: China Customs, World Gold Council
Footnotes
1Based on daily flows data as of 10 September; Chinese gold ETFs recorded non-stop inflows every trading day during this period.
2For more, see: Fed Chairman Warsh warns on inflation at Jackson Hole, 28 August 2026.
Disclaimer
Important information and disclaimers
© 2026 World Gold Council. All rights reserved. World Gold Council and the Circle device are trademarks of the World Gold Council or its affiliates.
All references to LBMA Gold Price are used with the permission of ICE Benchmark Administration Limited and have been provided for informational purposes only. ICE Benchmark Administration Limited accepts no liability or responsibility for the accuracy of the prices or the underlying product to which the prices may be referenced. Other content is the intellectual property of the respective third party and all rights are reserved to them.
Reproduction or redistribution of any of this information is expressly prohibited without the prior written consent of World Gold Council or the appropriate copyright owners, except as specifically provided below. Information and statistics are copyright © and/or other intellectual property of the World Gold Council or its affiliates or third-party providers identified herein. All rights of the respective owners are reserved.
The use of the statistics in this information is permitted for the purposes of review and commentary (including media commentary) in line with fair industry practice, subject to the following two pre-conditions: (i) only limited extracts of data or analysis be used; and (ii) any and all use of these statistics is accompanied by a citation to World Gold Council and, where appropriate, to Metals Focus or other identified copyright owners as their source. World Gold Council is affiliated with Metals Focus.
The World Gold Council and its affiliates do not guarantee the accuracy or completeness of any information nor accept responsibility for any losses or damages arising directly or indirectly from the use of this information.
This information is for educational purposes only and by receiving this information, you agree with its intended purpose. Nothing contained herein is intended to constitute a recommendation, investment advice, or offer for the purchase or sale of gold, any gold-related products or services or any other products, services, securities or financial instruments (collectively, “Services”). This information does not take into account any investment objectives, financial situation or particular needs of any particular person.
Diversification does not guarantee any investment returns and does not eliminate the risk of loss. Past performance is not necessarily indicative of future results. The resulting performance of any investment outcomes that can be generated through allocation to gold are hypothetical in nature, may not reflect actual investment results and are not guarantees of future results. The World Gold Council and its affiliates do not guarantee or warranty any calculations and models used in any hypothetical portfolios or any outcomes resulting from any such use. Investors should discuss their individual circumstances with their appropriate investment professionals before making any decision regarding any Services or investments.
This information may contain forward-looking statements, such as statements which use the words “believes”, “expects”, “may”, or “suggests”, or similar terminology, which are based on current expectations and are subject to change. Forward-looking statements involve a number of risks and uncertainties. There can be no assurance that any forward-looking statements will be achieved. World Gold Council and its affiliates assume no responsibility for updating any forward-looking statements.
Information regarding the LBMA Gold Price
The LBMA Gold Price is used by the World Gold Council with permission under license by ICE Benchmark Administration Limited and is subject to the restrictions set forth here (www.gold.org/terms-and-conditions).
Information regarding QaurumSM and the Gold Valuation Framework
Note that the resulting performance of various investment outcomes that can be generated through use of Qaurum, the Gold Valuation Framework and other information are hypothetical in nature, may not reflect actual investment results and are not guarantees of future results. Neither World Gold Council (including its affiliates) nor Oxford Economics provides any warranty or guarantee regarding the functionality of the tool, including without limitation any projections, estimates or calculations.
Information from ICRA Analytics Limited
All information obtained from ICRA Analytics Limited contained in this document is subject to the disclaimer set forth here (www.icraanalytics.com/terms-of-use/disclaimer).
Weekly Markets Monitor - No release
Weekly Markets Monitor
Highlights
- Last week, US-Iran tensions intensified and broadened, pushing oil prices and inflation fears higher. In the US, stronger-than-expected August inflation raised investor expectations of a Fed rate hike. Meanwhile, the ECB raised rates, Eurozone growth was revised higher, and UK economic activity exceeded expectations. In China, exports strengthened and inflation firmed, while the government announced a major recapitalization of eight banks and insurers. In Japan, wage growth accelerated.
- Global equities ended the week lower, while bond yields moved higher, oil prices edged up and the US dollar remained broadly steady.
- Rising crack spreads (diesel, fuel oil) and renewed Chinese imports suggest the oil market is tightening amid dwindling global inventories. The demand slowdown that helped briefly balance the market in Q2 has faded. With China back in the market, there is likely no release, leaving higher prices to do the rebalancing work (C.O.T.W). This adds upside pressure to inflation which already printed sticky last week, and the Fed faces a tough decision at this week’s FOMC meeting. Gold will likely be pinched between near-term policy tightening and medium-term risks to equity markets and the economy.
Chart of the week: No release
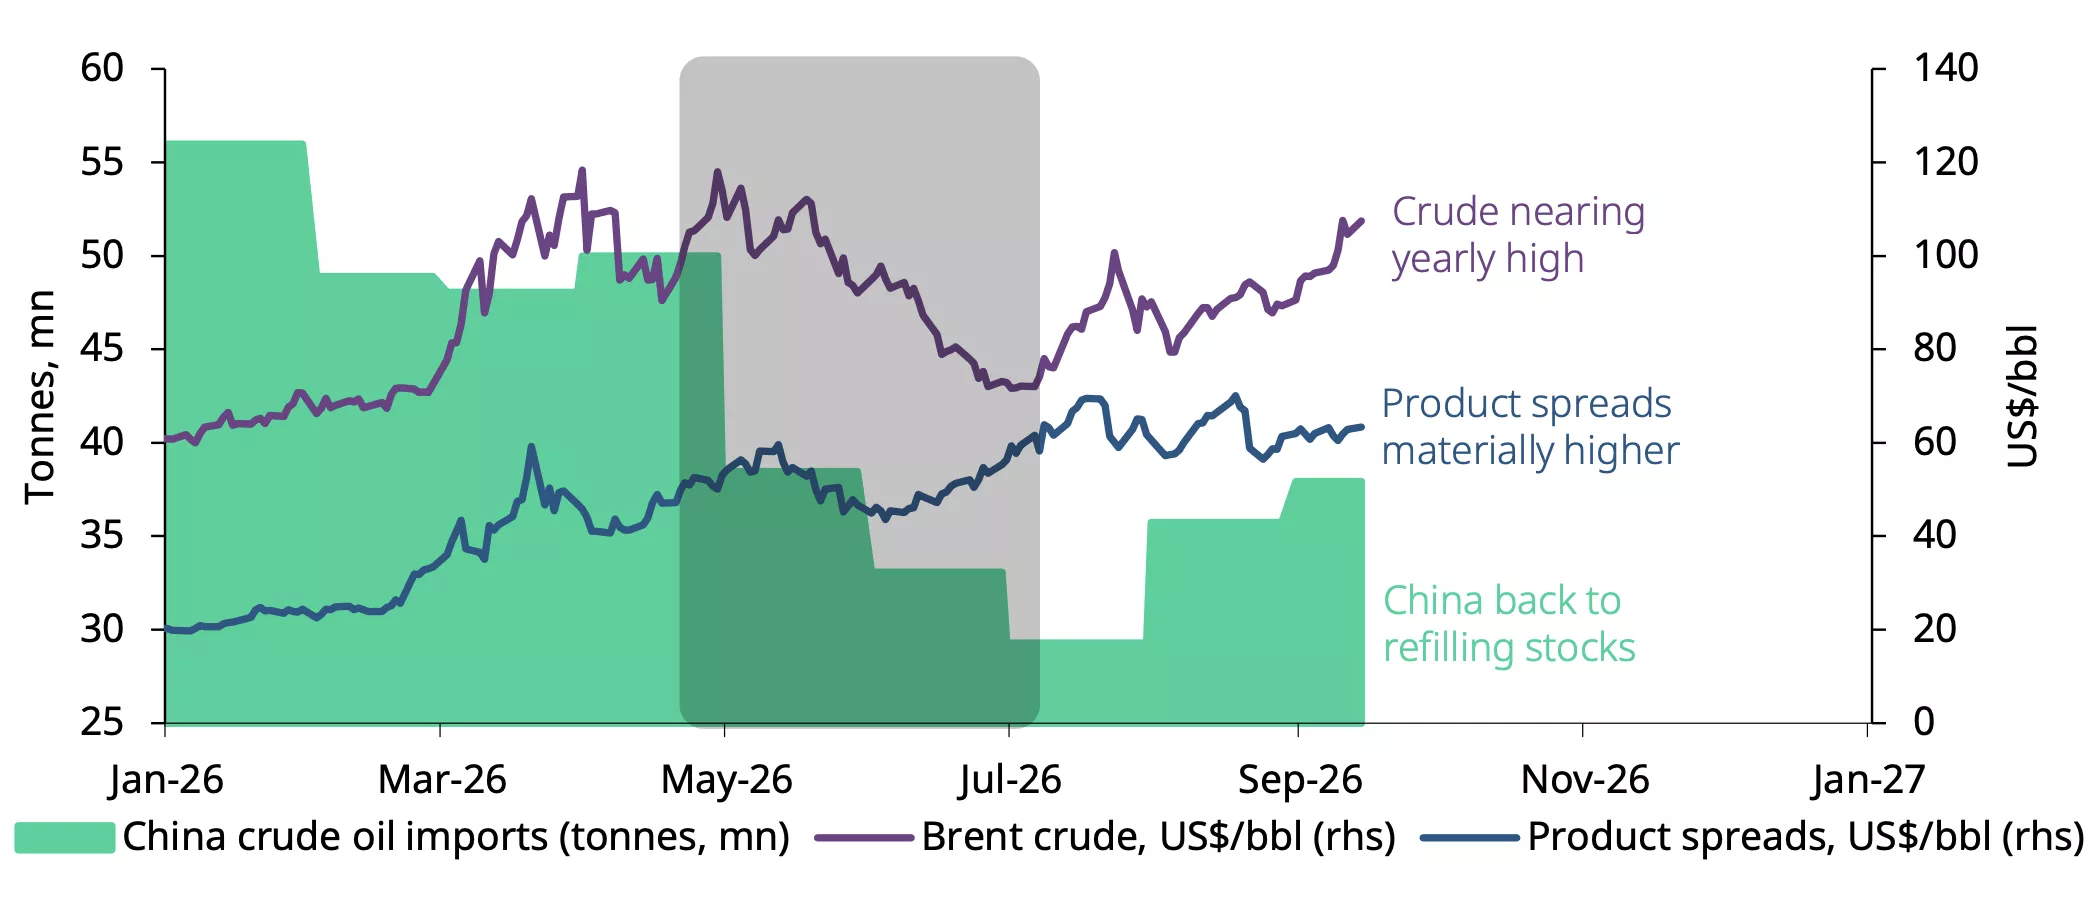
*Data to 11 September 2026. Brent Crude, NYMEX front month 3-2-1 crack product spread, China total crude imports.
Sources: Bloomberg, World Gold Council
Disclaimer
Important information and disclaimers
© 2026 World Gold Council. All rights reserved. World Gold Council and the Circle device are trademarks of the World Gold Council or its affiliates.
All references to LBMA Gold Price are used with the permission of ICE Benchmark Administration Limited and have been provided for informational purposes only. ICE Benchmark Administration Limited accepts no liability or responsibility for the accuracy of the prices or the underlying product to which the prices may be referenced. Other content is the intellectual property of the respective third party and all rights are reserved to them.
Reproduction or redistribution of any of this information is expressly prohibited without the prior written consent of World Gold Council or the appropriate copyright owners, except as specifically provided below. Information and statistics are copyright © and/or other intellectual property of the World Gold Council or its affiliates or third-party providers identified herein. All rights of the respective owners are reserved.
The use of the statistics in this information is permitted for the purposes of review and commentary (including media commentary) in line with fair industry practice, subject to the following two pre-conditions: (i) only limited extracts of data or analysis be used; and (ii) any and all use of these statistics is accompanied by a citation to World Gold Council and, where appropriate, to Metals Focus or other identified copyright owners as their source. World Gold Council is affiliated with Metals Focus.
The World Gold Council and its affiliates do not guarantee the accuracy or completeness of any information nor accept responsibility for any losses or damages arising directly or indirectly from the use of this information.
This information is for educational purposes only and by receiving this information, you agree with its intended purpose. Nothing contained herein is intended to constitute a recommendation, investment advice, or offer for the purchase or sale of gold, any gold-related products or services or any other products, services, securities or financial instruments (collectively, “Services”). This information does not take into account any investment objectives, financial situation or particular needs of any particular person.
Diversification does not guarantee any investment returns and does not eliminate the risk of loss. Past performance is not necessarily indicative of future results. The resulting performance of any investment outcomes that can be generated through allocation to gold are hypothetical in nature, may not reflect actual investment results and are not guarantees of future results. The World Gold Council and its affiliates do not guarantee or warranty any calculations and models used in any hypothetical portfolios or any outcomes resulting from any such use. Investors should discuss their individual circumstances with their appropriate investment professionals before making any decision regarding any Services or investments.
This information may contain forward-looking statements, such as statements which use the words “believes”, “expects”, “may”, or “suggests”, or similar terminology, which are based on current expectations and are subject to change. Forward-looking statements involve a number of risks and uncertainties. There can be no assurance that any forward-looking statements will be achieved. World Gold Council and its affiliates assume no responsibility for updating any forward-looking statements.
Information regarding the LBMA Gold Price
The LBMA Gold Price is used by the World Gold Council with permission under license by ICE Benchmark Administration Limited and is subject to the restrictions set forth here (www.gold.org/terms-and-conditions).
Information regarding QaurumSM and the Gold Valuation Framework
Note that the resulting performance of various investment outcomes that can be generated through use of Qaurum, the Gold Valuation Framework and other information are hypothetical in nature, may not reflect actual investment results and are not guarantees of future results. Neither World Gold Council (including its affiliates) nor Oxford Economics provides any warranty or guarantee regarding the functionality of the tool, including without limitation any projections, estimates or calculations.
Information from ICRA Analytics Limited
All information obtained from ICRA Analytics Limited contained in this document is subject to the disclaimer set forth here (www.icraanalytics.com/terms-of-use/disclaimer).
