• Goldhub
  • Research
  • Central Banks

  • Latest issue

    Central Banks


    Podcast: Exploring the link between gold and central bank digital currencies

    World Gold Council

    The experts on gold


    What impact will the emergence of central bank digital currencies and cryptoassets have on the gold market? John Reade, our Chief Market Strategist and Bob Wardrop, director and co-founder of the Cambridge Centre for Alternative Finance, join David Marsh, OMFIF chairman, to explore this question.

    They expand on topics emerging from the recent OMFIF and World Gold Council paper ‘Central bank digital currencies and gold’, including those surrounding geopolitics, inflation, trust and the role of gold in a future dominated by CBDCs and cryptoassets.

    Central bank selling outweighs buying at the start of 2022

    Krishan Gopaul

    Senior Analyst, EMEA World Gold Council


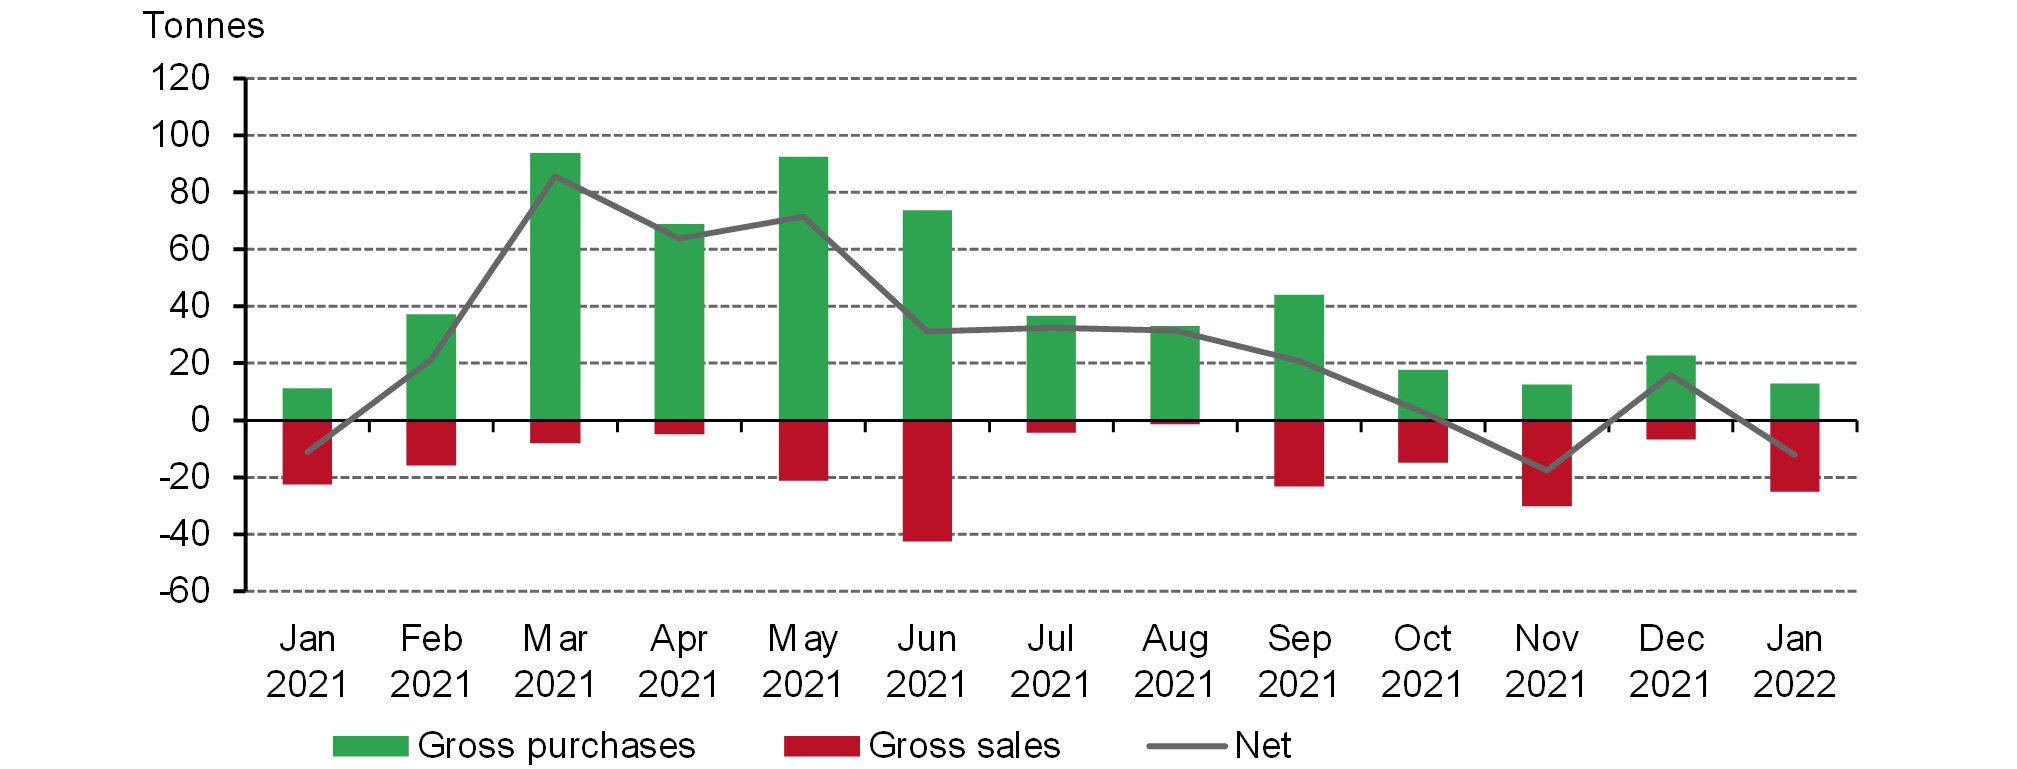
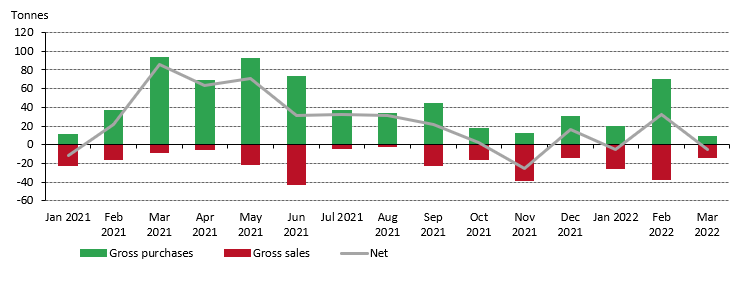
    Following a strong 2021, in which central banks accumulated 463t of gold, today we’ve released the first set of central bank gold reserve data for 2022.1  Available data shows that global gold reserves fell by 12t in January (Chart 1). On the face of it, this is a continuation of the switching between net purchases and sales we have seen in recent months.

    Chart 1: Central banks net sales in January

    *Data to 31 January 2022. Note: Japan’s reported 81t increase in its gold reserves in March 2021 has been excluded as this was the culmination of an off-market transaction between two different divisions within the Ministry of Finance.
    Source: IMF IFS, Respective Central Banks, World Gold Council

    The bulk of the decline in January was due to a sizeable sale from Kazakhstan. Its gold reserves fell by just over 17t, taking the level of gold reserves to 385t (66% of total reserves) – the lowest tonnage level since October 2020. Kazakhstan is a significant gold producing country and their central bank has traditionally bought from domestic sources. It is not uncommon for those counties that buy from domestic sources to swing between buying and selling. Other sellers include Russia (3t), Poland (2t), Uzbekistan (1t), and Mongolia (1t). While Poland has been purchasing gold for strategic reasons, and recently announced its intention to buy 100t this year, its gold reserves are, at least in part, actively managed. For example, in July last year Poland sold 2t, seizing on the high price of gold.

    Gross purchases totalled less than 13t in January, with one central bank accounting for the majority of this. Turkey bought over 10t during the month, pushing gold reserves back over 400t (25% of total reserves). India made its twelfth consecutive monthly purchase adding just over 1t during the month and taking total gold reserves to 755t. According to the latest data from the Reserve Bank of India, official gold reserves have risen by a further 2.2t m-t-d in February.2 Qatar and Ireland also bought gold in January, of 0.7t and 0.5t respectively, with the latter continuing to represent developed market interest in gold.

    But arguably the biggest story so far this year came at the end of February, when the Central Bank of Russia (CBR) announced that it would resume buying gold from domestic producers following tougher international sanctions. The CBR suspended its gold purchases in 2020, since when the overall level of gold reserves has remained largely unchanged. Russia held just under 2,300t of gold (21% of total reserves) at the end of January. There has been no indication given around the scale of future purchases, but we will continue to monitor developments.

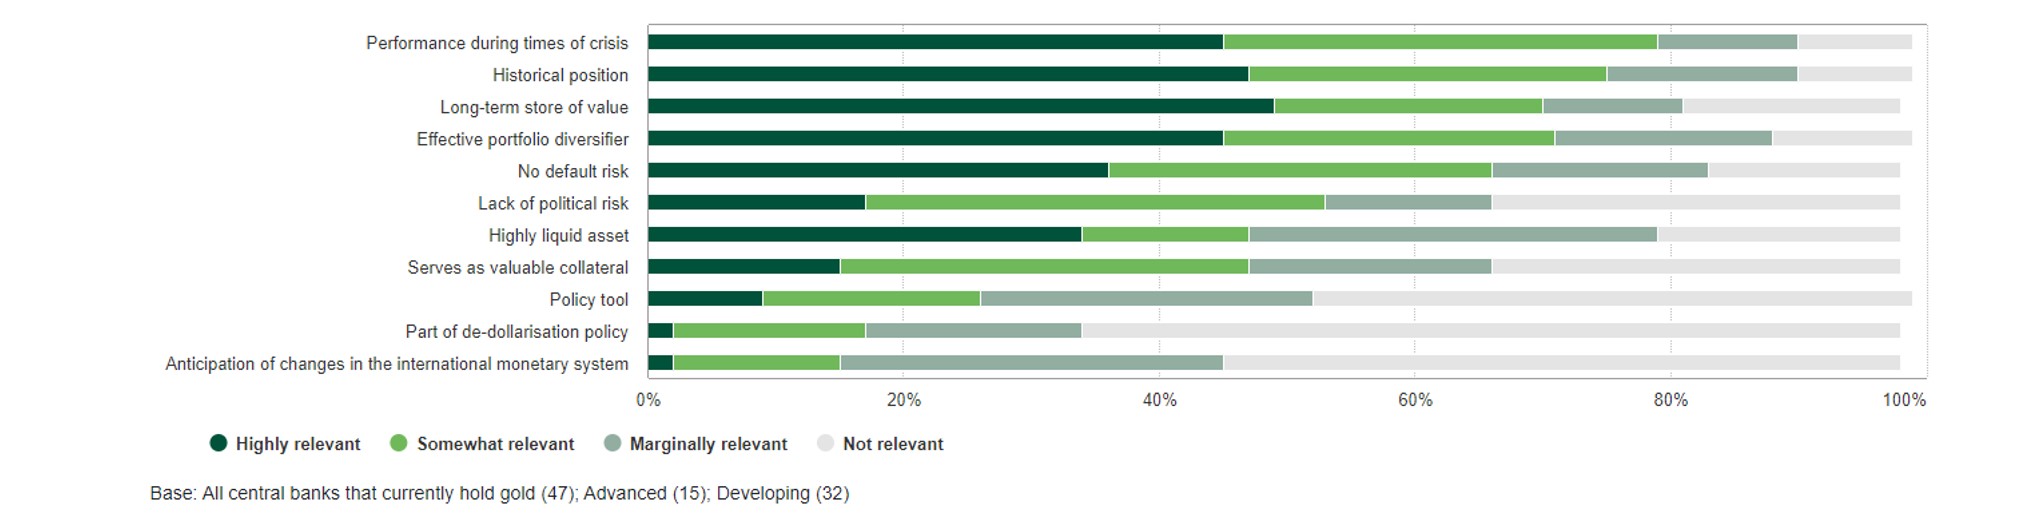
    Despite January’s net sales, we remain positive on central bank demand overall. Many of the key factors identified in our 2021 Central Bank Gold Reserves Survey remain relevant at the start of 2022 (Chart 2). As we noted in our Q4 and Full Year Gold Demand Trends report, we believe it is likely that central bank demand for gold will continue its positive 12-year trend in 2022, but may not match the strong performance of 2021. Looking forward, the results of our upcoming 2022 Central Bank Gold Reserves survey will be published in Q2, providing an updated look at central bank interest in gold.
     

    Chart 2: How relevant are the following factors in your organisation’s decision to hold gold?

    2021 responses, all central banks
    Source: World Gold Council


    1Our data set is based on IMF data but is supplemented with data from respective central banks where it is available and not reported through the IMF at the time of publication. This data may be revised in our next monthly update should more data become available.

    2Data to 18 February 2022.

    Global central bank net sales continue in February

    Krishan Gopaul

    Senior Analyst, EMEA World Gold Council


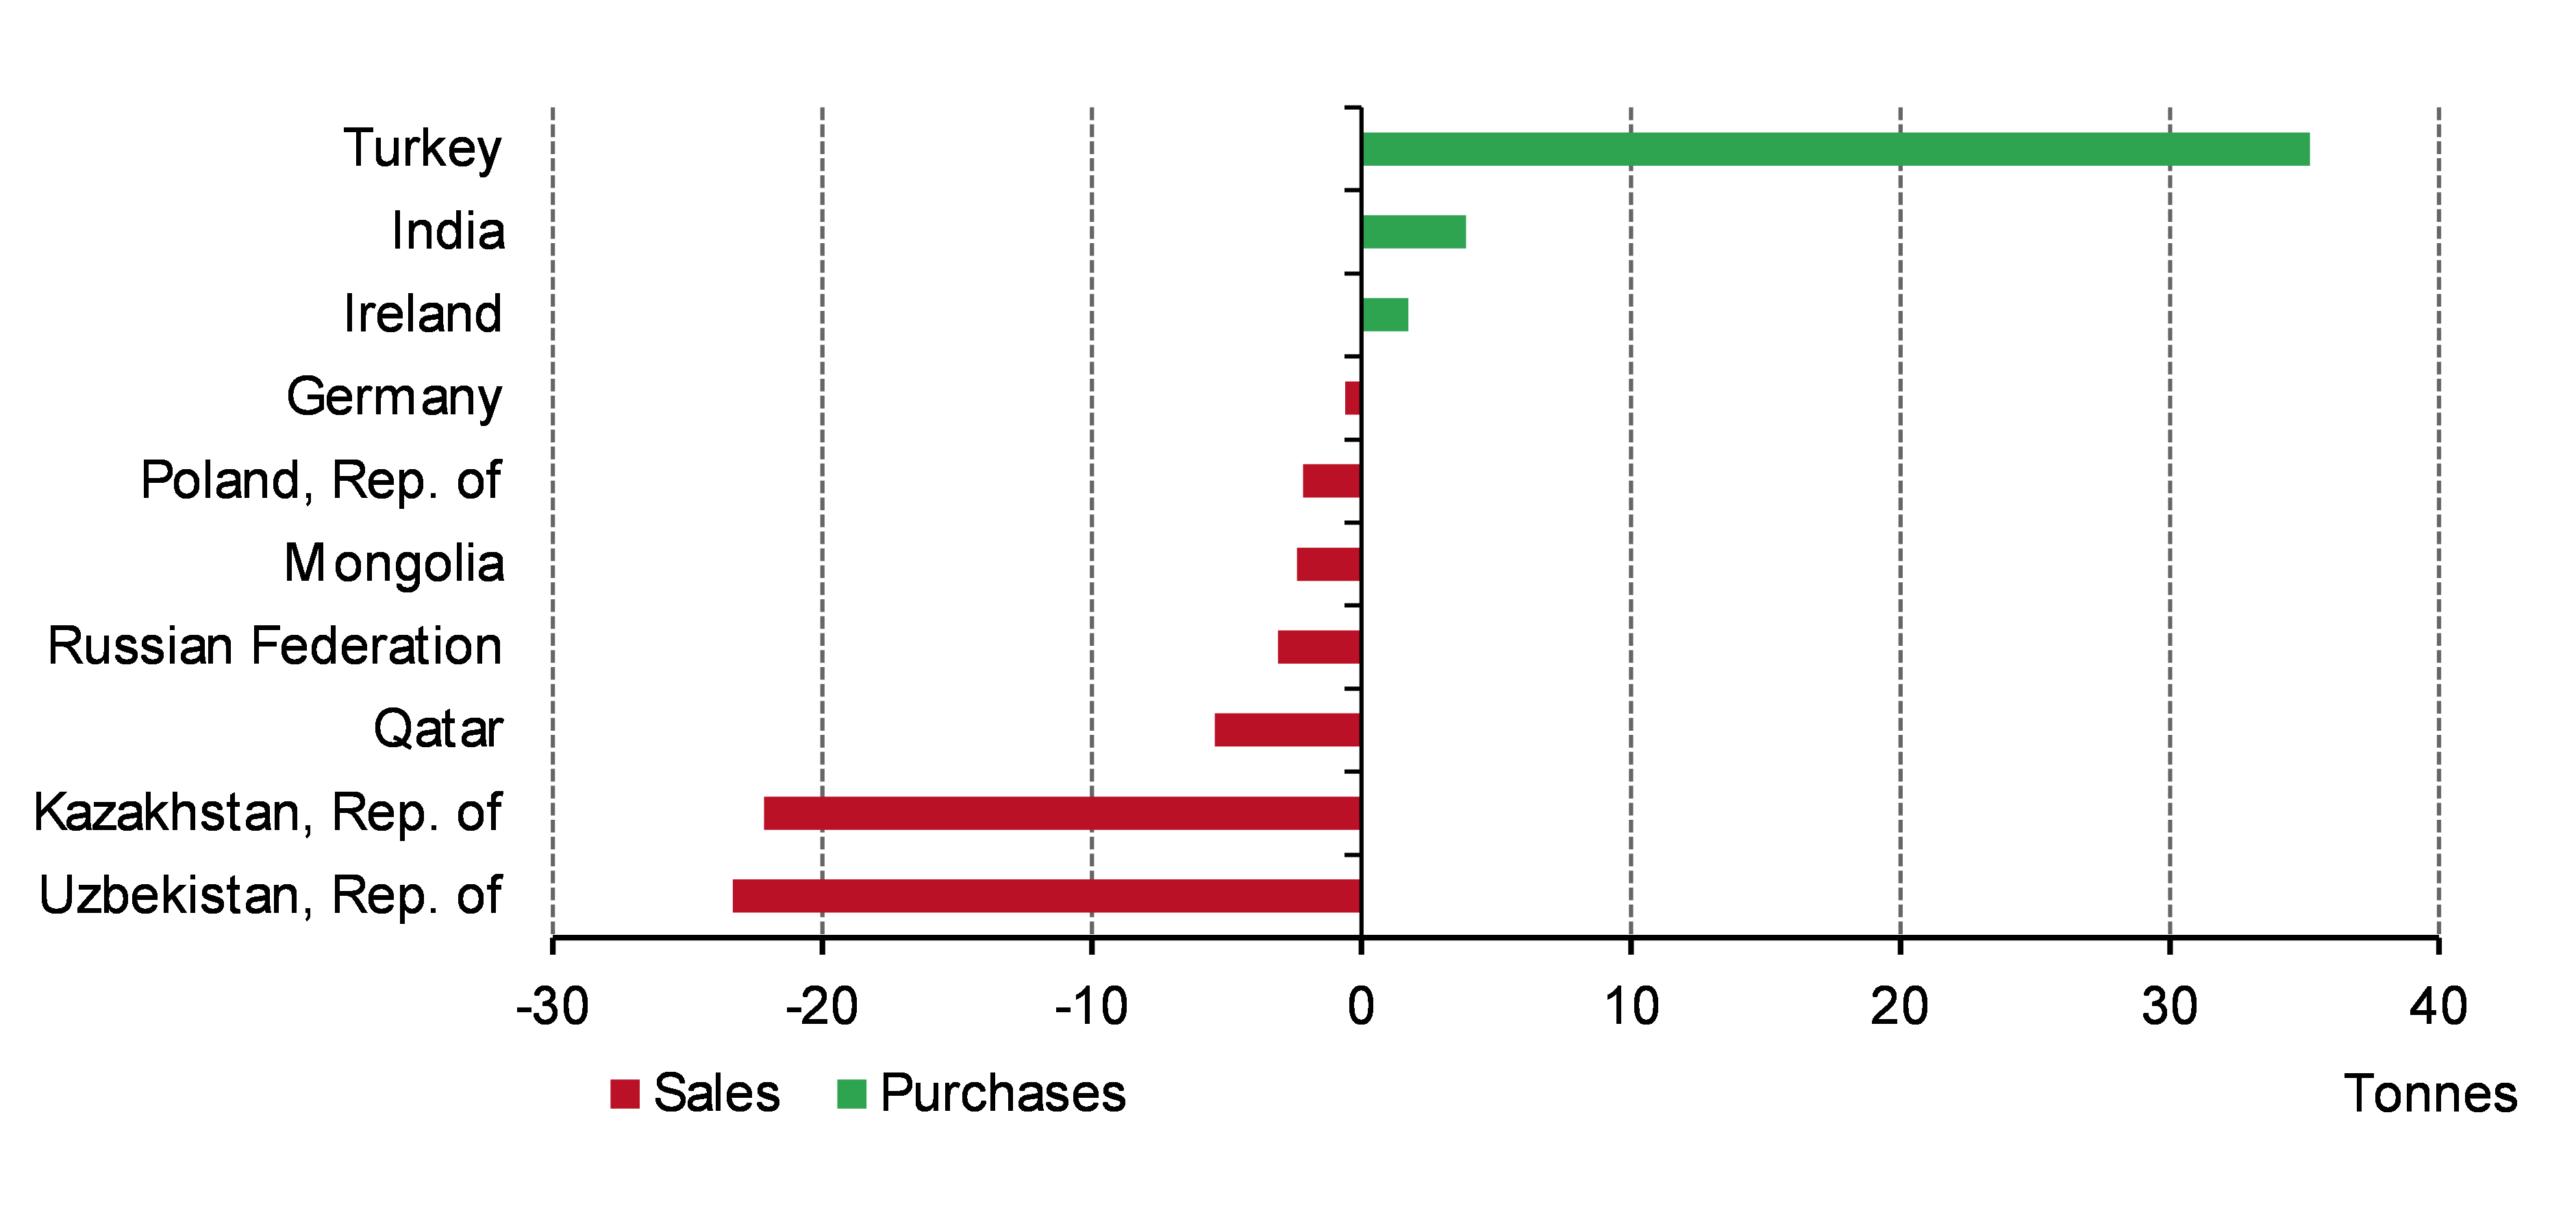
    Global central bank gold reserves fell by 6t in February (Chart 1).1,2 This is the second consecutive month of net sales, something not seen since 2020. However, despite a cumulative decline of 18t y-t-d, global gold reserves remain above 35,600t – their highest level since 1990.3


    Chart 1: Central banks net sales continued in February*

    Activity in February was confined to a small number of banks, with significant changes at one or two once again dominating the story. Uzbekistan was the largest seller in the month, decreasing its gold reserves by 22t to 339t – the lowest level of gold holdings since December 2020. As we have noted previously, this is not the first significant transaction from Uzbekistan in recent years. Active management of its gold reserves means changes are common. Even after the sale in February, gold reserves still account for 59% of total reserves.

    Other net sales were modest in comparison. Kazakhstan sold a further 5t in February, following a 17t sale in January. Gold reserves now total 380t (69% of total reserves) – the lowest level since June 2020. Kazakhstan has traditionally bought from domestic sources and it is not uncommon for gold producing nations to swing between buying and selling. Qatar (6t), Mongolia (1t) and Germany (1t) were the other notable sellers in the month – with the latter likely related to coin-minting.

    Net purchases were dominated by Turkey, which added 25t to its gold reserves in February. This takes y-t-d buying to over 35t (Chart 2), and pushes total gold reserves to 429t (27% of total reserves). India bought 2.6t in February, taking its total gold holdings to 758t. Ireland, the only active developed market buyer, added 1t of gold to its reserves during the month. Total gold holdings now stand at over 11t, 88% higher than at the end of August 2021, when Ireland began to purchase gold.

    We will have a full review of central bank gold activity in Q1 2022 in our upcoming Gold Demand Trends report which will be published at the end of April.


    Chart 2: Year-to-date central bank net purchases and sales*

    Footnotes

    1Our data set is based on IMF data but is supplemented with data from respective central banks where it is available and not reported through the IMF at the time of publication. This data may be revised in our next monthly update should more data become available.

    2All figures are net except where otherwise indicated.

    3Global gold reserves as at 31 January 2022.

    Global central banks flipped back to net sales in March

    Mukesh Kumar

    Former Senior Analyst, India World Gold Council


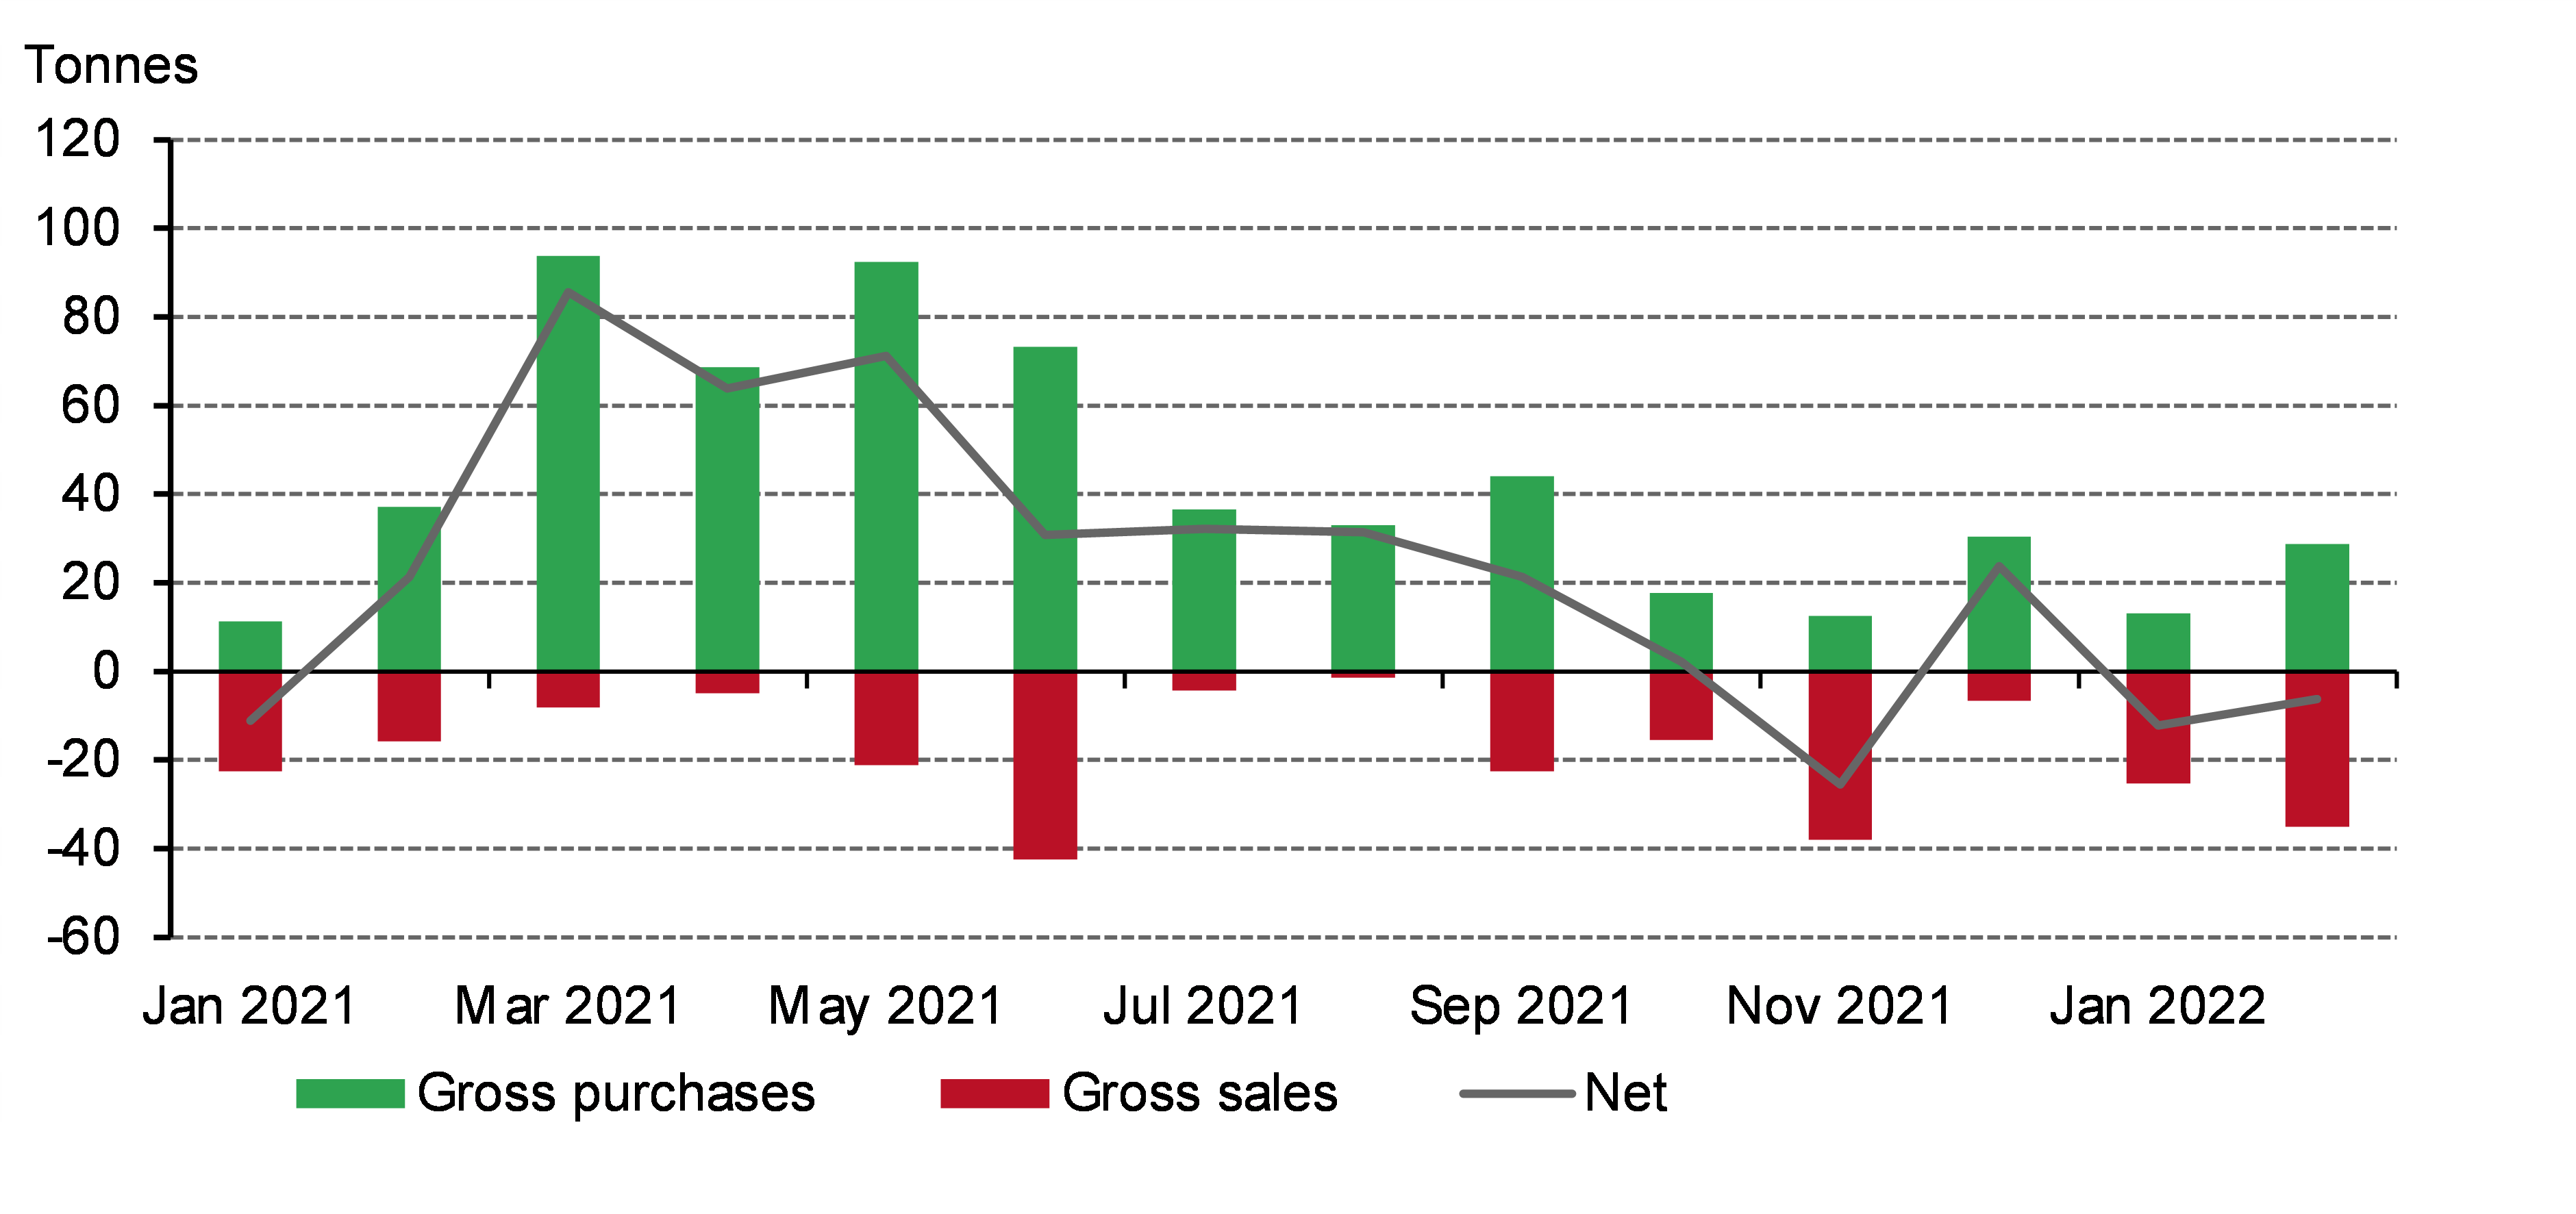
    Global central bank gold reserves fell by 4t in March (based on latest available data), flipping back to net sales following healthy net purchases of 32.3t in February (Chart 1). 1, 2

    Chart 1: Central banks sold 4t of gold in March 2022

    *Data to 26 April 2022. Note: Japan’s reported 81t increase in its gold reserves in March 2021 has been excluded as this was the culmination of an off-market transaction between two different divisions within the Ministry of Finance.

    Source: IMF IFS, Respective Central Banks, World Gold Council

    Activity in March was confined to a small number of banks, dominated by significant changes at just one or two. Kazakhstan was the largest seller in the month, decreasing its gold reserves by a further 12t, following 5t sale in February. Gold reserves now total 368t (69% of total reserves). Kazakhstan has traditionally bought from domestic sources and it is not uncommon for gold producing nations to swing between buying and selling. Uzbekistan sold a modest 1t in the month, taking its gold reserves to 338t – the lowest level of gold holdings since December 2020. As we have noted previously, this is not the first significant transaction by Uzbekistan in recent years: active management of its gold reserves means changes are common. Even after the sale in March, gold reserves still account for 60% of total reserves.

    Net purchases were dominated by Turkey, which added 5t to its gold reserves in March. This takes y-t-d buying to 37t and pushes total gold reserves to 431t (28% of total reserves). India bought 2t in March, taking its total gold holdings to 760t. Ireland added another 0.8t in March- seventh consecutive monthly purchases since September 2021, taking its total gold reserves to 12t (6% of total reserves).

    We will have a full review of central bank gold activity in Q1 2022 in our upcoming Gold Demand Trends report which will be published at the end of April.


    Footnotes

    1 Our data set is based on IMF data but is supplemented with data from respective central banks where it is available and not reported through the IMF at the time of publication. This data may be revised in our next monthly update should more data become available.

    2 All figures are net except where otherwise indicated.

    Meandering monthly central bank activity continues with net purchases in April

    Mukesh Kumar

    Former Senior Analyst, India World Gold Council


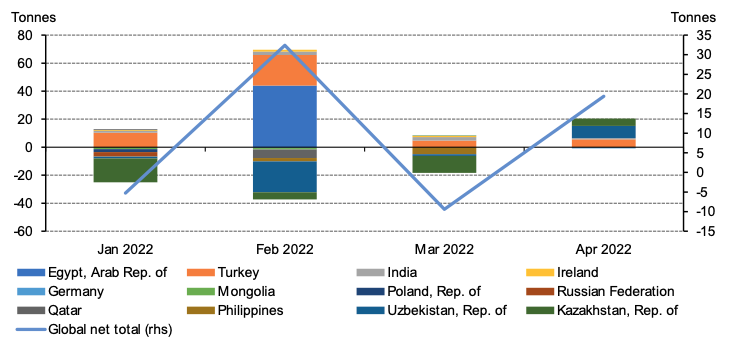
    So far in 2022, central banks’ monthly gold reported activity has been bobbing between net purchases and sales linked to a fairly small number of banks. As such, any significant purchase or sale from those can tip the balance in a given month. In April, central banks were once again net purchasers, to the tune of 19.4t (Chart 1).


    Chart 1: Monthly central bank purchases

    *Data to 30 April 2022. Note: Japan’s reported 81t increase in its gold reserves in March 2021 has been excluded as this was the culmination of an off-market transaction between two different divisions within the Ministry of Finance.

    Source: IMF IFS, Respective Central Banks, World Gold Council

    Four banks contributed to gross purchases of 20.5t in April. Those central banks adding to their gold reserves during the month were all familiar names. Uzbekistan (+8.7t) and Kazakhstan (+5.3t) both saw their gold reserves rise during the month, their first monthly increases this year after three consecutive months of net sales. Turkey continued its gold buying this year, adding a further 5.6t in April which took its gold reserves to 436.7t (27.8% of total reserves). India increased its gold holdings by a fractional 0.9t to 761.3t.

    Gross sales were limited to small number of central banks. Germany (-0.9t) was the notable seller in the month – likely related to coin-minting. Mexico (-0.1t) and Czech Republic (-0.1t) were other minor sellers in the month.

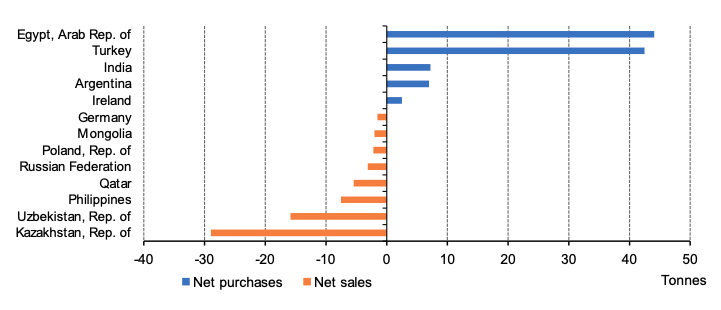
    On a year-to-date basis, central banks remain net purchasers on the whole. Egypt is the largest buyer following its chunky 44.1t purchase in March, but Turkey is not far behind, having bought 42.5t to the end of April. Kazakhstan (-29t) and Uzbekistan (-15.9t) remain the largest sellers so far in 2022 despite the purchases in April (Chart 2).

    In a notable development in the central bank space, incoming governor of the Czech central bank stated in an interview that he believes the central bank should significantly increase its gold reserves ‘from 11 tonnes to 100 tonnes or more’ as part of a proposed strategy to increase the expected return on official reserves and make the Czech National Bank (CNB) ‘profitable’. Ales Michl said that he believes that the increase in gold reserves should be gradual ‘over several years’, emphasising that gold is ‘good for diversification…’.


    Chart 2: Year-to-date purchases/sales

    *Data to 30 April 2022. Note: chart include only purchases/sales of 0.5t or above.

    Source: IMF IFS, Respective Central Banks, World Gold Council

    We will be publishing the findings from our 2022 central bank survey findings on 8th June 2022. This will provide a more up-to-date look at the most important factors for central banks in managing their gold holdings, as well as a raft of other details related to gold reserves. As always, this data will be available exclusively on Goldhub.

    Central banks come out swinging but despite markedly higher rates, gold is resilient

    Krishan Gopaul

    Senior Analyst, EMEA World Gold Council


    Last week central banks stepped up their response to soaring inflation. Having been regarded as “behind the curve” in their attempts to control this issue thus far, they are now showing greater concern and resolve in bringing consumer prices down.

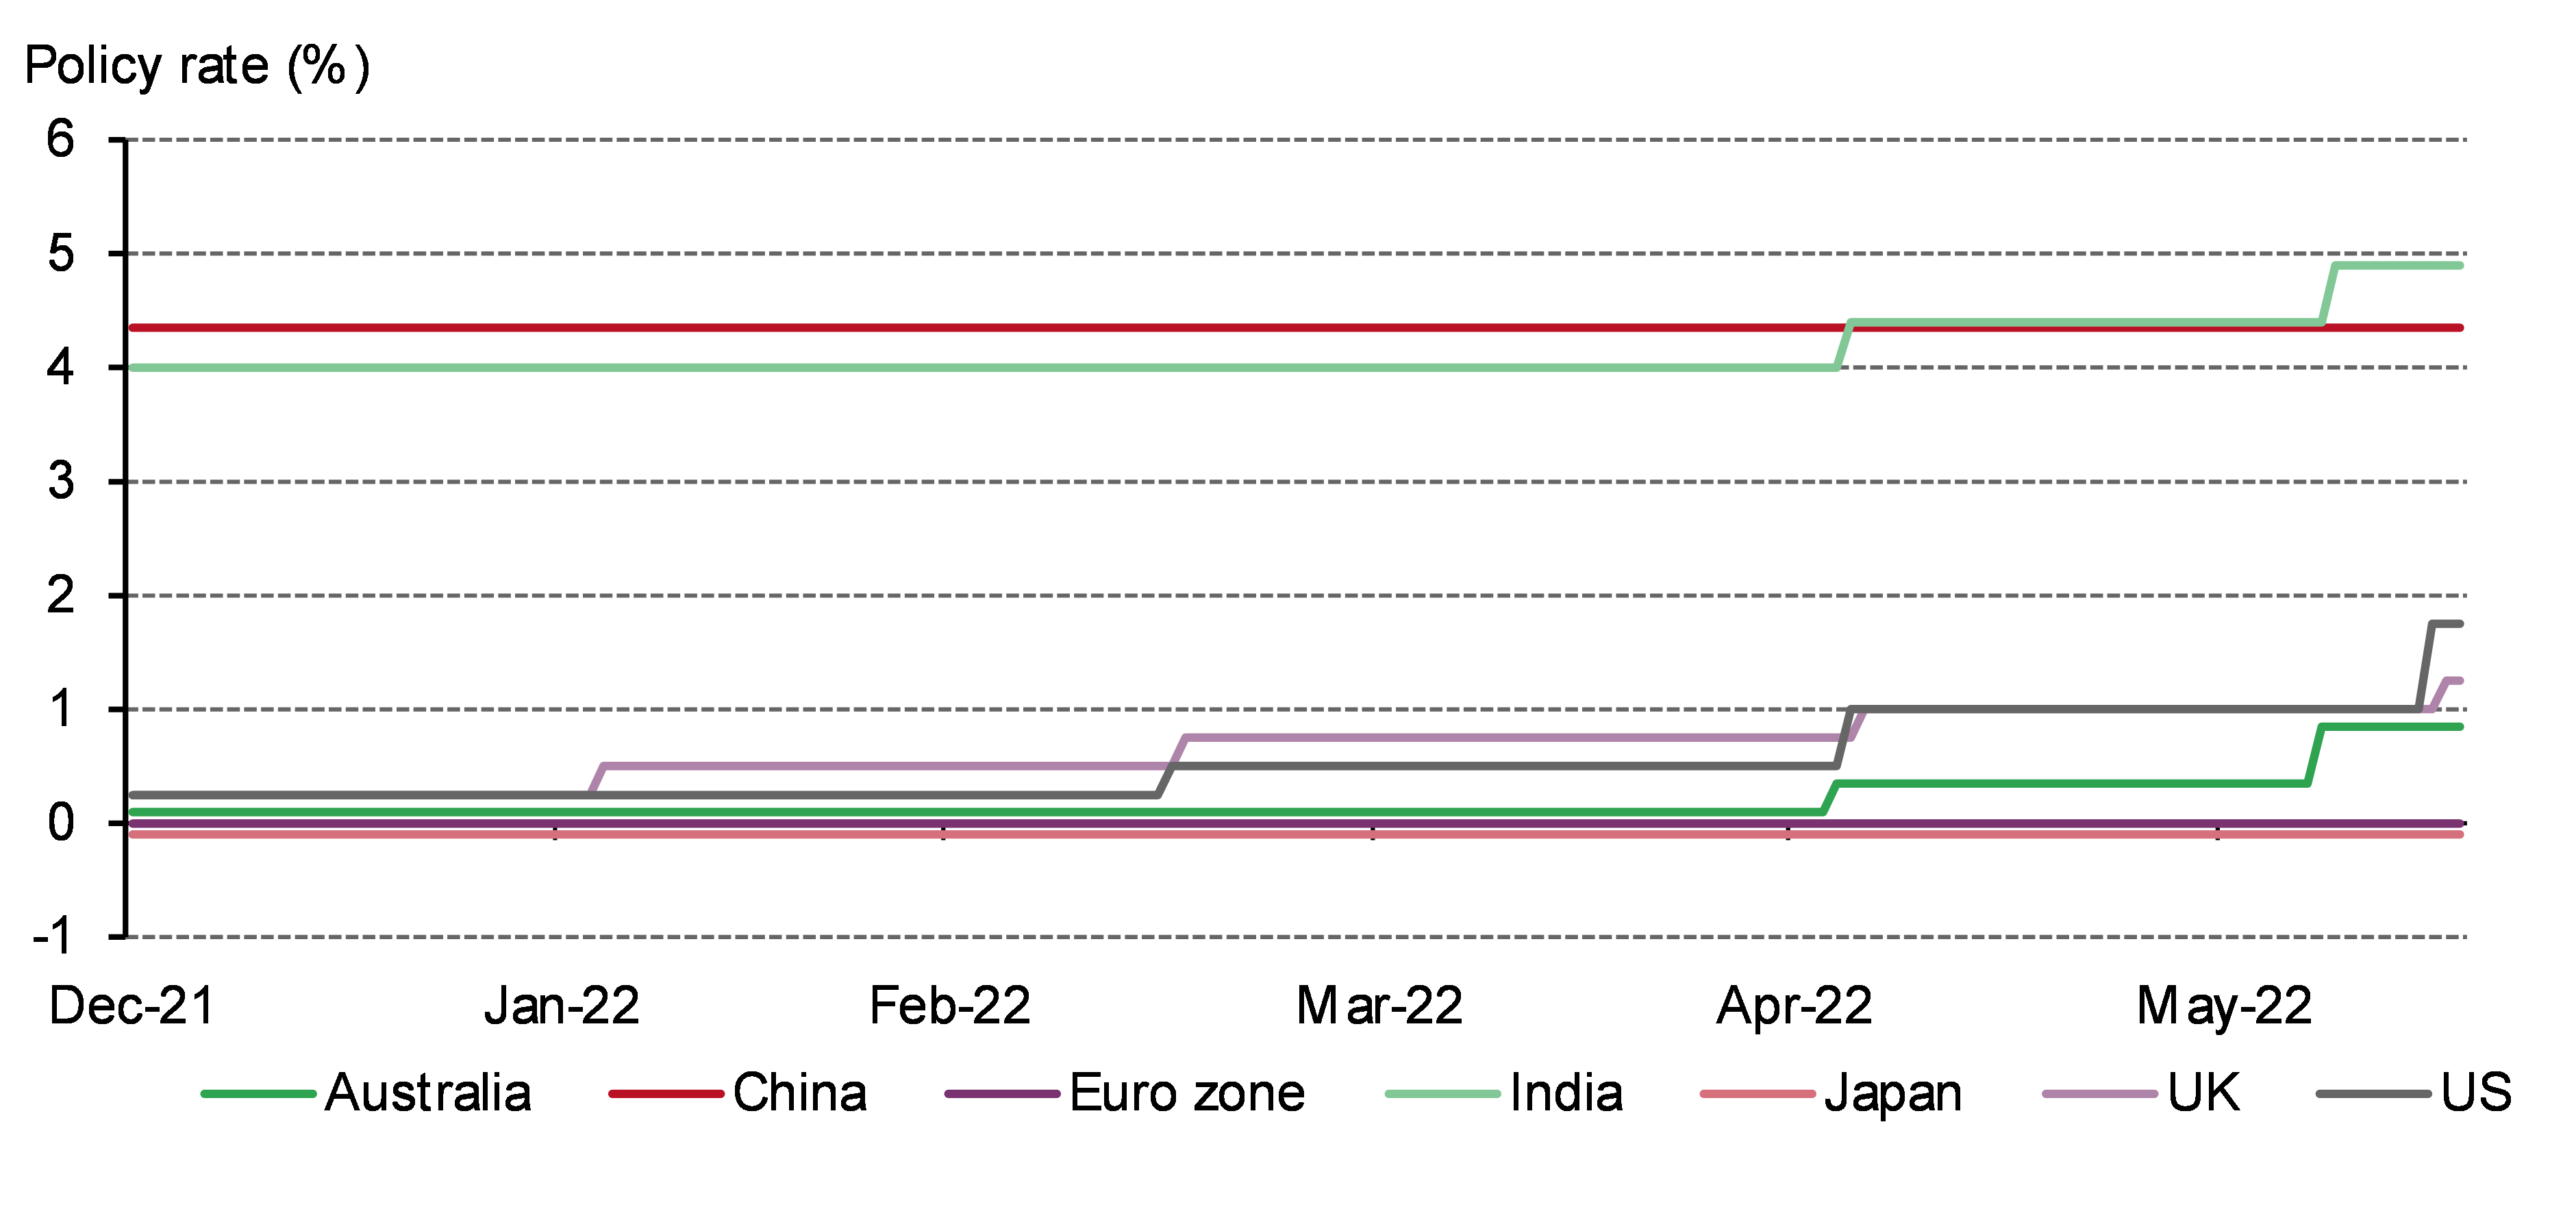
    Most notably, the US Fed hiked its funding rate by 75bp to a 1.5%-1.75% range – the largest single rate hike in almost three decades – thus readjusting monetary policy expectations from as recently as the previous week. But while the Fed policy action dominated the headlines, several other central banks also bolstered their hawkish credentials. The Bank of England increased its base rate by a further 0.25%, its fifth consecutive increase, to 1.25%; the ECB held an emergency meeting to discuss a potential response to rising sovereign borrowing costs; and the Swiss National Bank hiked rates for the first time in 15 years. The Bank of Japan, in contrast, bucked the trend by maintaining its accommodative stance despite increased pressure on the yen (Chart 1). 

    While equities initially rallied following the Fed announcement – that the overall pace of rate rises will be more gradual than expected – they quickly resumed their year-to-date decline, as the market assessed the potential impact of this action. Year-to-date, US and European equity indices have fallen 15-20%, (US technology stocks have fallen ~30%), while US 10-year yields are up almost 200bps. Sovereign bond yields also continued their rise having initially dropped on the Fed news. In our view, this speaks to lingering investor concerns about the growth outlook given more aggressive monetary policy. The Fed is threading the needle to navigate the US economy to a “soft landing”, and other central banks face a similar challenge, while the ECB has to also contend with potential fragmentation in sovereign borrowing costs (various European sovereign 10-year yields are up 200-300bps year-to-date).

    Amid these changes and concerns, gold remains steady: up 1% year-to-date in US dollars and far higher in other currencies. Our analysis has shown that gold has been well-supported by inflation and geopolitical risks, although higher interest rates continue to be a headwind. Although higher rates are concerning, with Fed Chairman Powell explicitly saying he would like to see positive real rates across the curve, the Fed is pointing to 2.3% inflation by 2024 and terminal rate of 3.8%. While we don’t know where longer yields might be resting then, a shorter maturity real yield of 1.5% is below what we’ve identified, historically at least, as a threshold for gold to be significantly impacted by real rates. We’ve found that historically, real yields below 2.5% have not been substantially negative for gold (Table 1). A return to a real rate environment of 0–2.5% tends only to result in slightly lower real returns on gold compared to its 6.2% long-term average.

    Table 1: Gold has outperformed in moderate real- and nominal-rate environments

    Interest rate environment Annualised nominal gold return Annualised real gold return
    Absolute real rate level    
    All 8.0% 3.9%
    Negative 18.7% 10.8%
    Moderate 9.5% 6.2%
    High 2.7% -0.6%
    Rate direction  
    Falling 7.1% 4.5%
    On Hold 10.5% 6.8%
    Rising 5.1% -1.3%

    *31 January 1970 to 31 August 2021. Interest rate environments classified by US 10-year interest rate yield. The original analysis for this table can be found here: Investment Update: Rates pose risks but also unlock opportunities for gold.
    Source: Bloomberg, World Gold Council

    While interest rates are rising, we believe the combined impact of inflation pressure and widespread geopolitical risks will reinforce gold as an attractive hedge for both retail and institutional investors seeking protection and liquidity in this turbulent environment.

    Central banks add more gold in month of May

    Krishan Gopaul

    Senior Analyst, EMEA World Gold Council


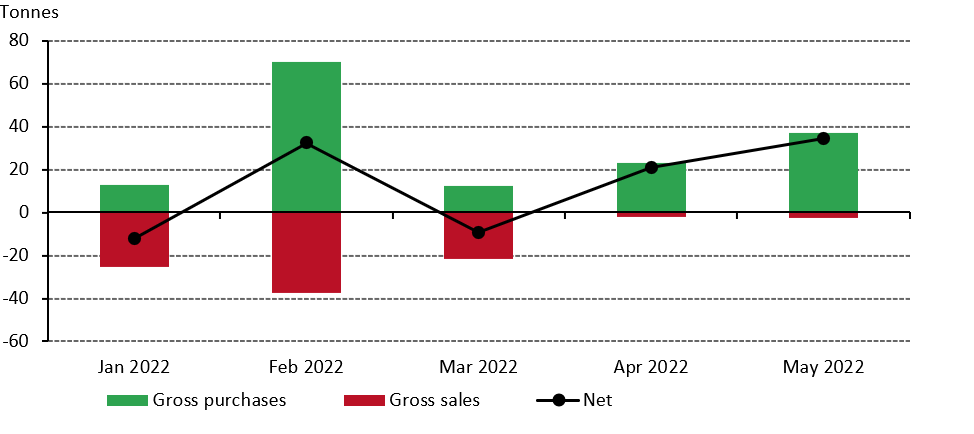
    The latest update to our central bank holdings data set – capturing data to end-May – is now available. It shows that in May, central banks reported adding a net 35t to global gold reserves.1  This is the second consecutive month of net buying, having recently oscillated between monthly net purchases and sales (Chart 1).

    *Data to 31 May 2022. On Goldhub, see: Central bank holdings   

    Source: IMF IFS, respective central banks, World Gold Council

    Purchases were primarily concentrated among the same four banks that dominated buying in April. Turkey (13t), Uzbekistan (9t), Kazakhstan (6t) and India (4t) all added to their gold reserves again in May, accounting for most of the month’s buying. Qatar added 5t to its gold reserves in May, taking total gold reserves back to 56.7t, the same level as the start of 2022. Contrastingly, Germany was the only notable seller during the month, reducing its gold reserves by 2t, likely for its longstanding coin-minting programme.

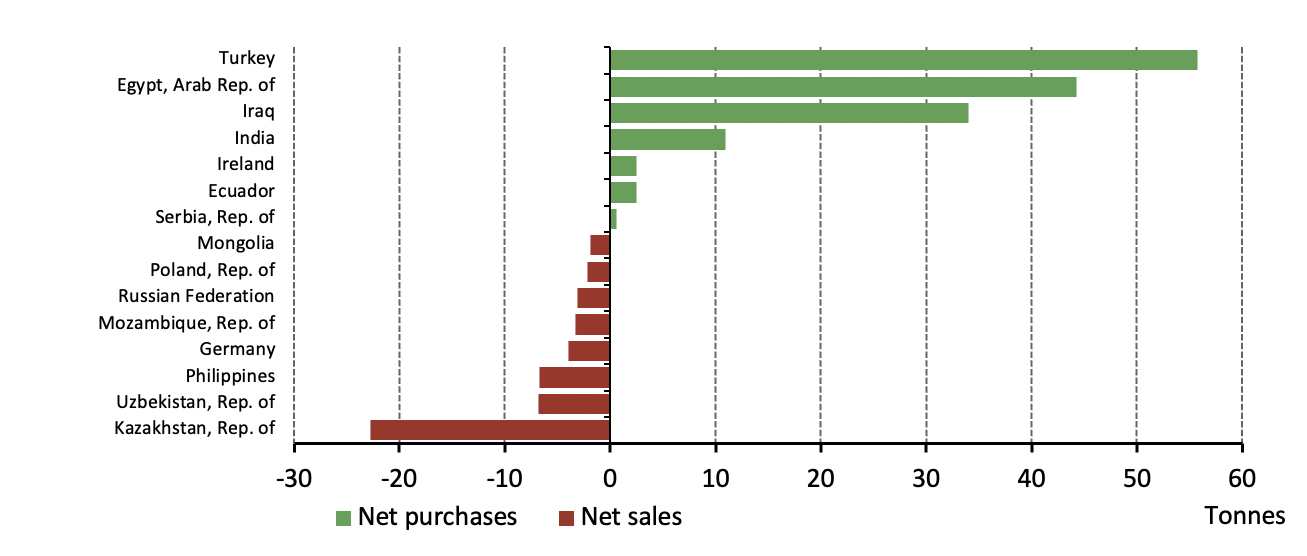
    Last week, the Central Bank of Iraq (CBI) also announced it had bought around 34 tonnes in June, lifting its total gold reserves to just over 130 tonnes. This is the first significant gold purchase from the CBI since September 2018 (6.5t). This is not yet reflected in IMF data, but we will add this to our statistics next month.

    Year-to-date, reported buying has been dominated by Turkey (56t), Egypt (44t) and Iraq (34t), and supported by more modest buying from a small number of other banks (Chart 2). And while we have seen a larger number of banks reduce their gold holdings so far in 2022, the total volume of sales is below that of purchases.

    *Data to 31 May 2022. Note: chart includes the recent purchase by the Central Bank of Iraq which took place in June 2022. On Goldhub, see: Central bank holdings

    Source: IMF IFS, respective central banks, World Gold Council

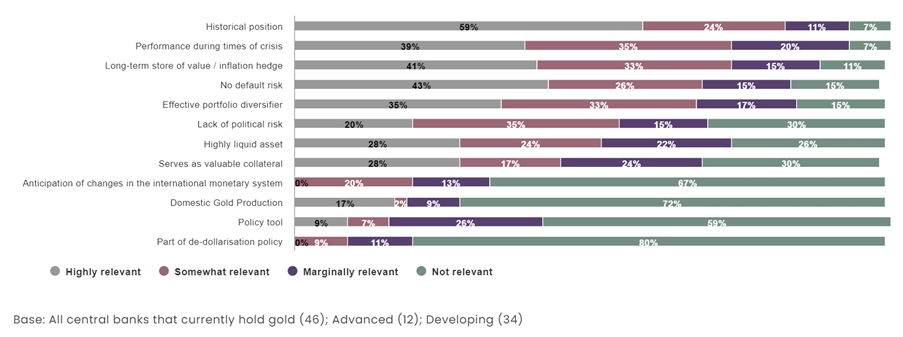
    This data supports the findings from our recently published annual central bank survey. The survey found that 25% of central banks who responded intend to increase their gold reserves in the next 12 months (versus 21% in 2021). It also shows that gold’s performance during a time of crisis and its role as a long-term store of value/inflation hedge are key determinants of central banks’ decision to hold gold (Chart 3). More detail on the survey can be found here.

    On Goldhub, see: Annual central bank survey

    Source: World Gold Council

    In June, it was also reported that the Central Bank of Bolivia (BCB) has proposed a new law enabling it to become the sole purchaser of domestically-produced gold. This would be similar to policies used in some other gold-producing nations, where the central bank is given first refusal on gold production before it can be sold on the international market. Ecuador, for example, recently bought gold through a domestic buying programme. No details were given as to the amount of gold the BCB might buy if the law were to be passed. The report also notes that the new law would allow the central bank to use its gold reserves (43t) as collateral or in swaps without the need for legislative approval.


    Footnotes

    1 Our data set is based on IMF data but is supplemented with data from respective central banks where it is available and not reported through the IMF at the time of publication. This data may be revised in our next monthly update should more data become available. All figures are net except where otherwise indicated.

    Central bank buying strengthens in June

    Krishan Gopaul

    Senior Analyst, EMEA World Gold Council


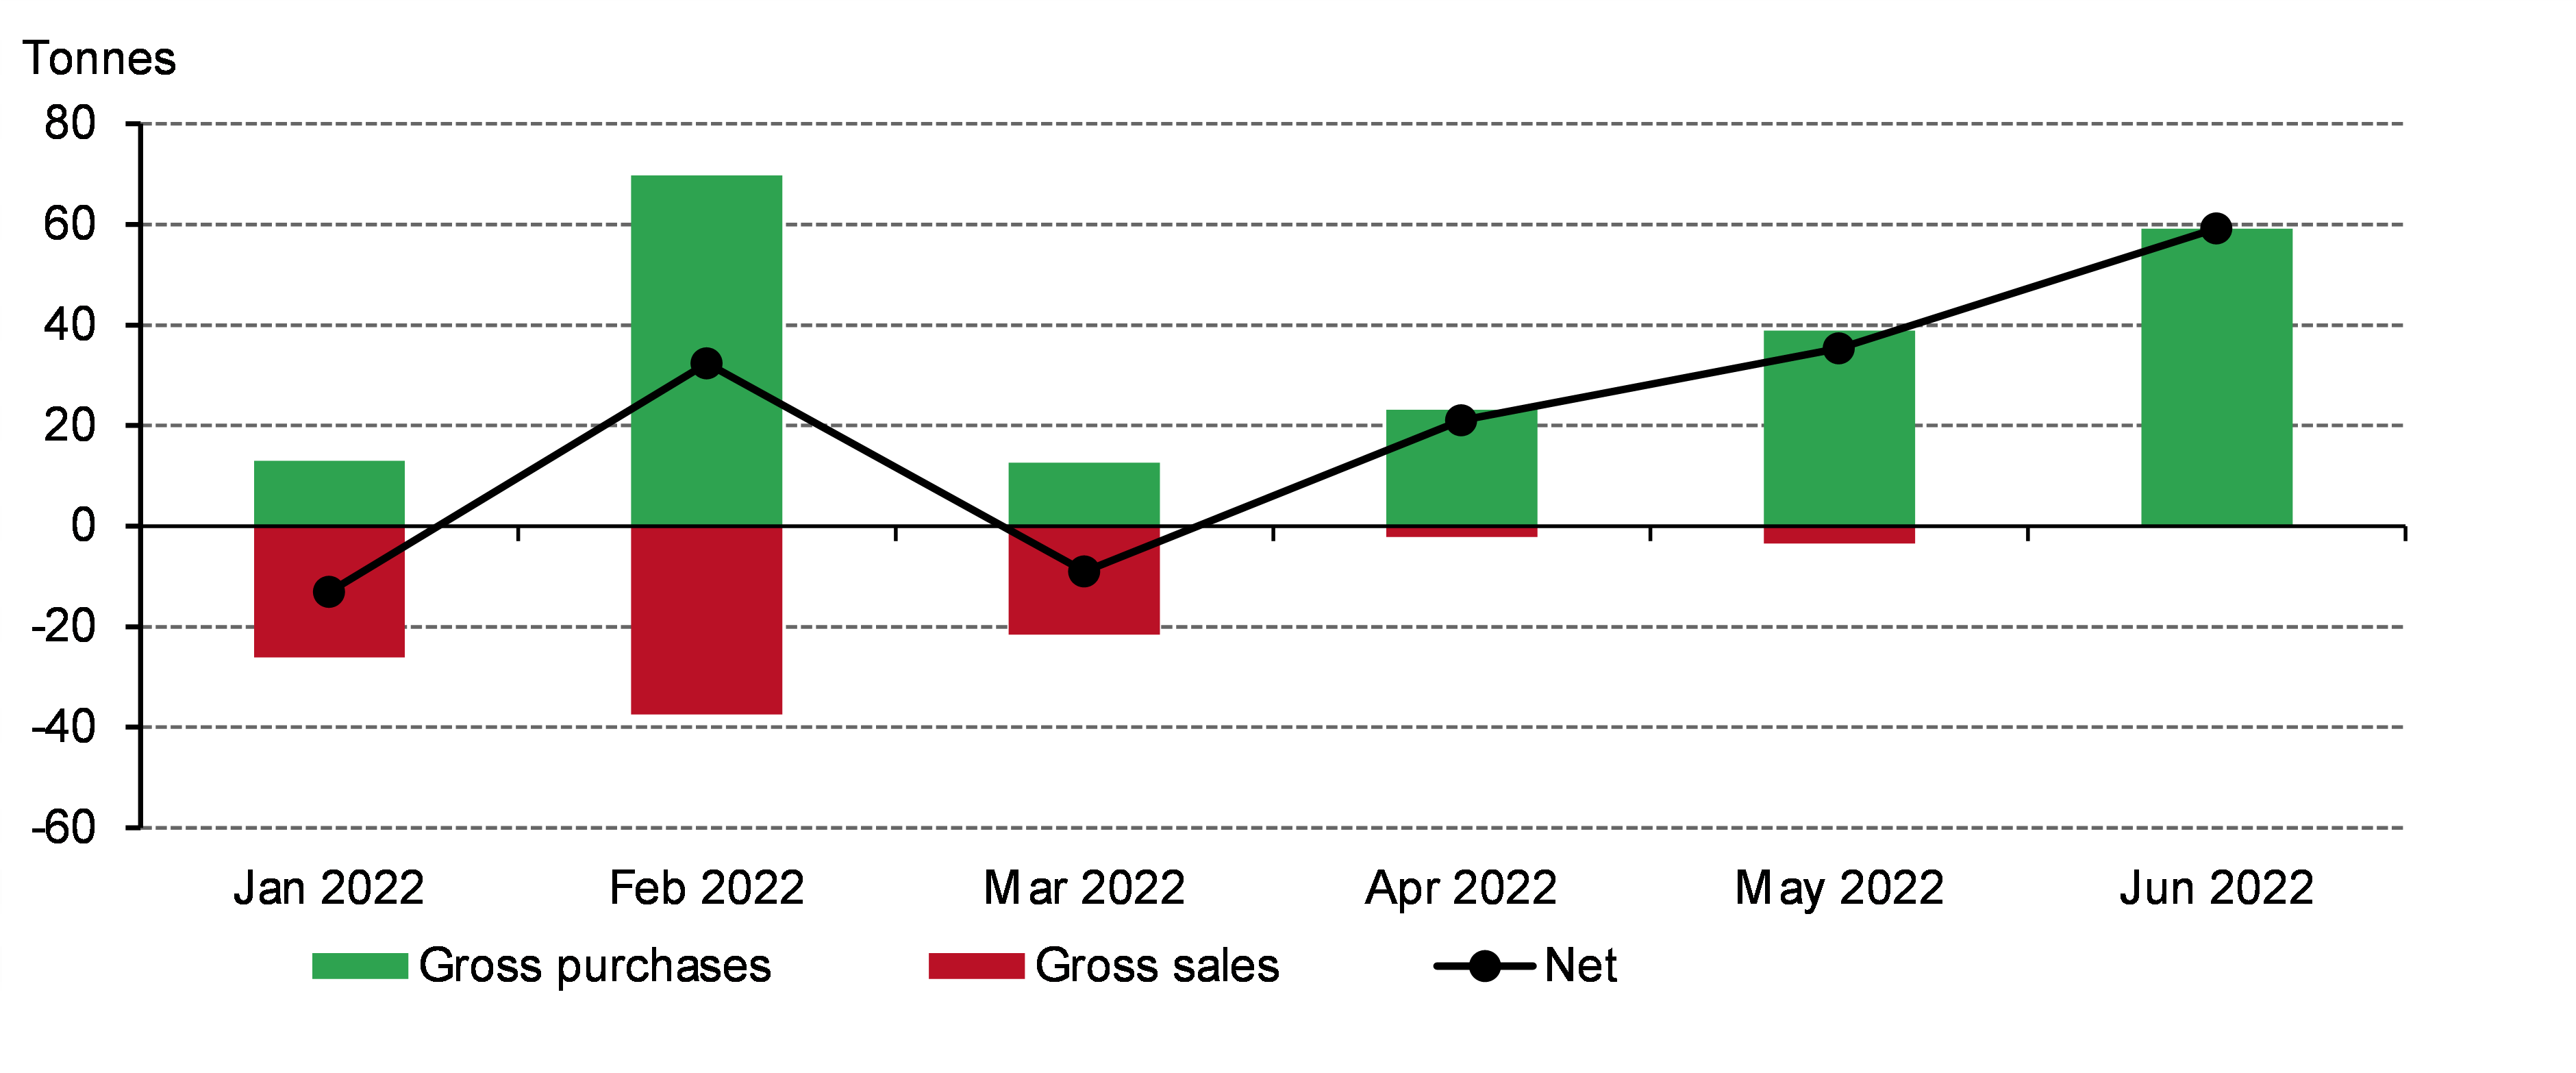
    Last week we published our updated central bank gold statistics to include data reported for June. This new information shows that central banks added a net 59t to global gold reserves during the month. And it was also the first month this year to see no reported sales, based on currently available IMF data.1  

    Central bank net purchasers rise for third consecutive month in June*

    *Data to June 2022 where available.
    Source: IMF IFS, Respective central banks, World Gold Council

    The Central Bank of Iraq was the largest purchaser in June, adding 34t to its gold reserves. This is Iraq’s first addition since September 2018 (7t) and lifts total gold reserves to 130t, 11% of total reserves. Uzbekistan (9t), Turkey (8t), Kazakhstan (4t) and India (4t), all regular buyers, were the other significant purchases during the month. 

    In all, central bank net purchases for Q2 stand at 180t, pushing the H1 total to 270t as reported in our recently published Gold Demand Trends.2  This is a continuation of the strong buying that we saw last year and we now expect full-year central bank demand for 2022 to be on a par with 2021 levels. 


    1. Our data set is based on IMF data but is supplemented with data from respective central banks where it is available and not reported through the IMF at the time of publication. This data may be revised in our next monthly update should more data become available.
    2. This figure is based on both IMF data and Metals Focus estimates  

    Latest research

    Looking for insight and analysis on gold? Our team of experts produce market-leading research and macroeconomic commentary on gold.