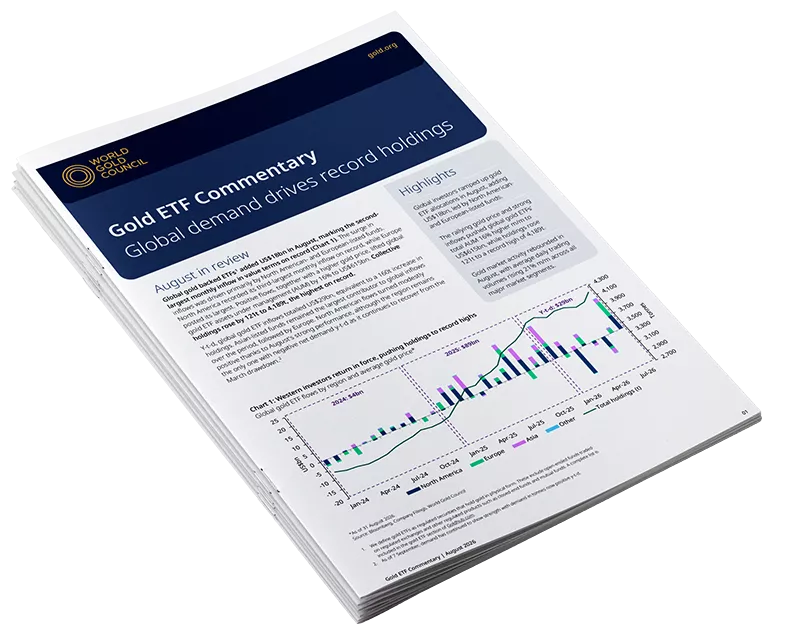
Our Gold ETF Commentary series provides monthly insights into physically backed gold ETF flows, tracking changes in holdings (tonnes) and fund flows (USD). Each report offers regional flow analysis, market context, and relevant indicators such as gold trading volumes and positioning data to help explain shifts in investor behaviour. With timely data and expert analysis, the series is a key resource for monitoring investment demand for gold.
Global demand drives record holdings
Global physically backed gold ETFs attracted US$18bn in August, marking the second-largest monthly inflow on record. Demand was driven primarily by North American- and European-listed funds, helping lift global gold ETF AUM by 16% to US$615bn while holdings rose 121t to a record 4,189t.
Europe's golden heatwave
Global physically backed gold ETFs attracted US$3bn of inflows in July, reversing two consecutive months of outflows. Demand was broad-based across all regions, led by Europe, while positive flows and a higher gold price lifted total global gold ETF AUM by 1% to US$530bn. Collective holdings rose by 23t to 4,068t.
H1 flows remain positive
Global physically backed gold ETFs recorded sizeable outflows of US$8.9bn in June, led by North America, reducing H1 net inflows to US$8bn. Despite the June setback, Asia posted its strongest H1 on record, attracting US$12bn, while North America was the only region to see outflows during H1 (-US$7.7bn).
Flows shift from flood to trickle
Global physically backed gold ETFs saw modest outflows in May, shedding US$2bn as investors remained largely sidelined. Europe was the only region to record inflows (+US$334mn), while Asia (-US$1.2bn) and North America (-US$1.1bn) led outflows. The May decline pushed global gold ETFs’ total AUM 2% lower in the month to US$604bn. Meanwhile, holdings edged down to 4,121t, remaining just below the February peak of 4,176t.
The West returns to the fold
Global physically backed gold ETFs returned to inflows in April, adding US$6.6bn. All regions contributed, led by Europe (+US$3.7bn), with Asia (+US$1.8bn) and North America (+US$1bn) also recording notable inflows. Inflows into funds listed in other regions totalled US$106mn.
Eastern inflows counterbalance Western outflows
Global physically backed gold ETFs saw a sharp reversal in March, recording record outflows of US$12bn, which halved Q1 inflows to US$12bn. Heavy selling was concentrated in North America, while European flows softened as the gold price fell mid‑month.
Digital Gold: The Case for a Shared Infrastructure
This paper proposes Gold as a Service: a shared infrastructure that would connect physical gold custody with digital issuance and product lifecycle management. By standardising core operating functions while preserving issuer competition, Gold as a Service aims to strengthen trust, reduce complexity, and enable digital gold to function as a coherent, interoperable asset class fit for a digital financial era.
Inflows supported by opposite shores
Global physically backed gold ETFs saw another solid month in February, adding US$5.3bn – cementing the strongest two‑month start on record. North America led inflows (+US$4.7bn), Asia stayed firm (+US$2.3bn), while Europe (-US$1.8bn) lagged amid early‑month redemptions linked to the late-January precious metals sell-off.
Latest research
Looking for insight and analysis on gold? Our team of experts produce market-leading research and macroeconomic commentary on gold.
