Gold ETF Flows: September 2025

West won’t rest – Q3 breaks records

Published:

Highlights

  • Global gold ETFs recorded their largest monthly inflow in September, resulting in the strongest quarter on record
  • The surging gold price and hefty inflows brought global gold ETFs' total AUM to another record high
  • Gold market trading volumes surged, averaging US$388bn per day.

Q3 in review 

Global physically backed gold ETFs1 recorded their largest monthly inflow in September, resulting in the strongest quarter on record of US$26bn (Chart 1).2 North American investors led the charge for most of the quarter; at US$16.1bn, the inflow represents the largest Q3 and second largest quarter on record. European funds also saw hefty buying and registered the region's second-strongest quarter (US$8.2bn), coming in just US$74mn shy of their record set in Q1 2020. Asia buying slowed during the quarter (US$1.7bn), while funds in other regions (US$28.2mn) were relatively flat. (Table 1).

By the end of Q3, global gold ETFs' total assets under management (AUM) reached US$472bn (+23% q/q) reaching another record high. Holdings rose 6% q/q to 3,838t, only 2% shy of the peak of 3,929t, recorded in the first week of November 2020. 

Chart 1: Western inflows go four-for-four resulting in strongest quarter on record

Regional gold ETF flows and the gold price*

*As of 30 September 2025. Gold price based on the monthly average LBMA gold price PM in USD.
Source: Bloomberg, Company Filings, ICE Benchmark Administration, World Gold Council

Regional overview

North American funds added US$10.6bn in September, the region's fourth consecutive monthly inflow. Strength in demand throughout the month and the quarter were driven by similar factors:

  • Ongoing trade, policy, and geopolitical risks continue to persist with no clear signs of abatement
  • Dollar weakness persisted and now faces further pressure from the government shutdown. However, the dollar looks oversold technically and positionally, risking a short squeeze
  • Expectations of lower yields ahead, as the Fed delivered a 25bps cut during the month, also helped.3 The market is now pricing in one to two cuts by year-end
  • With the gold price repeatedly breaking records, investor interest rose. 

Meanwhile, equities have reached new highs, and despite their recent resilience to macro data surprises, we think investors may be positioning themselves for a pullback. This has likely helped support gold demand, as investors look to add safe-haven assets. 

European funds have now logged five straight months of inflows, adding US$4.4bn in September. This was the region’s third strongest month ever in terms of gold ETF inflows. The UK, Switzerland, and Germany again led activity. We believe the strong gold price rally has been a key contributor for gold ETF demand across the region. The ECB and BoE kept rates unchanged in the month, while inflation rose, lowering real rates and increasing policy uncertainty. Flows reflected both protection and momentum as investors sought a purchasing-power hedge and leaned into the breakout. Meanwhile, continued stagflation fears in the UK could be another key factor attracting gold ETF inflows.

Asia registered positive flows of US$2.1bn in September, saving the quarter to end with inflows. China (US$622mn) and Japan (US$415mn) drove a large bulk of the region’s inflows: we believe the strong gold price performance in local currencies was a key factor. However, India led the region with inflows of US$902mn. We attribute this to favourable local currency dynamics and increased investment demand as investors look for safe havens amid weaker domestic equities and persistent geopolitical and trade risk. 

Funds in other regions recorded a modest inflow of US$175mn in September, yet their Q3 flows remained flat at US$28mn. Australia led inflows (US$182mn) in the month, but these were partially offset by South African outflows (US$65mn).

Chart 2: Global inflows on pace for record year

Annual net cumulative flows of physical gold backed ETFs*

Chart 2

*Data as of 30 September 2025.
Source: Bloomberg, Company Filings, ICE Benchmark Administration, World Gold Council


Gold ETF flows

Data as of

Demand captures changes in global/regional gold holdings; fund flows capture the net amount of money (in USD) that comes in or out of gold ETFs globally/regionally. See methodology note.

Volumes rally with gold price

Gold market trading volumes surged in September, averaging US$388bn per day – increasing 34% m/m.4 The jump in volumes occurred across all trading segments as gold prices moved higher; in fact, the gold price set 13 new ATHs during the month.5

Exchanges led the way increasing 66% m/m to an average of US$188bn/day – with trading at both COMEX (+58%) and Shanghai Futures Exchange (+84%) driving the bulk of the flows. 

OTC trading activities rose to US$191bn/day, an increase of 12% m/m and 50% higher than the 2024 average of US$128bn/day. Gold ETF trading volumes exploded, reaching US$8bn/day, increasing 84% m/m. This was primarily led by North American funds, which saw average volumes of US$6.5bn/day (+78%m/m) and accounted for 78% of physically gold-backed ETF trading volumes. 

Total net longs in COMEX gold rose 23% during the month, concluding at 806t.6 Money manager net longs rose 7% to 493t. Other net longs drove a notable share of demand, increasing 33% to 313t and reaching their highest level since 13 September 2022. 

This increase in demand was largely driven by factors similar to those we flagged earlier, such as dollar hedging, inflation concerns, geopolitical tensions, and ongoing US government risks, including the shutdown in early October.7

Against this backdrop, investors piled into the gold trade, and consecutive price increases ensued throughout the month.

Chart 3: Gold volumes surged recording their second strongest month in 2025

Average daily trading volumes by segment*

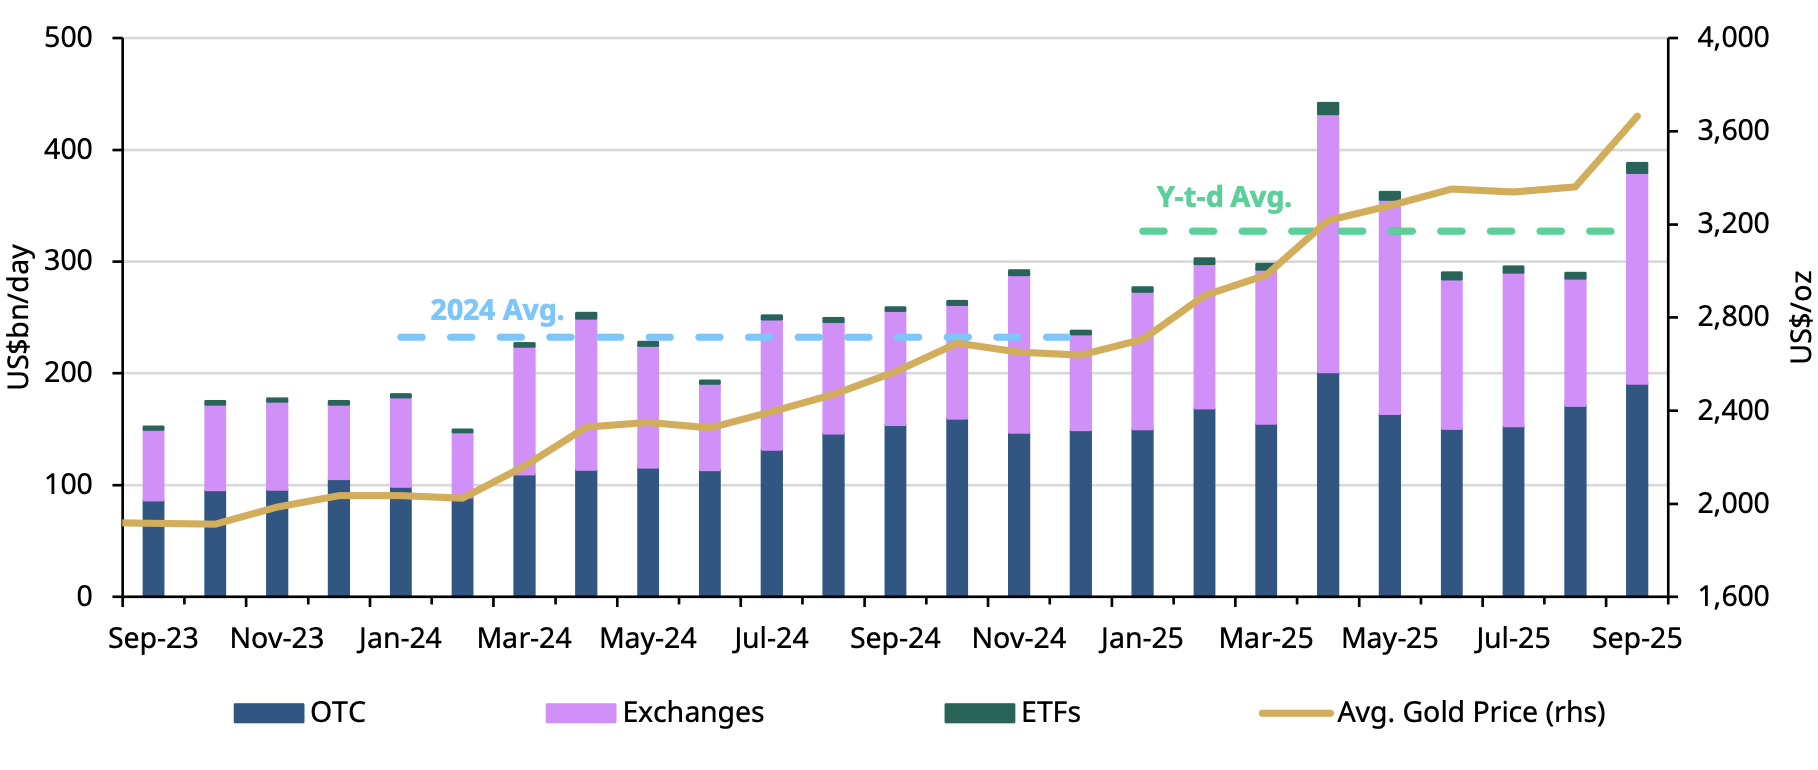
*Data as of 30 September 2025. Gold price based on the monthly average LBMA gold price PM USD. 
For more information on trading volumes please visit our Trading Volumes page on Goldhub: Gold Trading Volume | Gold Daily Volume | World Gold Council.
Source: Bloomberg, Nasdaq, COMEX, ICE Benchmark Administration, Shanghai Gold Exchange, Shanghai Futures Exchange, ETF providers, Multi Commodity Exchange of India, Dubai Gold & Commodities Exchange, Japan Exchange Group, Thailand Futures Exchange, Borsa Istanbul, Bursa Malaysia, Korea Exchange, World Gold Council

Footnotes

  1. We define gold ETFs as regulated securities that hold gold in physical form. These include open-ended funds traded on regulated exchanges and other regulated products such as closed-end funds and mutual funds. A complete list is included in the gold ETF section of Goldhub.com.

  2. We track gold ETF assets in two ways: the quantity of gold they hold, generally measured in tonnes, and the equivalent value of those holdings in US dollars (AUM). We also monitor how these fund assets change through time by looking at two key metrics: demand and fund flows. For more detail, see our ETF methodology note.

  3. Due to LBMA trading volume data availability, our full trading volume dataset dates back to 2018.

  4. ATHs are based on the LBMA PM Fix price. As of 1 October 2025, gold has reached 40 new highs this year; we have now seen 80 new ATHs since the beginning of 2024. 

  5. Based on CFTC positioning report as of 23 September 2025. 

  6. Due to the government shutdown the CFTC has delayed the release of their COT report on gold. As a result, the latest data available is as of 23 September 2025. 

Disclaimer [+]Disclaimer [-]