Gold ETF Flows: December 2025

December caps off a record year

Published:

Highlights

  • Global gold ETFs witnessed the strongest year of inflows on record in 2025, led by North America.
  • Gold ETFs’ total AUM more than doubled in 2025 and holdings also rose significantly, both reaching record highs.
  • Gold market trading volumes remained stable in December, concluding 2025 with a record of US$361bn/day.

2025 in review 

As the gold price shattered records 53 times in 2025, global investors poured unprecedented capital into physically backed gold ETFs1 (Chart 1). Annual inflows surged to US$89bn, the largest on record as the gold price delivered its strongest performance since 1979. In turn, global gold ETFs’ assets under management (AUM) doubled to an all-time high of US$559bn, with holdings reaching a historic peak of 4,025t, up from 3,224t in 2024. This was the second strongest annual demand with accumulation below prior risk periods

North American funds drove most of the global inflows in 2025. Meanwhile, Asian holdings almost doubled, while Europe saw sizable demand. Overall, global investor enthusiasm was fuelled by: 

  • Rising safe-haven demand amid escalating global trade disputes, geopolitical tensions and financial market volatility
  • Momentum buying as the surging gold price attracted attention
  • Falling opportunity costs as US Treasury yields fell and the dollar weakened.

Chart 1: Global gold ETFs saw their strongest flows on record in 2025

Regional gold ETF flows and the gold price*

*As of 31 December 2025. Gold price based on the monthly average LBMA gold price PM in USD.
Source: Bloomberg, Company Filings, ICE Benchmark Administration, World Gold Council

December in review

December marked the seventh straight month of positive global gold ETF flows.2 The US$10bn monthly inflow was dominated by North America, with Asia and Europe also registering gains (Table 1). Aided by continued strength in the gold price and consistent inflows, global gold ETFs’ AUM rose 5% in the month whilst holdings increased 2%. 

Regional overview

North America posted its seventh consecutive month of inflows, adding US$6bn in December – well above the y-t-d monthly average of US$4bn. Shifting expectations of the Fed’s monetary policy and safe-haven demand were key drivers. 

The early December Fed meeting delivered a hawkish 25bps rate cut as expected, with the dot plot indicating limited further reduction.3 But the restart of the bill-buying program, viewed as stealth easing, is expected to keep market liquidity ample, boding well for all assets. Expectations for monetary easing grew further as investors looked to the arrival, in early 2026, of a new Fed Chair who is anticipated to favour more rate cuts – a move that would support gold ETF inflows. 

Geopolitical tensions involving US relations with Venezuela and Nigeria added to safe-haven buying.4 And concerns over an AI-driven equity bubble and related volatility sustained interest in gold, an asset with low correlation to stocks.

With only two months of outflows, North American funds added US$51bn in 2025, the strongest year ever and accounting for nearly 57% of the global total. Their AUM and holdings also surged to the highest ever.

European funds continued to see inflows in December, adding US$1bn, led by the UK and Switzerland. Heightened geopolitical tensions globally and stalled progress in negotiations between Russia and Ukraine kept local investors’ safe-haven gold ETF buying elevated. And the gold price strength continued to drive investors in the region to gold ETFs. Meanwhile, currency appreciation against the dollar boosted demand for FX-hedged products, mainly in Switzerland.

Europe saw inflows of US$12bn in 2025, reversing the region’s two years of annual losses. In fact, the 2025 inflow ranks the second highest on record.

Asian inflows persisted for the fourth month, attracting US$2.5bn in December. India led the charge in December, witnessing its largest monthly inflow on record, the country has now registered positive flows eight months in a row, mainly supported by the strong gold price performance. Investors from China and Japan kept adding gold ETFs to their portfolios; persistent geopolitical tensions between the two countries and along with a higher gold price likely supported demand. In China, the VAT reform announced in November continued to drive jewellery buyers with investment motives to gold ETFs. 

2025 has been an unprecedented year for Asian gold ETFs. The US$25bn flow during the year is greater than total inflows between 2007 – when the first fund was listed in the region – and 2024. 

Funds in other regions recorded inflows of US$200mn during the month, driven primarily by strong flows into Turkey (US$155mn) and Australia (US$62mn). This pushed annual inflows to US$902mn, marking their highest level on record. 


Gold ETF flows

Data as of

Demand captures changes in global/regional gold holdings; fund flows capture the net amount of money (in USD) that comes in or out of gold ETFs globally/regionally. See methodology note.

A record year for volumes

Global gold market trading volumes averaged US$410bn/day in December, a mild m/m decline of 2% yet above the y-t-d average of US$357bn/day.5 OTC volumes rose (US$216bn, +16% m/m) on stronger LBMA trading, while a lower gold price volatility weighed on derivatives activity at key exchanges (US$185bn/day, -16%). Global gold ETF trading saw a slight increase m/m (US$9bn/day, 4%) and remained well above the 2024 average of US$2.9bn/day. While volumes in tonnage terms during the month painted a similar picture. 

Global gold market liquidity in 2025 hit a record high, averaging US$361bn/day, a 56% surge compared to 2024. All segments saw notable growth:

  • OTC activities rose 41% to US$180bn/day, on average driven by robust LBMA trading (US$161bn, +42%)
  • Exchange-traded volumes soared 71% to US$174bn/day, led by COMEX (US$114bn/day, +57%) and Shanghai Futures Exchange (US$51bn/day, +116%) posting another year of strong growth
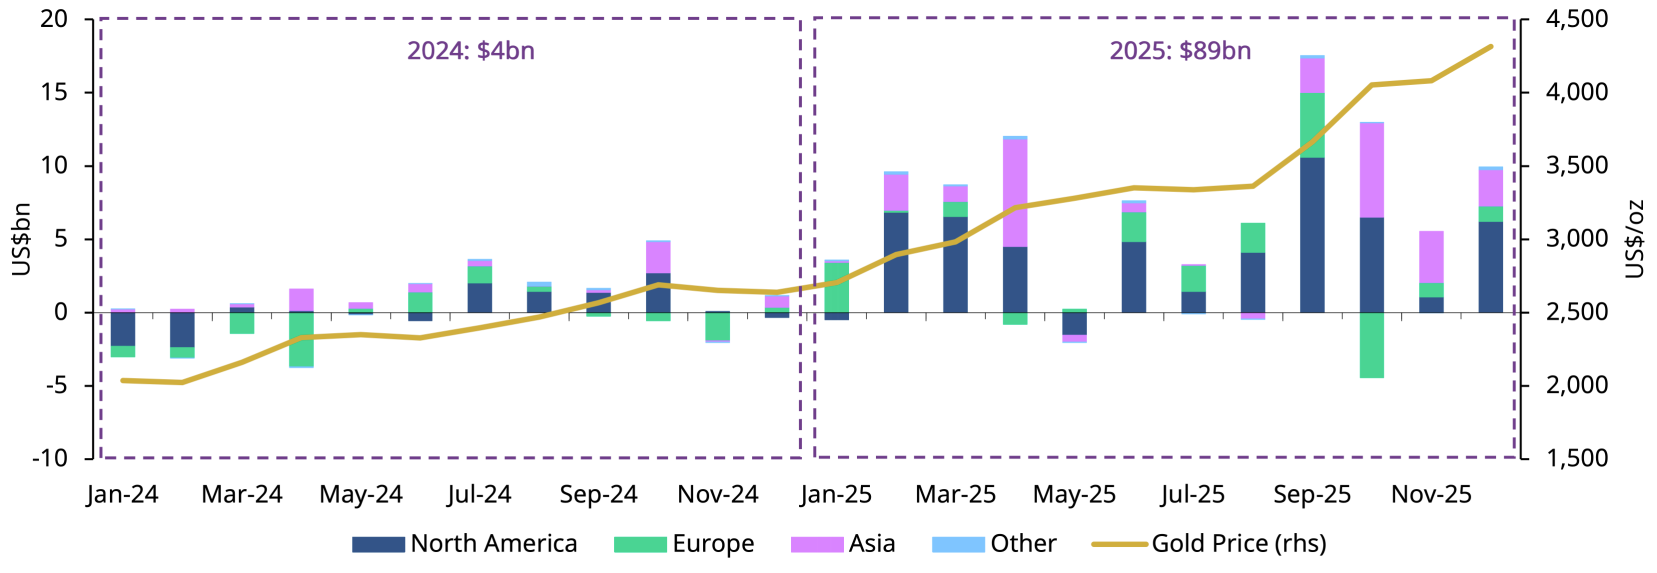
  • Global gold ETF liquidity more than doubled to US$7bn/day, led by North America (US$5bn, +138%). 

In tonnage terms, global gold trading volumes averaged 3,247t/day in 2025, up 8% y/y and marking a record year. Despite a minimal 1% decline in OTC activity, other markets experienced robust growth. 

Total COMEX net longs rose 15% during the month, closing out the year at 683t.6 Money manager net longs rose 18% to 395t, and Other net longs increased by 11% to 288t. This was largely driven by the strong surge in precious metal prices in December. Along with the usual drivers that dominated 2025 such as ongoing geopolitical risks7 and US dollar weakness. 

Despite a significant rise in the gold price, money manager net longs were 30% lower than their end-2024 level, potentially highlighting room for further growth. 

Chart 2: Gold volumes remained elevated into year-end

Average daily trading volumes by segment*
 

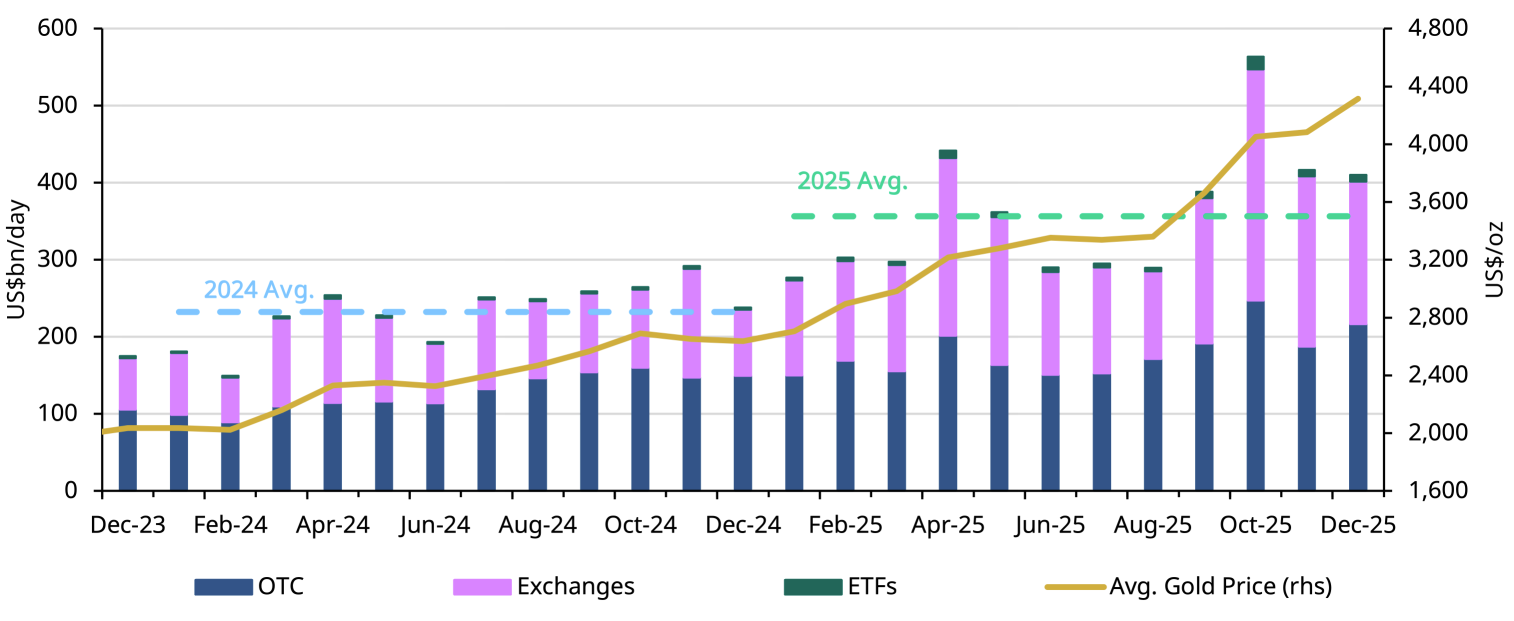
*Data as of 31 December 2025. Gold price based on the monthly average LBMA gold price PM USD. 
For more information on trading volumes please visit our Trading Volumes page on Goldhub: Gold Trading Volume | Gold Daily Volume | World Gold Council.
Source: Bloomberg, Nasdaq, COMEX, ICE Benchmark Administration, Shanghai Gold Exchange, Shanghai Futures Exchange, ETF providers, Multi Commodity Exchange of India, Dubai Gold & Commodities Exchange, Japan Exchange Group, Thailand Futures Exchange, Borsa Istanbul, Bursa Malaysia, Korea Exchange, World Gold Council

Footnotes

  1. We define gold ETFs as regulated securities that hold gold in physical form. These include open-ended funds traded on regulated exchanges and other regulated products such as closed-end funds and mutual funds. A complete list is included in the gold ETF section of Goldhub.com.

  2. We track gold ETF assets in two ways: the quantity of gold they hold, generally measured in tonnes, and the equivalent value of those holdings in US dollars (AUM). We also monitor how these fund assets change through time by looking at two key metrics: demand and fund flows. For more detail, see our ETF methodology note.

  3. Due to LBMA trading volume data availability, our full trading volume dataset dates back to 2019.

  4. Based on CFTC positioning report as of 30 December 2025. 

Disclaimer [+]Disclaimer [-]