Volumes reached record levels in H1
Gold market trading volumes averaged US$329bn/day during the first half, the highest semi-annual value on our record.8 But June saw a decline in volumes (-20% m/m), likely impacted by a short-term equity market rally and fading momentum for gold.
OTC in H1 increased to US$165bn/day; well above its 2024 average of US$128bn/day. Exchange-traded volumes also saw a sizeable increase through the first half of the year, averaging US$159bn/day, driven by increased activity on COMEX and the Shanghai Futures Exchange. Meanwhile, trading volumes of global gold ETFs continued to gain strength in H1, particularly from North America and Asia, which averaged US$4.3bn/day and US$0.9bn/day, respectively.
H1 volumes well above 2024 average
Average daily trading volumes by segment in US$bn*
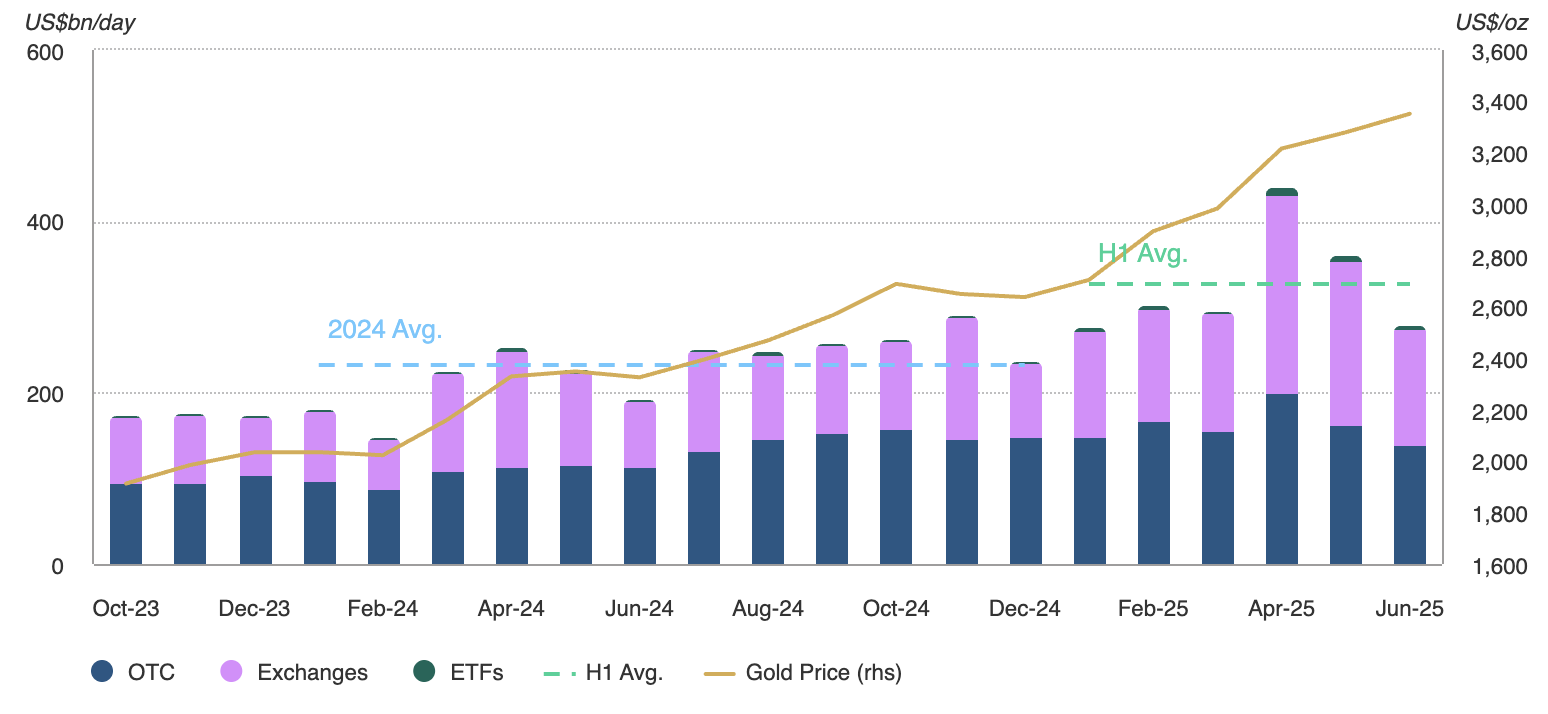
*Data as of 30 June 2025. Gold price based on the monthly average LBMA gold price PM USD.
For more information on trading volumes please visit our Trading Volumes page on Goldhub: Gold Trading Volume | Gold Daily Volume | World Gold Council.
Source: Bloomberg, Nasdaq, COMEX, ICE Benchmark Administration, Shanghai Gold Exchange, Shanghai Futures Exchange, ETF providers, Multi Commodity Exchange of India, Dubai Gold & Commodities Exchange, Japan Exchange Group, Thailand Futures Exchange, Borsa Istanbul, Bursa Malaysia, Korea Exchange, World Gold Council
Total net longs in COMEX gold futures fell 23% to 586t in H1 but notably rebounded 6.5% m/m in June.9
Money managers reduced their long positions by 28% over the first six months. But it is worth noting that during June we saw positions increase by 11% m/m, to 406t. This was likely supported by consolidation in the gold price, providing investors with a window of opportunity to begin rebuilding positions.
