Gold ETF Flows: January 2026

Flows surge despite price pullback

Published:

Highlights

  • Global gold ETFs continued to attract inflows in the new year, pushing both their total AUM and collective holdings to all-time highs.
  • Investors from North America and Asia bought the most whilst European funds also saw notable growth.
  • Gold market trading volumes surged in January, concluding the month with a record of US$623bn/day.

January in review

Global investors continued to build allocations to physically-backed gold ETFs1 in the new year (Chart 1). In January, gold ETFs attracted US$19bn – the strongest month on record. January’s net buying, combined with a 14% surge in the gold price, pushed global gold ETF assets under management (AUM) to a new record of US$669bn, a 20% increase on the month. Collective global holdings rose by 120t to 4,145t, also reaching a new all‑time high.

All regions recorded inflows during January. North America and Asia drove global demand, with the former posting its second‑highest monthly inflow on record and the latter achieving its largest. Europe also saw notable inflows amid heightened geopolitical and trade tensions, while other regions extended their positive momentum for a second month.

Even with the recent price decline, all regions except Europe saw net inflows on both 30 January and 2 February, as investors appeared to take advantage of the dip to add exposure to gold.

Chart 1: Global gold ETFs see momentum carry over into the new year

Regional gold ETF flows and the gold price*

Chart 1: Global gold ETFs see momentum carry over into the new year

*As of 31 January 2026. Gold price based on the monthly average LBMA gold price PM in USD.
Source: Bloomberg, Company Filings, ICE Benchmark Administration, World Gold Council

Regional overview

North America carried its strong momentum into the new year – adding US$7bn in January – and has now reported eight consecutive months of inflows.

Gold experienced a sharp pullback into month-end, following the nomination of Kevin Warsh as the new Fed Chair.2 Prices had become stretched through January, making a correction increasingly likely. Despite the drawdown and heightened volatility, the region still reported net positive flows on the final trading day of the month.

During the month, inflows benefited from both the price rally and rising geopolitical tensions involving the US and regions such as Iran, Greenland, and parts of Europe, which helped sustain investor interest in gold.3

Although the Fed kept rates unchanged and highlighted expanding economic activity alongside a cautious stance on future rate decisions, questions around central bank independence linger. Markets remain focused on whether Kevin Warsh – should he be appointed – would align more closely with President Trump’s preferences, while the Justice Department’s subpoena of Chair Powell adds further uncertainty. This overhang on the future path of monetary policy, combined with investor expectations of eventual rate cuts, continues to support gold ETF demand.

European inflows have now persisted for three months in a row, adding US$2bn in January. Strong gold price performance and escalating geopolitical and trade frictions between the US and Europe – particularly President Trump’s tariff threats linked to the Greenland dispute – supported continued interest in gold ETFs as investors sought safety amid rising uncertainty.

The region had to contend with broader market volatility stemming from EU preparations for retaliatory tariffs4  and pressure on export‑heavy economies, reinforcing demand for defensive assets such as gold.

In the UK, which led regional inflows, persistently elevated inflation5 and renewed political tensions further fuelled investor appetite for gold ETFs as a hedge against both domestic and external risks. 

Asian funds reported US$10bn in January, a pace well above their 2025 average and the fifth consecutive monthly inflow – their strongest month on record. The region accounted for 51% of net global inflows, an especially notable achievement given that Asian holdings are only about one-fifth the size of North America’s. 

China once again led the region’s inflows (US$6bn), ranking as the second-largest source of inflows globally, closely behind the US. Robust gold prices, lingering geopolitical uncertainty, and strong institutional demand all underpinned the country’s continued appetite for gold ETFs.

India also delivered sizeable inflows of US$2.5bn, supported by continued momentum in gold prices and a rotation toward diversification as domestic equities underperformed.

Funds in other regions registered positive flows at the start of 2026, adding US$295mn. This marked the region’s second consecutive month of inflows, driven primarily by contributions from Australia and supported by incremental inflows from South Africa.


Gold ETF flows

Data as of

Demand captures changes in global/regional gold holdings; fund flows capture the net amount of money (in USD) that comes in or out of gold ETFs globally/regionally. See methodology note.

Volumes spike with volatility

Global gold market trading volumes6 surged to an average of US$623bn/day in January, marking a 52% m/m increase and standing 72% above the 2025 average.7 This rise occurred predominately in the final week of the month, when heightened volatility pushed activity to an average of US$963bn/day (Chart 2). 

Over-the-counter (OTC) activity strengthened, with volumes rising to US$280bn/day (+29% m/m) on the back of increased LBMA trading. Meanwhile, elevated price volatility supported a sharp pick-up in derivatives trading across major exchanges, where volumes climbed to US$320bn/day (+73% m/m). Trading in global gold ETFs also rose meaningfully to US$23bn/day (+160% m/m), driven largely by a near 200% increase in North American ETF activity, partly due to options expiry and month‑end volatility.

Volume in tonnage terms moved in tandem, averaging 3,998t/day in January, up 35% m/m and well above the 2025 average of 3,247t/day. This represents the strongest month of trading activity since October of last year.

Positioning data showed a moderation: total COMEX net longs fell 6% during the month to 642t.8 This decline, however, does not capture the final days of elevated volatility. Money manager net longs slipped 4% to 378t, while Other net longs declined 8% to 264t, likely reflecting profit‑taking after steady net‑long buildup earlier in the month.

Chart 2: Gold volumes record strongest month on record in January

Average daily trading volumes by segment*
 Chart 2: Gold volumes record strongest month on record in January

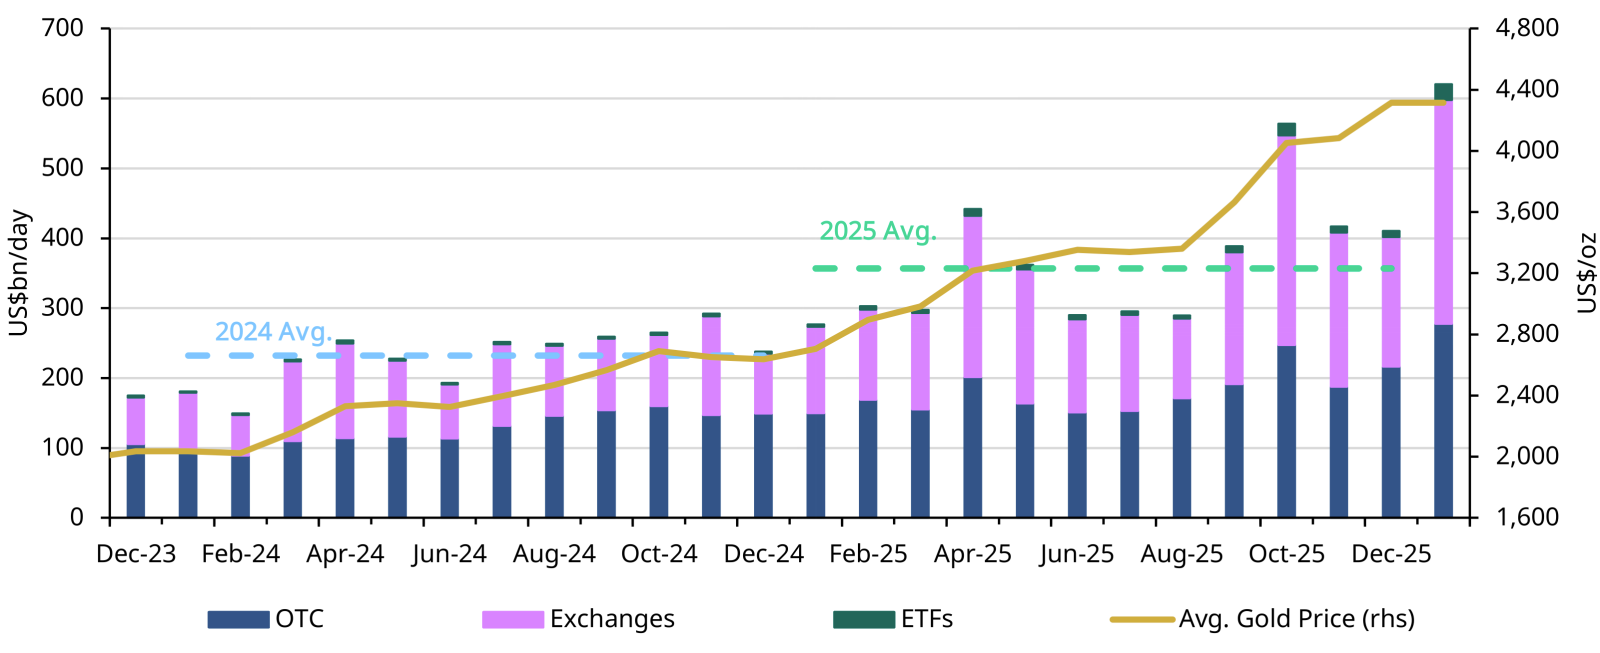
*Data as of 31 January 2026. Gold price based on the monthly average LBMA gold price PM USD. 
For more information on trading volumes please visit our Trading Volumes page on Goldhub: Gold Trading Volume | Gold Daily Volume | World Gold Council.
Source: Bloomberg, Nasdaq, COMEX, ICE Benchmark Administration, Shanghai Gold Exchange, Shanghai Futures Exchange, ETF providers, Multi Commodity Exchange of India, Dubai Gold & Commodities Exchange, Japan Exchange Group, Thailand Futures Exchange, Borsa Istanbul, Bursa Malaysia, Korea Exchange, World Gold Council

Footnotes

  1. We define gold ETFs as regulated securities that hold gold in physical form. These include open-ended funds traded on regulated exchanges and other regulated products such as closed-end funds and mutual funds. A complete list is included in the gold ETF section of Goldhub.com.

  2. Due to LBMA trading volume data availability, our full trading volume dataset dates back to 2019.

  3. 2025 Avg. daily trading volume was US$361bn.

  4. Based on CFTC positioning report as of 27 January 2026. 

Disclaimer [+]Disclaimer [-]