Gold ETF Flows: November 2025

Asia takes the helm

Published:

Highlights

  • Global gold ETFs recorded inflows six months in a row, led by Asia
  • Gold ETFs’ total AUM continued to rocket, reaching another month-end peak, and holdings also climbed to the highest month-end level in history
  • Gold market trading volumes pulled back, falling 26% m/m to US417$bn/day.

November in Review

Global physically backed gold ETFs1 registered their sixth consecutive monthly inflow, adding US$5.2bn in November (Chart 1).2 Although flows narrowed compared to previous months, they sit well above the 2024 monthly average of US$292mn. Total assets under management (AUM) reached US$530bn, up 5.4% in the month and marking another month-end peak, thanks to continued inflows and a stronger gold price. Holdings rose by 1% to 3,932t, also the highest month-end value ever. Notably, global gold ETF inflows remain on track for their strongest year ever.

November’s trend was mainly driven by Asia, where investors continued to buy gold ETFs at pace. North American inflows slowed significantly from October, while European demand flipped positive (Table 1).

Chart 1: Asia dominated global gold ETF inflows in November

Regional gold ETF flows and the gold price*
 

Chart 1

*As of 30 November 2025. Gold price based on the monthly average LBMA gold price PM in USD.
Source: Bloomberg, Company Filings, ICE Benchmark Administration, World Gold Council 

Regional overview

North America’s inflow streak extended to six months, adding US$1bn in November. Flows were relatively subdued compared to the record buying of previous months, reflecting the offsetting forces that have shaped gold ETF investor sentiment. The following factors, among others, have supported gold ETF buying in the region:

  • The upward trending gold price, which ended the month with a 4.5% gain
  • Towards the end of the month, investor expectations of a Fed cut intensified, as softer inflation indicators provided reassurance
  • Geopolitical risks resurged amid rising US-Venezuela tension.

Inflows were partially offset by outflows, influenced by:

  • Cooling investor expectation – during most of November – of a December Fed cut amid resilient economic data and hawkish Fed minutes
  • Lowering geopolitical tensions earlier in the month due to progress toward peace in Ukraine.

And with swings in the equity market, local investors may have sought to cover losses in other areas by selling gold ETFs and benefiting from their vast liquidity and strong y-t-d performance, also limiting the month’s inflows.

European flows flipped from negative to positive at US$978mn in November. Equity weakness and gold price strength, in local currencies, contributed to the shift, with the UK and Germany leading inflows in the region. In the UK, fiscal plans in the Autumn Budget, announced around the end of November, are expected to ease the country’s inflationary pressure and potentially hit growth, raising investor expectations of further cuts from Bank of England and also supporting local interest in gold.3  

Asian funds attracted US$3.2bn in November, marking the region’s third consecutive monthly inflow. Once again Chinese investors led the region, adding US$2.2bn. Equity market weakness, a rebounding gold price and geopolitical tensions encouraged gold ETF investment in China and Japan. China’s newly announced VAT reform may have further boosted flows as jewellery buyers with investment motives turned to gold ETFs in order to avoid the additional tax. India has now seen inflows for six months in a row, supported by the attractive local gold price performance. It is also worth mentioning that, while not yet entirely captured in our dataset, South Korea has shown strong interest in gold as local investors seek hedges against the volatile stock market.4

Funds in other regions saw a mild loss of US$38mn last month as Australian inflows (+US$12mn) were unable to offset outflows from South Africa (-US$53mn). 


Gold ETF flows

Data as of

Demand captures changes in global/regional gold holdings; fund flows capture the net amount of money (in USD) that comes in or out of gold ETFs globally/regionally. See methodology note.

Volumes stayed elevated

Gold market trading volumes pulled back, averaging US$417bn in November, down 26% compared to the record level set in October.5  Nonetheless, global gold volumes remain well above their 2024 average of US$232bn/day. With gold price volatility decreasing in the month, all sectors saw slower activity. 

OTC trading was lower by 24% m/m to US$188bn/day, primarily on reduced LBMA volumes (US$169bn/day, -25%). And exchange-traded volumes fell 26% to US$221bn/day, likely impacted by reduced gold price volatility in the month. Meanwhile, global gold ETF trading activity plunged 50% m/m, reaching US$8.4bn/day – yet still well above the 2024 average of US$2.9bn/day. 

In tonnage terms, global gold market liquidity averaged 3,167t/day in November (-26% m/m) – 6% higher than the 2024 average. All segments of the gold market experienced cooler trading activity in the month: LBMA OTC (-25%, 1,287t/day) and COMEX (-24%, 1,129t/day) drove declines in OTC markets and exchanges. Global gold ETF trading also cooled notably, down 50% to 63t.

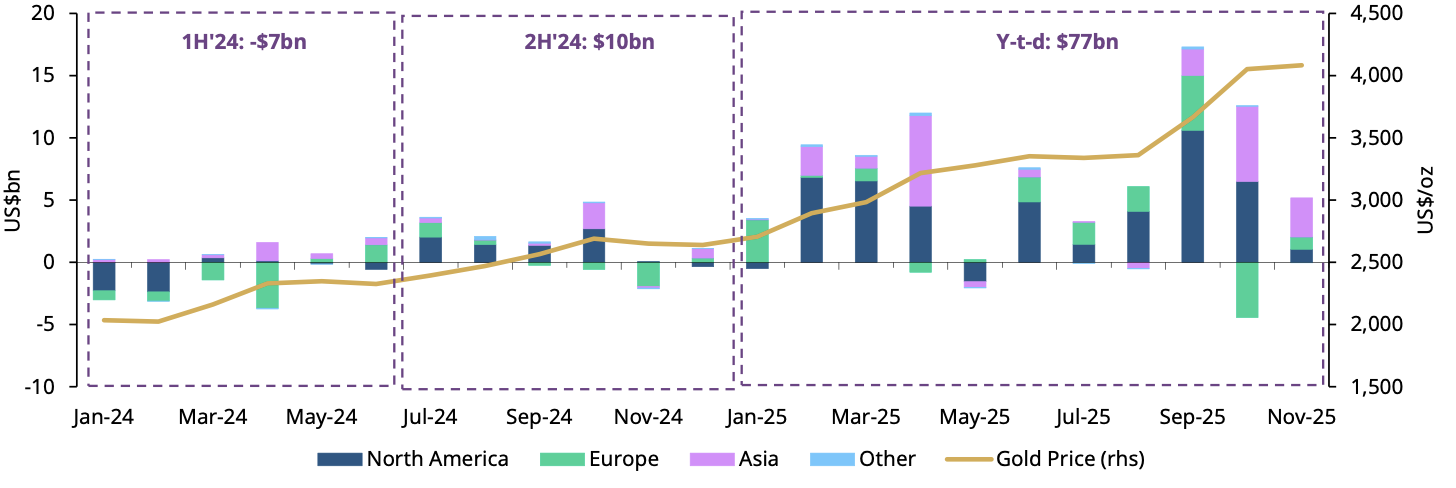
COMEX money manager net longs continued to experience data release delays, showing declines as of 14 October – the latest available. Their open interest trended up and down, concluding November at US$179bn, almost unchanged from the end-October level.6  

Chart 2: Gold volumes declined m/m yet stayed elevated

Average daily trading volumes by segment*
 

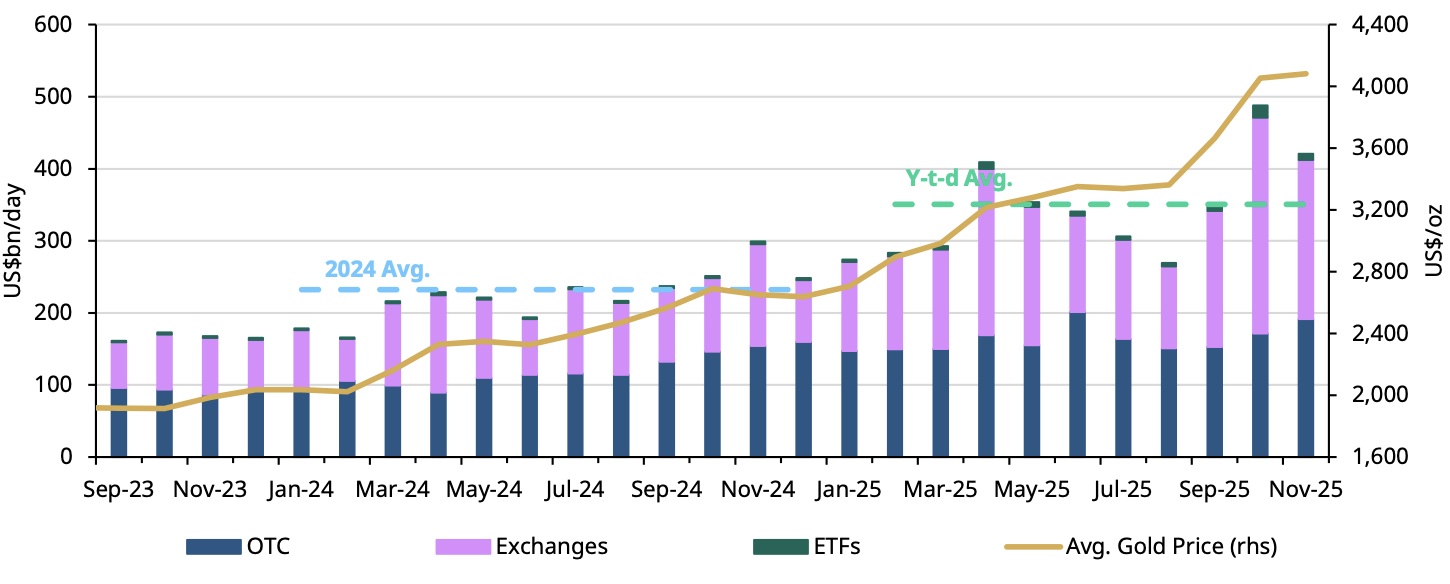
*Data as of 30 November 2025. Gold price based on the monthly average LBMA gold price PM USD. 
For more information on trading volumes please visit our Trading Volumes page on Goldhub: Gold Trading Volume | Gold Daily Volume | World Gold Council.
Source: Bloomberg, Nasdaq, COMEX, ICE Benchmark Administration, Shanghai Gold Exchange, Shanghai Futures Exchange, ETF providers, Multi Commodity Exchange of India, Dubai Gold & Commodities Exchange, Japan Exchange Group, Thailand Futures Exchange, Borsa Istanbul, Bursa Malaysia, Korea Exchange, World Gold Council

Footnotes

  1. We define gold ETFs as regulated securities that hold gold in physical form. These include open-ended funds traded on regulated exchanges and other regulated products such as closed-end funds and mutual funds. A complete list is included in the gold ETF section of Goldhub.com.

  2. We track gold ETF assets in two ways: the quantity of gold they hold, generally measured in tonnes, and the equivalent value of those holdings in US dollars (AUM). We also monitor how these fund assets change through time by looking at two key metrics: demand and fund flows. For more detail, see our ETF methodology note.

  3. See: Budget 2025 (HTML) - GOV.UK, 28 November 2025. 

  4. See: Koreans go heavy on gold ETFs, 21 November 2025.

  5. Due to LBMA trading volume data availability, our full trading volume dataset dates back to 2019.

Disclaimer [+]Disclaimer [-]