Gold ETF Flows: July 2025

US and Europe anchor July inflows

Published:

Highlights

  • Global gold ETFs continued to see inflows in July, dominated by North America and Europe 
  • Sustained inflows and a higher gold price pushed global gold ETFs’ AUM to another month-end high 
  • Global gold market trading volumes rose to US$297bn/day in July. 

July in review

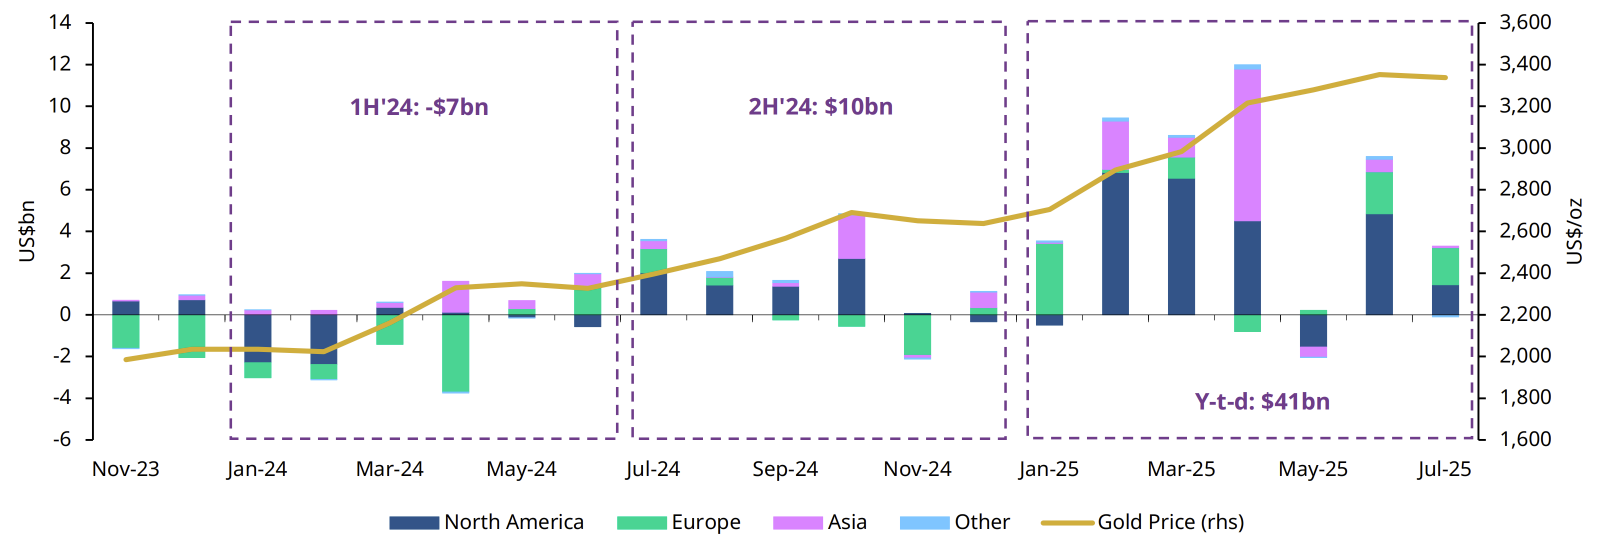
Global physically backed gold ETFs1 saw further inflows in July, adding US$3.2bn (Chart 1).2 July inflows came mainly from Western funds, divided almost equally between North America and Europe. Asia saw slight inflows while other regions experienced mild outflows. It is worth noting, global inflows are currently on pace for their second strongest year on record (Chart 2).

Boosted by continued inflows and a higher gold price, global gold ETFs’ total assets under management (AUM) rose further by 1% to US$386bn, another month-end high. Collective holdings increased by 23t to 3,639t, remaining the highest month-end total since August 2022.

Chart 1: Western inflows led the charge in July

Regional gold ETF flows and the gold price*

*As of 31 July 2025. Gold price based on the monthly average LBMA gold price PM in USD.
Source: Bloomberg, Company Filings, ICE Benchmark Administration, World Gold Council


Regional overview

North America attracted US$1.4bn in July, bringing y-t-d inflows to US$22bn, on pace for its second-strongest annual performance.3 While flows remained positive, they did slow m/m. We attribute this to a short-term rebound in the dollar and a rise in rates, as expectations for future Fed cuts continue to be pushed further out. 

Some investors likely took profits and rotated into equities, especially as recent trade announcements from Japan and the EU lifted risk appetite. However, we’re also seeing speculative stocks gain traction,4 which could point to frothy conditions remerging. Still, the trajectory of US-China trade negotiations will likely remain one of the dominant drivers of future market sentiment. 

Continued inflows into gold-backed ETFs are likely to be supported as signs that tariff effects trickle through more meaningfully to growth and/or inflation.

European funds saw their third consecutive monthly inflow in July, attracting US$1.8bn. The UK once again dominated inflows while German funds lost the most. Gold’s outsized strength in British pounds (GBP) attracted local investors: weaker-than-expected economic data and the cooling labour market, among other factors, kept the local currency on a back foot and contributed to rising safe-haven demand. Switzerland and France also witnessed notable inflows in the month. Further supporting investor interest in safe-haven assets such as gold ETFs were US tariff uncertainty – before a trade deal was reached on 27 July – and growth concerns in the region. This was reflected in a pick-up in physical bar and coin demand, which saw the regional demand more than double y/y to 28t in Q2.5

Meanwhile in Germany, Bund yields kept rising, driven mainly by the country’s surging spending plans, which are pushing up borrowing, and expectations that the ECB may become less dovish.6 Such factors have increased local investors’ opportunity cost of holding gold, contributing to the region’s July loss. 

Asian funds saw a mild increase of US$93mn in July, led by Japan. China saw outflows amid local investors’ improving risk appetite – the CSI300 stock index saw its strongest month since last September as the country’s Q2 growth exceeded expectations. In contrast, Japan (US$215mn) and India (US$156mn) continued to record inflows. And funds in other regions registered modest outflows of US$95mn in July.

Chart 2: Global flows on pace for second strongest year on record 

Annual net cumulative flows broken down by month*

*As of 31 July 2025. Gold price based on the monthly average LBMA gold price PM USD. Years shown range from Jan 2006 through July 2025.
Source: Bloomberg, Company Filings, ICE Benchmark Administration, World Gold Council


Gold ETF flows

Data as of

Demand captures changes in global/regional gold holdings; fund flows capture the net amount of money (in USD) that comes in or out of gold ETFs globally/regionally. See methodology note.

Volumes edged higher

In July, gold market trading volumes reached US$297bn/day on average, 2.3% higher m/m.7 OTC activities averaged US$154bn/day in July, 2% higher than June. Although July OTC volumes were below the H1 average of US$165bn/day, they remained well above the 2024 average of US$128bn/day. Exchange-traded volumes also rose, averaging US$137bn per day, led by a notable increase in COMEX activities. But global gold ETFs’ trading activities fell 15% m/m to US$4.9bn/day yet far exceeding the 2024 average of US$2.9bn per day. 

Total net longs in COMEX gold futures rose 12% m/m to 676t in July, with Money Managers increasing their net long positions by 4%. 8

While there has been evidence of some profit-taking in prior months, positioning now appears to have reset – giving futures investors room to rebuild exposure. We explore this shift in greater detail in our latest monthly Gold Market Commentary.
Footnotes

  1. We define gold ETFs as regulated securities that hold gold in physical form. These include open-ended funds traded on regulated exchanges and other regulated products such as closed-end funds and mutual funds. A complete list is included in the gold ETF section of Goldhub.com.

  2. We track gold ETF assets in two ways: the quantity of gold they hold, generally measured in tonnes, and the equivalent value of those holdings in US dollars (AUM). We also monitor how these fund assets change through time by looking at two key metrics: demand and fund flows. For more detail, see our ETF methodology note.

  3. For more colour on NA ETF demand, please see our recent Q2 US GDT report

  4. For more colour on physical bar and coin investment please see our recent Q2 Gold Demand Trends or visit our data page on GoldHub for historical demand and supply.

  5. Due to LBMA trading volume data availability, our full trading volume dataset dates back to 2018.

  6. Based on CFTC positioning report as of 22 July 2025.

Disclaimer [+]Disclaimer [-]