Volumes remain stable
Gold market trading volumes remained broadly unchanged, averaging US$290bn per day – just 2% lower m/m.5 The minor decline was led by a 17% m/m drop in exchange-traded volumes – trading at both COMEX and Shanghai Futures Exchange cooled. Despite this, the average volume of US$114bn/day has remained above its 2024 level of US$102bn/day. Gold ETF trading volumes were also down across all regions, decreasing 9% m/m to US$4.5bn/day. But OTC trading activities rose, reaching US$171bn/day on average in the month, 12% higher than July and well above the 2024 average of US$128bn/day.
Total net longs in COMEX gold futures fell 3.4% during the month, concluding August at 652t,6 while money manager net longs rose 3.7% to 461t. Money managers’ bullish bets rose steeply in early August around the news of US tariffs on Swiss bullion, leading to a surge in the COMEX gold price. Consecutive price rises towards the end of the month also saw gold futures traders build up their longs.
Chart 3: Gold volumes hold steady in August
Average daily trading volumes by segment in US$bn*
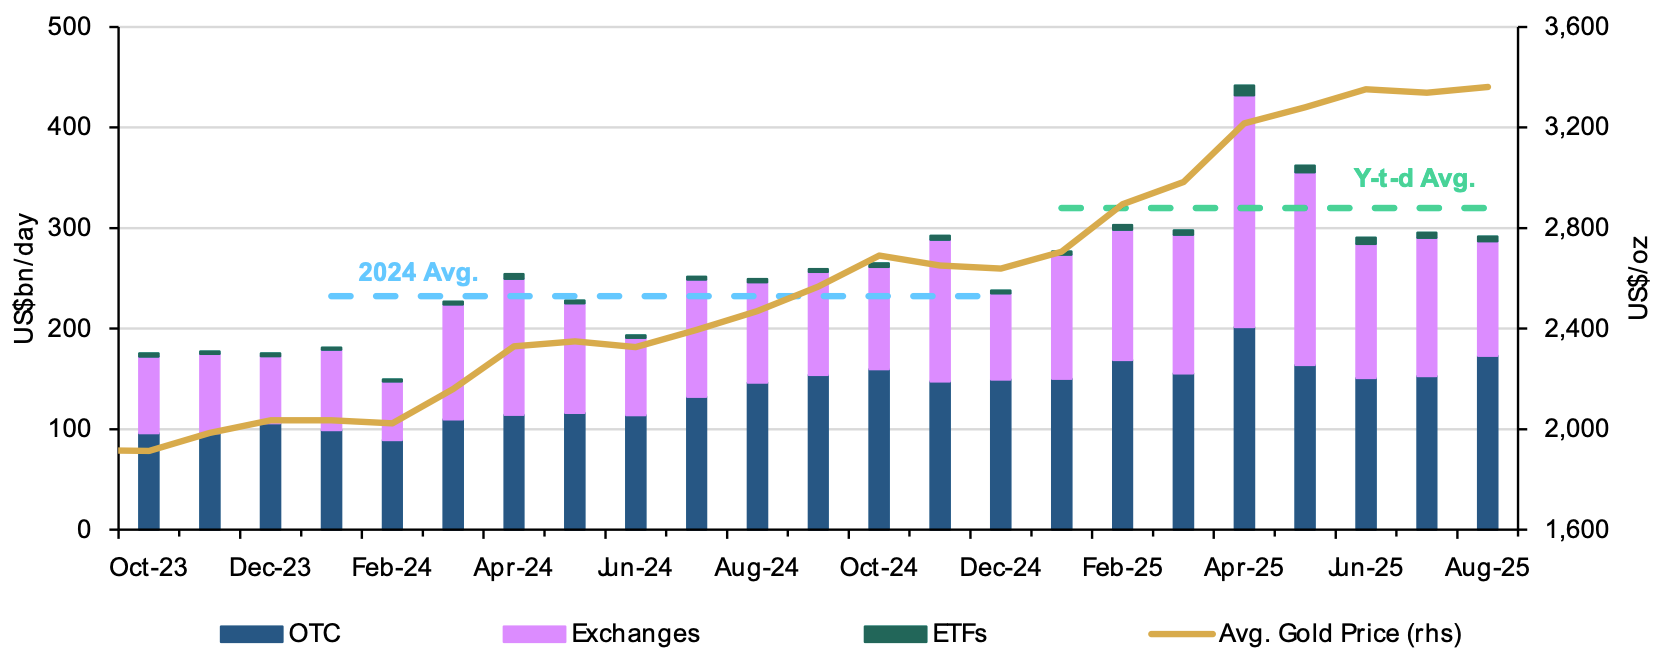
*Data as of 31 August 2025. Gold price based on the monthly average LBMA gold price PM USD.
For more information on trading volumes please visit our Trading Volumes page on Goldhub: Gold Trading Volume | Gold Daily Volume | World Gold Council.
Source: Bloomberg, Nasdaq, COMEX, ICE Benchmark Administration, Shanghai Gold Exchange, Shanghai Futures Exchange, ETF providers, Multi Commodity Exchange of India, Dubai Gold & Commodities Exchange, Japan Exchange Group, Thailand Futures Exchange, Borsa Istanbul, Bursa Malaysia, Korea Exchange, World Gold Council
