Gold market activity rose
Global gold market trading volumes7 rebounded in March, averaging US$525bn, 11% higher m/m. Despite the sharp price pullback during the month, liquidity remained ample across all market segments. Over‑the‑counter (OTC) trading activity rose 13% to US$272bn per day, well above the 2025 average of US$180bn. Exchange volumes also increased, up 10% to US$238bn per day, with activity rising on COMEX while volumes on the Shanghai Futures Exchange moderated. Meanwhile, despite a 10% m/m decline, global gold ETF liquidity remained robust at US$15bn per day, more than double the 2025 average.
In tonnage terms, trading activity painted a similar picture. OTC volumes rose 17% to 1,749t, while trading in exchanges increased 14% to 1,530t per day. Global gold ETF trading volumes recorded a 13% m/m decline, but overall market liquidity remained deep and resilient.
Positioning data showed a modest reduction in total COMEX net longs, which fell 1% over the month to 500t.8 Intra-month managed money positions declined sharply, shedding 40t during the third week of March, coinciding with the steep price correction. At the same time, non‑reportable positions, often associated with retail activity, also contributed to the sell‑off, recording a cumulative net reduction of 18t over the first three weeks of the month.
Chart 2: Gold volumes rebound in March amid gold’s price correction
Average daily trading volumes by segment*
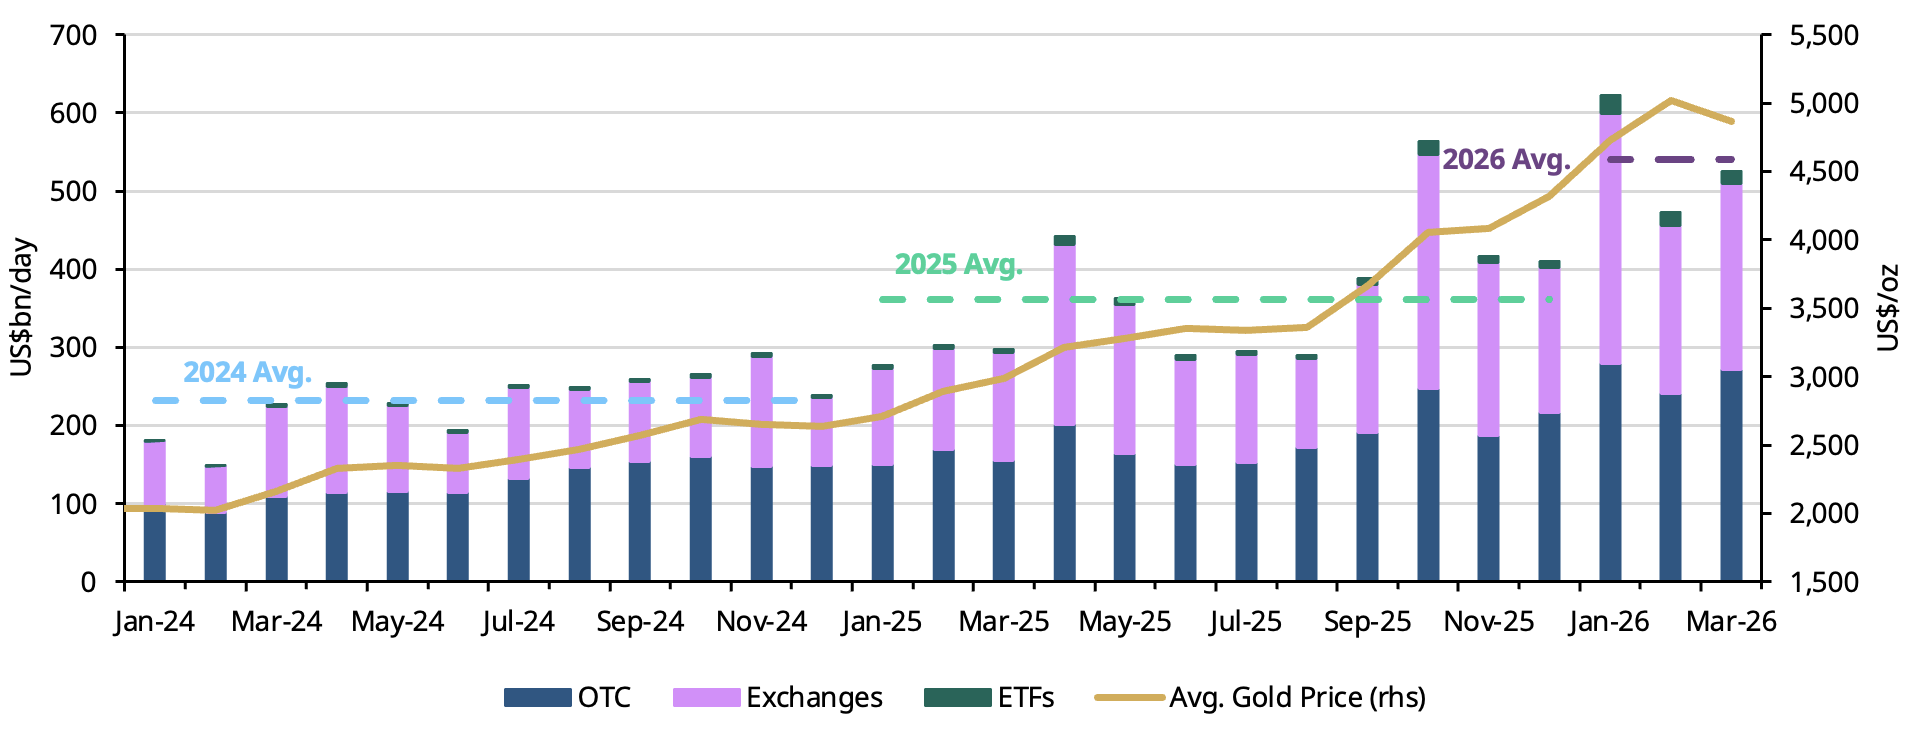
*Data as of 31 March 2026. Gold price based on the monthly average LBMA PM Gold Price USD.
For more information on trading volumes please visit our Trading Volumes page on Goldhub: Gold Trading Volume | Gold Daily Volume | World Gold Council.
Source: Bloomberg, Nasdaq, COMEX, ICE Benchmark Administration, Shanghai Gold Exchange, Shanghai Futures Exchange, ETF providers, Multi Commodity Exchange of India, Dubai Gold & Commodities Exchange, Japan Exchange Group, Thailand Futures Exchange, Borsa Istanbul, Bursa Malaysia, Korea Exchange, World Gold Council
