Gold ETF Flows: October 2025

Flows rise from Wall Street to the Bund

Published:

Highlights

  • Global gold ETFs have experienced inflows for five months in a row, with North America and Asia taking the lead.
  • The surging gold price and hefty inflows brought global gold ETFs’ total AUM to another record high.
  • Gold market trading volumes exploded, averaging US$561bn per day.

October in review

Global physically backed gold ETFs1 saw inflows five months in a row, bringing in US$8.2bn in October (Chart 1).2 While October inflows slowed compared to the previous month, they remained comfortably above the y-t-d average of US$7.1bn. Global ETFs are just two months away from recording what looks to be their strongest year on record.

From a regional perspective, North America and Asia led global inflows in the month, while Europe was the only region with outflows (Table 1). Global gold ETFs’ total assets under management (AUM) rose 6% m/m to US$503bn by the end of October, and holdings were 1% higher m/m to 3,893t.

Chart 1: North America and Asia offset European outflows 

Regional gold ETF flows and the gold price*

*As of 31 October 2025. Gold price based on the monthly average LBMA gold price PM in USD.
Source: Bloomberg, Company Filings, ICE Benchmark Administration, World Gold Council

Regional overview

North American funds go five-for-five, recording inflows of US$6.5bn in October. Gold reached its 50th all-time high of the year on 20 October, although spot gold (XAU) gave back 5% the following day. Until that point, the region had been on track for another record month, having recorded inflows of US$7.6bn during the first three weeks.

We believe the pullback was driven by profit taking and momentum traders amplifying the move. This led us to ask: How did ETFs respond in the days that followed?

Despite the price drop on 21 October, the largest listed gold ETFs in the US did not report outflows – contrary to what many expected. In fact, North American funds recorded positive inflows of US$334mn (2.3t) that day.

However, as the price continued to retreat, outflows eventually followed. By the end of that week, the region had seen US$117mn in net outflows, and this momentum carried through to month-end, with an additional outflow of US$1bn.

Geopolitical risk, lower yields, and equity market frothiness may have been key drivers of gold demand as investors seek portfolio diversification.

European funds broke their five-month streak of inflows, reporting US$4.5bn of outflows in October – the region’s second largest monthly outflow on record. While Switzerland posted another solid month of inflows, it wasn’t enough to offset significant weakness from the UK (its largest monthly outflow on record) and Germany (its second largest monthly outflow). Additional commentary from regional funds suggests the outflows were driven by a combination of profit taking and systematic portfolio rebalancing. This is supported by flow data, which remained relatively muted until the week of 20 October – when the region recorded its largest weekly outflow on record: US$3.6bn.

Asian investors, on a net basis, bought US$6.1bn in October, the second strongest month on record – not too far from the record of US$7.3bn in April. China dominated inflows by adding US$4.5bn. The US-China tension flare-up in early October, alongside the gold price strength, sparked renewed gold interest among local investors. And slowing growth in Q3 also boosted local investor safe-haven demand. Japanese and Indian funds have registered consecutive positive flows for 13 months and 5 months, respectively.

Funds in other regions experienced minimal inflows of US$56mn in October. Australia once again led inflows (+US$203mn), but these were partially offset by outflows from South Africa (-US$118mn).

Chart 2: Outflows accelerate with gold price pullback

Weekly regional fund flows of physical gold backed ETFs*

Chart 2

*Data as of 31 October 2025. Gold price reflects the average weekly LBMA PM benchmark.
Source: Bloomberg, Company Filings, ICE Benchmark Administration, World Gold Council


Gold ETF flows

Data as of

Demand captures changes in global/regional gold holdings; fund flows capture the net amount of money (in USD) that comes in or out of gold ETFs globally/regionally. See methodology note.

Volumes rise with volatility

Gold market trading volumes surged in October to a record high of US$561bn per day – increasing 45% m/m.3 Volumes jumped alongside as traders piled into gold when prices hit record highs before pulling back 8% into month-end. As a result, all trading segments saw higher activity m/m.4

Exchange-traded volume rose 59% m/m to an average of US$300bn/day, driven by strong activity on both COMEX (+49%) and the Shanghai Futures Exchange (+86%).

OTC trading increased 28% m/m to US$245bn/day – 92% higher than the 2024 average of US$128bn/day.

Gold ETF trading volumes surged to a record US$17bn/day (+100% m/m), led primarily by North American funds, which averaged US$12.5bn/day (+93% m/m) and accounted for roughly 75% of global physically backed ETF trading.

Trading volume in tonnage terms was equally impressive, rising 31% m/m to 4,287t per day, just 1% shy of the record set in April (4,251t/day).

The increase was largely driven by higher activity in LBMA OTC and COMEX markets, which averaged 1,725t (+16% m/m) and 1,492t (+36% m/m) per day, respectively. While smaller in size, gold ETF trading also grew sharply, up 80% m/m to 125t per day, led by North America (95t/day, +73% m/m) and Asia (22t/day, +109% m/m).

Lastly, with the government shutdown preventing updates to net long positioning, futures open interest fell 4% m/m to US$235bn at month-end, suggesting a decline in long positions.5 Notably, open interest had reached its highest level since 2013 – US$261bn –during the week ending 17 October.

Chart 3: Gold volumes surged recording their strongest month in 2025

Average daily trading volumes by segment*

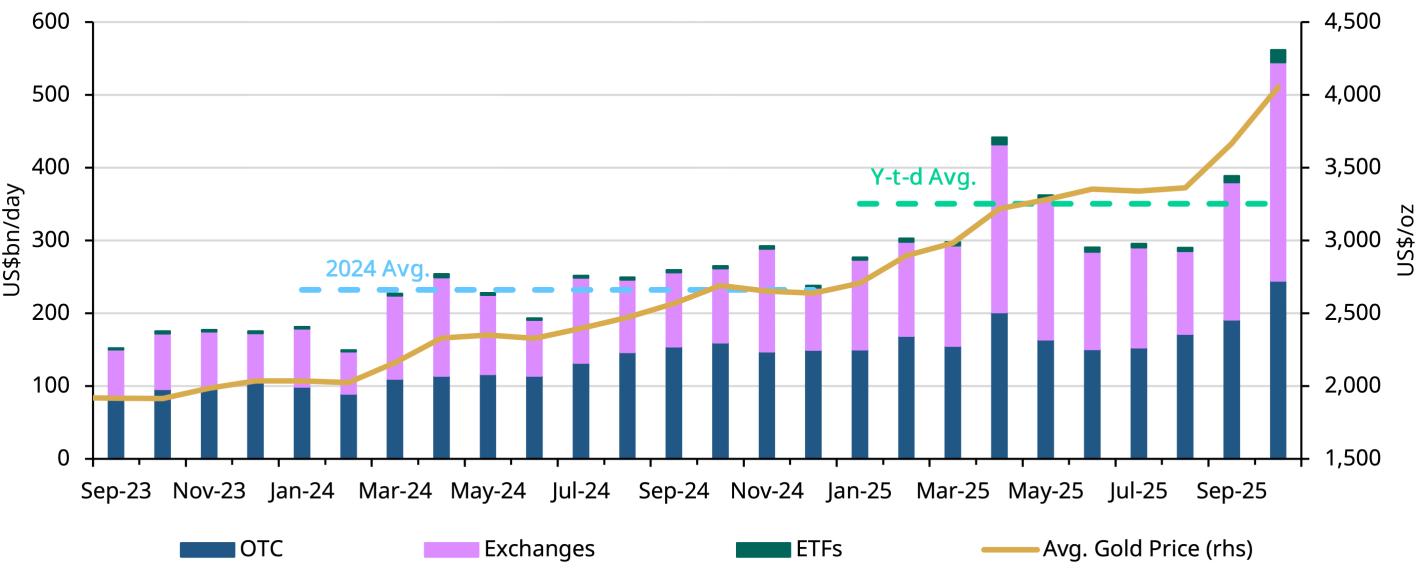
*Data as of 31 October 2025. Gold price based on the monthly average LBMA gold price PM USD. 
For more information on trading volumes please visit our Trading Volumes page on Goldhub: Gold Trading Volume | Gold Daily Volume | World Gold Council.
Source: Bloomberg, Nasdaq, COMEX, ICE Benchmark Administration, Shanghai Gold Exchange, Shanghai Futures Exchange, ETF providers, Multi Commodity Exchange of India, Dubai Gold & Commodities Exchange, Japan Exchange Group, Thailand Futures Exchange, Borsa Istanbul, Bursa Malaysia, Korea Exchange, World Gold Council

Footnotes

  1. We define gold ETFs as regulated securities that hold gold in physical form. These include open-ended funds traded on regulated exchanges and other regulated products such as closed-end funds and mutual funds. A complete list is included in the gold ETF section of Goldhub.com.

  2. We track gold ETF assets in two ways: the quantity of gold they hold, generally measured in tonnes, and the equivalent value of those holdings in US dollars (AUM). We also monitor how these fund assets change through time by looking at two key metrics: demand and fund flows. For more detail, see our ETF methodology note.

  3. Due to LBMA trading volume data availability, our full trading volume dataset dates back to 2019.

  4. ATHs are based on the LBMA PM Fix price. As of 31 October 2025, gold has reached 50 new highs this year; we have now seen 90 new ATHs since the beginning of 2024. 

  5. This figure represents the current futures open interest position across the nine major global gold futures exchanges. For more information, see: Gold Open Interest Chart | World Gold Council.

Disclaimer [+]Disclaimer [-]