Gold ETF Flows: February 2026

Inflows supported by opposite shores

Published:

Highlights

  • Global investors continued to allocate to gold ETFs in February, marking the ninth consecutive month of inflows.
  • North America dominated global inflows, Asian demand remained positive, and Europe was the only region to record outflows.
  • Gold market trading volumes pulled-back to US$478bn/day but remain elevated relative to 2025 activity.

February in review

Global physically backed gold ETFs1 registered another month of inflows in February, adding US$5.3bn – the strongest two-month start to a year and the ninth consecutive monthly increase, as investors continued to build allocations amid elevated geopolitical risk and shifting macro conditions (Chart 1). Total global holdings rose to a new all‑time high, increasing 26t in the month to 4,171t, while a further rise in gold prices lifted global AUM to a record US$701bn.

North America once again led global demand; Asia extended its steady run of inflows, and Europe stood out as the only region to record net outflows following heavy early‑month redemptions tied to the late‑January precious metals sell‑off. 

Chart 1: Global gold ETF momentum builds early in the year

Regional gold ETF flows and the gold price*

*As of 28 February 2026. Gold price based on the monthly average LBMA Gold Price PM in USD.
Source: Bloomberg, Company Filings, ICE Benchmark Administration, World Gold Council

Regional overview

North America added US$4.7bn in February, marking its ninth consecutive month of inflows. While this may not surprise many investors, given the current environment, such a sustained run is notable and shouldn’t be overlooked.

Outside of the initial conditions phase2 there have only been two other periods in which the region recorded at least nine straight months of inflows – during the Global Financial Crisis (GFC) and the COVID‑19 pandemic. Although these episodes were driven by different dynamics, both were characterised by elevated systemic risk. As a result, diversification into safe‑haven assets remains a consistent theme for investors.

The recent rally in gold prices, following the late‑January pullback and early‑February softness, also helped attract new buyers and contributed to inflows.

It was the usual suspects that helped drive these inflows:

  • Heightened geopolitical risk, particularly involving Iran3
  • A more favourable opportunity cost for holding gold, driven by dollar weakness and lower rates
  • Ongoing trade and policy uncertainty following the Supreme Court’s ruling on tariffs4
  • Equity market concern, as software and SaaS-related names continued to weigh on the broader market.

Europe was the only region to record outflows of US$1.8bn in February, driven almost entirely by heavy redemptions during the first week as the late‑January precious metals sell-off spilled into early February. Although flows turned positive in subsequent weeks, including a notable rebound of roughly US$0.9bn in the second week, the early‑month liquidation remained too large to offset. 

Within Europe, the UK accounted for the bulk of redemptions (-US$1.9bn), reflecting its outsized share of the region’s gold ETF market; Germany followed at a distant second (-US$291mn). As the bulk of outflows on 30 January and 2 February was concentrated in UK‑listed funds – and not tied to a wider regional or country-specific macro event – we do not interpret this divergence as the start of a longer-term structural trend.

Asian funds expanded inflows to six months in a row, albeit at a slower pace, attracting US$2.3bn in February. Japan led inflows in the region. Political uncertainty earlier in the month, escalating tensions with China, the weakening yen, and gold’s strong performance in the currency (+6%) all supported Japanese gold ETF demand. China saw mild inflows, partially due to fewer trading days amid the Chinese New Year holiday. Gold’s muted performance in RMB also discouraged further buying. It is worth noting that the new gold ETF launched in Hong Kong SAR is attracting attention as it offers both listed shares and tokenised units; this contributed to the area’s inflows.5

India recorded healthy inflows of US$565mn, although this represented a moderation from the elevated prior two-month average of US$2bn. Redemptions from some of the larger funds earlier in the month were likely driven by profit taking as the gold price pulled back, but these were gradually offset as the month progressed, underscoring sustained interest in gold ETFs. This growing interest was further supported by the SEBI’s recent overhaul of the mutual fund scheme‑categorisation framework, which now gives funds greater flexibility to increase exposure to gold and silver instruments within defined limits.6

Funds in other regions saw further net buying, adding a modest US$17mn. The third consecutive monthly inflow was mainly from Australia, but this was partially offset by South African outflows. 


Gold ETF flows

Data as of

Demand captures changes in global/regional gold holdings; fund flows capture the net amount of money (in USD) that comes in or out of gold ETFs globally/regionally. See methodology note.

Volumes fall but remain elevated

Global gold market trading volumes7 eased from January’s record high, averaging US$478bn/day in February. Despite the pullback, activity remained robust –  32% above the 2025 average.8 The month‑on‑month decline largely reflected profit‑taking, lighter Asian participation during the Lunar New Year holiday, and gold trading sideways after recovering most of its early‑month drop (Chart 2). 

Over‑the‑counter (OTC) volumes fell 12% m/m to US$245bn/day, driven by softer LBMA spot trading but still elevated by historical standards. Derivatives activity on major exchanges also moderated: after averaging US$336bn/day in the first week of February, volumes trended lower and ended the month near US$151bn/day. A similar pattern emerged in global gold ETFs, with trading averaging US$28bn/day early in the month before dropping by more than half to around US$12bn/day by month‑end. 

Tonnage‑based volume reflected the broader slowdown, averaging 2,969t/day in February – down 26% m/m and below the 2025 average of 3,247t/day. Exchange trading accounted for most of the decline, falling 34% m/m to 1,345t/day. 

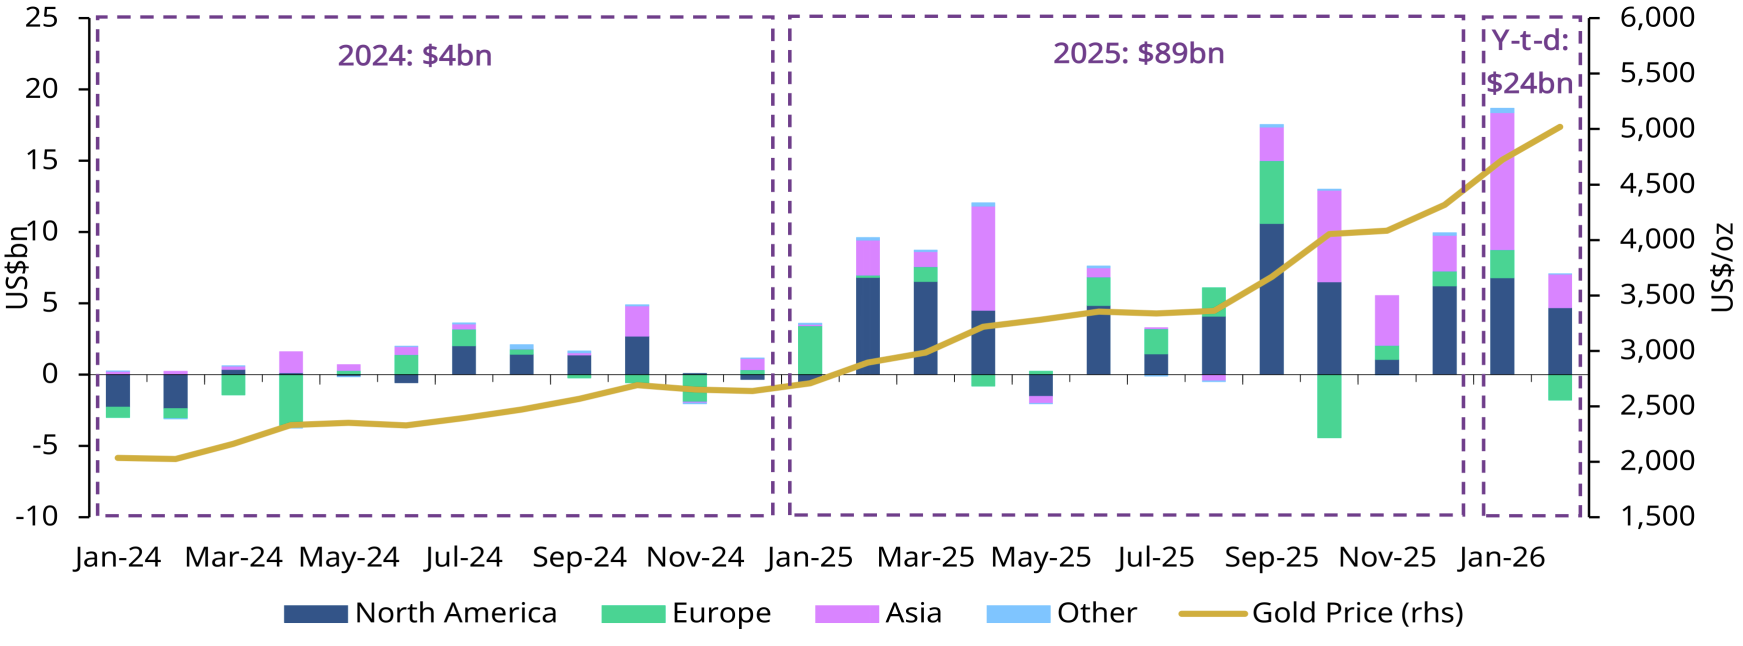
Positioning data showed a reduction in total COMEX net longs, which fell 21% during the month to 504t.9 There was a modest build in the week ending 20 February, but the delayed release of the COT report means data for the final week – during which gold rallied amid heightened tensions between the US and Iran – is still unavailable. Money manager net longs decreased 18% to 311t, while Other net longs declined 27% to 194t. 

Chart 2: Gold volumes pull back but remain elevated relative to 2025 levels 

Average daily trading volumes by segment*
 

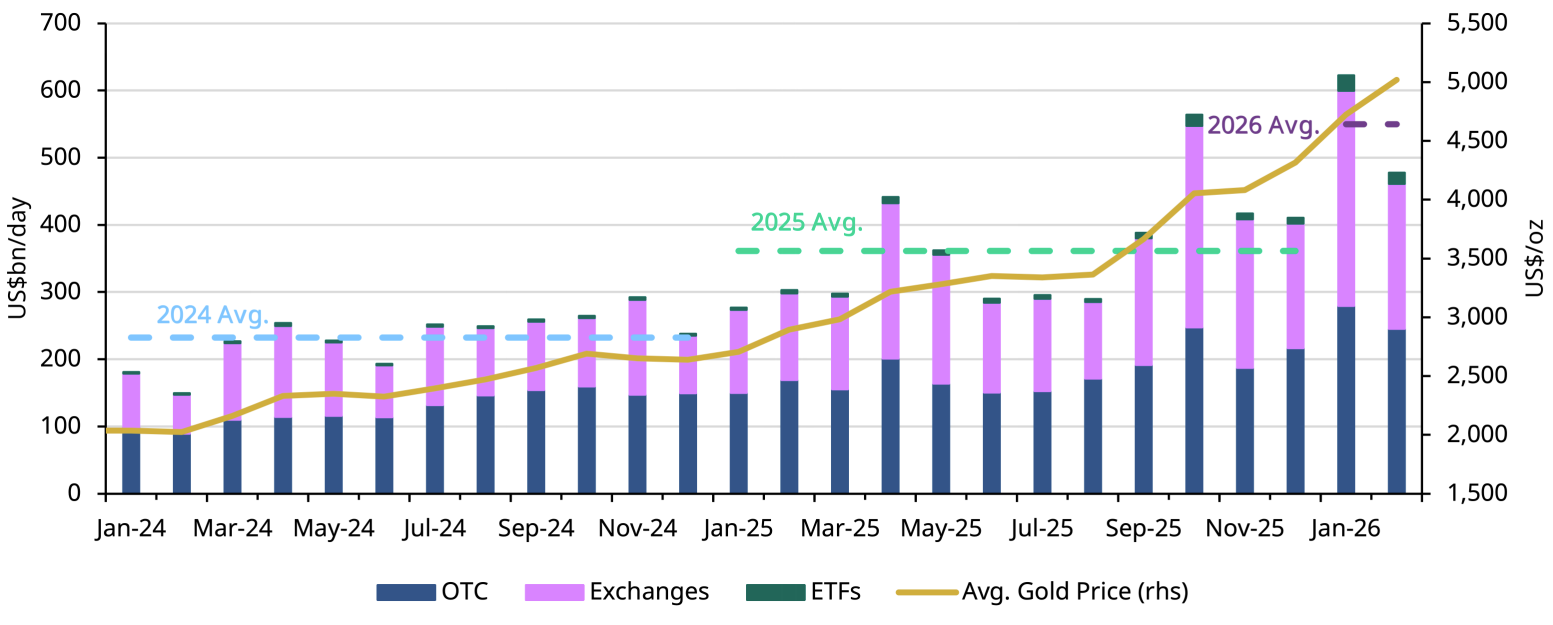
*Data as of 28 February 2026. Gold price based on the monthly average LBMA gold price PM USD. 
For more information on trading volumes please visit our Trading Volumes page on Goldhub: Gold Trading Volume | Gold Daily Volume | World Gold Council.
Source: Bloomberg, Nasdaq, COMEX, ICE Benchmark Administration, Shanghai Gold Exchange, Shanghai Futures Exchange, ETF providers, Multi Commodity Exchange of India, Dubai Gold & Commodities Exchange, Japan Exchange Group, Thailand Futures Exchange, Borsa Istanbul, Bursa Malaysia, Korea Exchange, World Gold Council

Footnotes

  1. We define gold ETFs as regulated securities that hold gold in physical form. These include open-ended funds traded on regulated exchanges and other regulated products such as closed-end funds and mutual funds. A complete list is included in the gold ETF section of Goldhub.com.

  2. The period following the initial launch of physically backed gold ETFs in 2003, covering their early asset accumulation and adoption phase through 2006.

  3. Supreme Court strikes down Trump’s tariffs | Politico | 20 February 2026

  4. Due to LBMA trading volume data availability, our full trading volume dataset dates back to 2019.

  5. 2025 Avg. daily trading volume was US$361bn.

  6. Based on CFTC positioning report as of 20 February 2026.

Disclaimer [+]Disclaimer [-]