Weekly Markets Monitor - What gives: oil or yields?
Weekly Markets Monitor
Highlights
- Global markets remained under pressure last week. In the US, unexpected job losses, rising unemployment and weaker retail sales pointed to softening momentum, while private credit concerns persisted and the VIX rose. Eurozone inflation surprised on the upside amid risks from rising oil prices. Meanwhile, China set a lower 2026 growth target of 4.5–5% (vs. ~5% last year) and announced increased spending on infrastructure and public services to support growth.
- Global equity markets retreated across the board, while US Treasury yields climbed, the US dollar strengthened sharply, and oil prices surged.
- Oil has seen a further aggressive move higher to suggest a large “technical” base, potentially warning of a further rise (see appendix). This is not just about oil, with natural gas and fertiliser markets also at risk, putting upward pressure on global CPI and possibly complicating policy‑easing initiatives. If the shock does not dissipate then yields could rise further on hotter inflation. Currently, a G7 proposal to release crude from strategic reserves is on the cards, hoping to cushion the supply shock. (C.O.T.W)
Chart of the week: What gives: oil or yields?
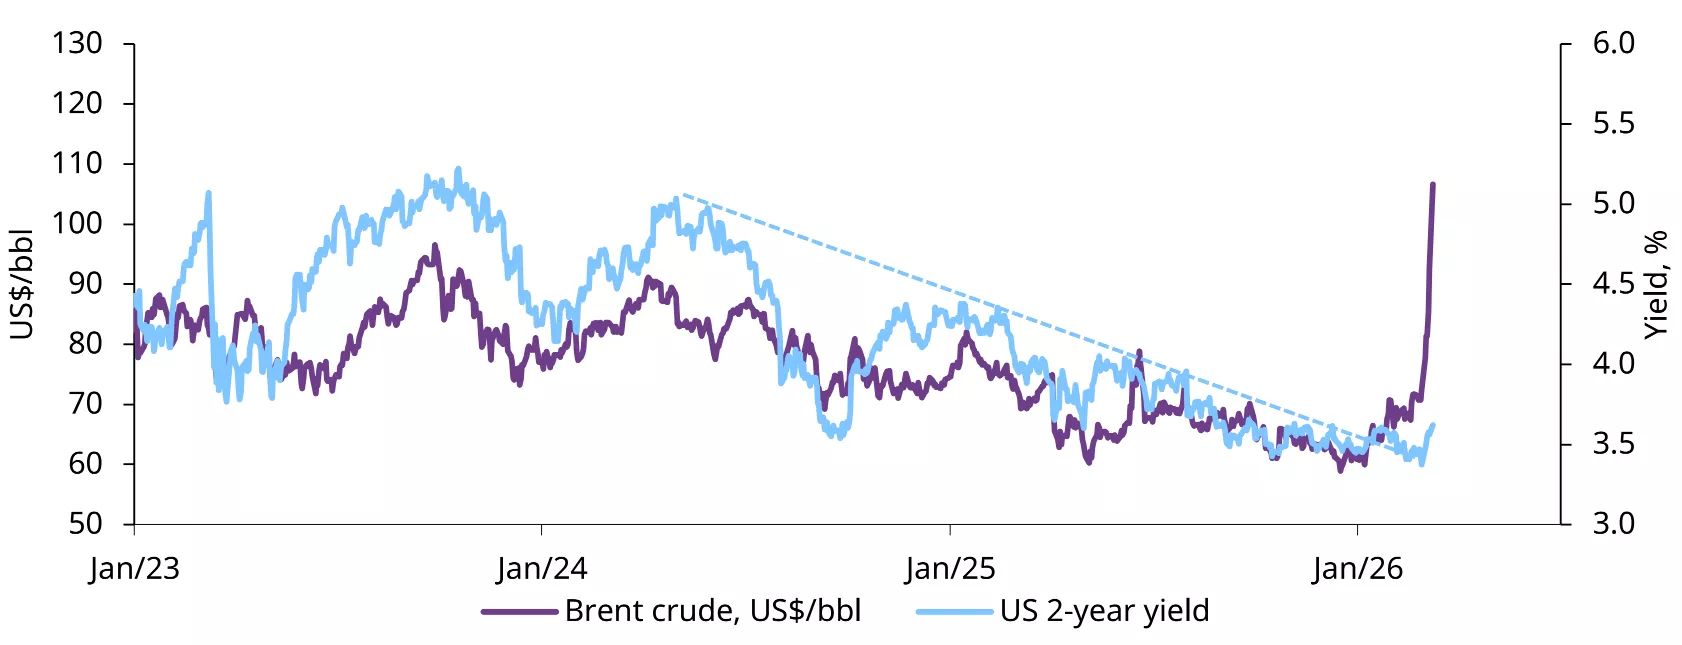
*Data from 1 January 2023 to 9 March 2026. Source: Bloomberg, World Gold Council
Disclaimer
Important information and disclaimers
© 2026 World Gold Council. All rights reserved. World Gold Council and the Circle device are trademarks of the World Gold Council or its affiliates.
All references to LBMA Gold Price are used with the permission of ICE Benchmark Administration Limited and have been provided for informational purposes only. ICE Benchmark Administration Limited accepts no liability or responsibility for the accuracy of the prices or the underlying product to which the prices may be referenced. Other content is the intellectual property of the respective third party and all rights are reserved to them.
Reproduction or redistribution of any of this information is expressly prohibited without the prior written consent of World Gold Council or the appropriate copyright owners, except as specifically provided below. Information and statistics are copyright © and/or other intellectual property of the World Gold Council or its affiliates or third-party providers identified herein. All rights of the respective owners are reserved.
The use of the statistics in this information is permitted for the purposes of review and commentary (including media commentary) in line with fair industry practice, subject to the following two pre-conditions: (i) only limited extracts of data or analysis be used; and (ii) any and all use of these statistics is accompanied by a citation to World Gold Council and, where appropriate, to Metals Focus or other identified copyright owners as their source. World Gold Council is affiliated with Metals Focus.
The World Gold Council and its affiliates do not guarantee the accuracy or completeness of any information nor accept responsibility for any losses or damages arising directly or indirectly from the use of this information.
This information is for educational purposes only and by receiving this information, you agree with its intended purpose. Nothing contained herein is intended to constitute a recommendation, investment advice, or offer for the purchase or sale of gold, any gold-related products or services or any other products, services, securities or financial instruments (collectively, “Services”). This information does not take into account any investment objectives, financial situation or particular needs of any particular person.
Diversification does not guarantee any investment returns and does not eliminate the risk of loss. Past performance is not necessarily indicative of future results. The resulting performance of any investment outcomes that can be generated through allocation to gold are hypothetical in nature, may not reflect actual investment results and are not guarantees of future results. The World Gold Council and its affiliates do not guarantee or warranty any calculations and models used in any hypothetical portfolios or any outcomes resulting from any such use. Investors should discuss their individual circumstances with their appropriate investment professionals before making any decision regarding any Services or investments.
This information may contain forward-looking statements, such as statements which use the words “believes”, “expects”, “may”, or “suggests”, or similar terminology, which are based on current expectations and are subject to change. Forward-looking statements involve a number of risks and uncertainties. There can be no assurance that any forward-looking statements will be achieved. World Gold Council and its affiliates assume no responsibility for updating any forward-looking statements.
Information regarding the LBMA Gold Price
The LBMA Gold Price is used by the World Gold Council with permission under license by ICE Benchmark Administration Limited and is subject to the restrictions set forth here (www.gold.org/terms-and-conditions).
Information regarding QaurumSM and the Gold Valuation Framework
Note that the resulting performance of various investment outcomes that can be generated through use of Qaurum, the Gold Valuation Framework and other information are hypothetical in nature, may not reflect actual investment results and are not guarantees of future results. Neither World Gold Council (including its affiliates) nor Oxford Economics provides any warranty or guarantee regarding the functionality of the tool, including without limitation any projections, estimates or calculations.
Information from ICRA Analytics Limited
All information obtained from ICRA Analytics Limited contained in this document is subject to the disclaimer set forth here (www.icraanalytics.com/terms-of-use/disclaimer).
Get updates in your inbox
Get email updates
China gold market update: Resilient demand in a festive month
Ray Jia
Head of Research (Asia Pacific, ex-India) and Deputy Head of Trade Engagement (China) World Gold CouncilHighlights
- Gold took different directions in February: the LBMA Gold Price PM in USD kept rising while the Shanghai Gold Benchmark Price PM (SHAUPM) in RMB fell, due mainly to a stronger local currency. So far in Marh, both prices have stabilised above their key thresholds.
- Wholesale demand showed some resilience during the Spring Festival month, falling modestly by 5t y/y to 85t, likely supported by the industry’s pre-holiday restocking and robust investment demand
- Chinese gold ETFs added RMB4.5bn (US$640mn) in February; holdings rose 4t to 290t while assets under management (AUM) fell 1% to RMB331bn (US$48bn), impacted by the local gold price decline. And inflows accelerated in early March, likely driven by higher safe-haven demand
- China’s gold reserves have expanded for 16 months in a row, and rose a further 1t in February to 2,309t; gold now represents 10% of China’s total foreign exchange reserves.
Looking ahead
- The gold jewellery sector may experience some seasonal weaknesses in the month ahead, which could be dampened further if gold price rises. Meanwhile, investment demand for gold should remain robust, potentially supported by ongoing geopolitical risks, globally and regionally.
Gold’s diverging price trends from west to east
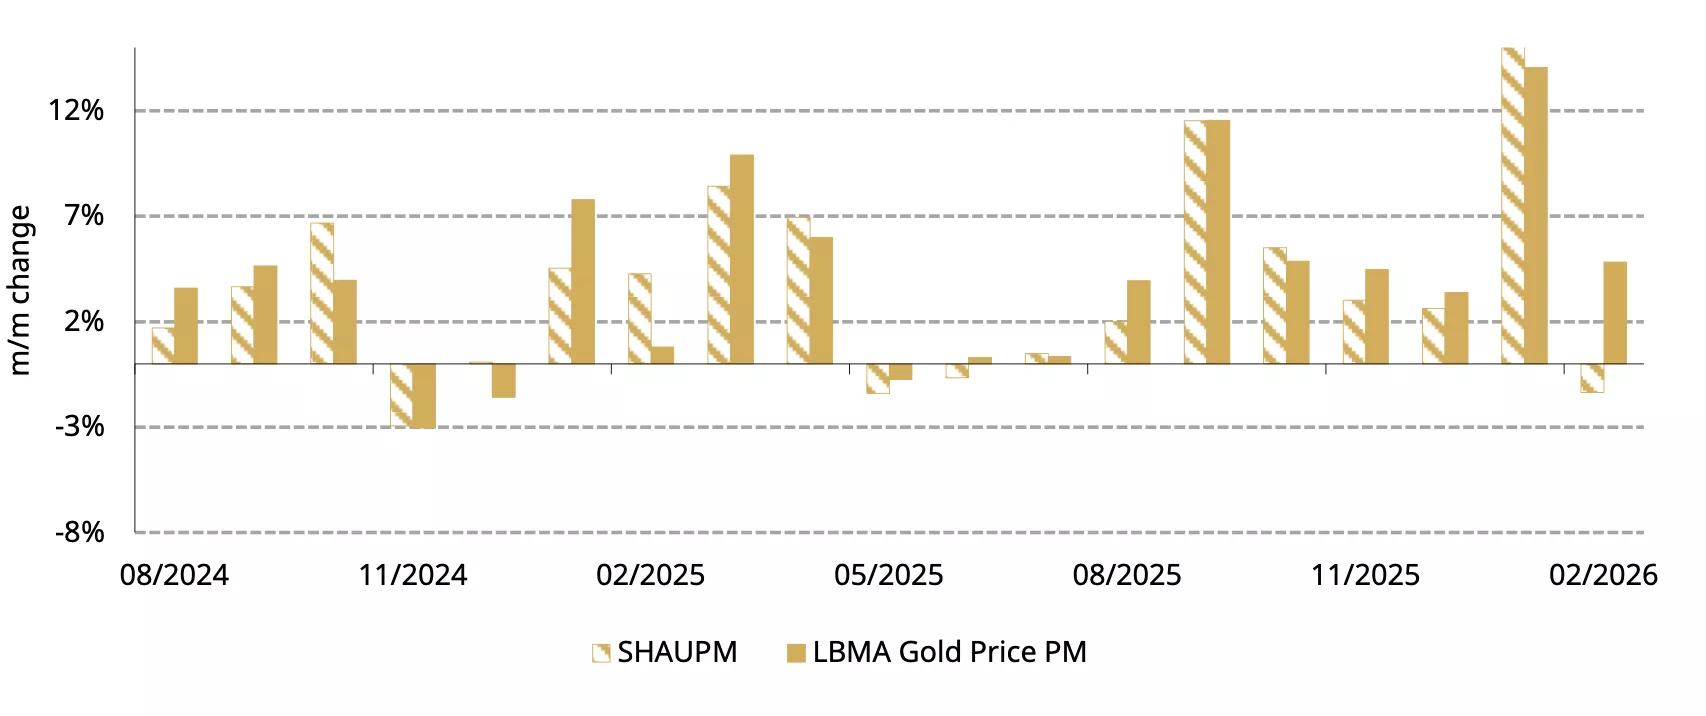
Gold prices diverged in February (Chart 1). The LBMA Gold Price PM in USD rose 4.8%, supported by factors such as heightened geopolitical risks and lower US Treasury yields. while the SHAUPM in RMB fell 1.3%, likely impacted by the 1.4% appreciation in RMB against the dollar and the Chinese New Year (CNY) holiday, which disrupted both local trading and physical gold withdrawals.
So far in March gold prices have experienced mild declines as investor expectations of the Fed’s future rate path shift. But supported by rising safe-haven demand amid the Middle East chaos, the LBMA Gold Price PM remains above the US$5,000/oz threshold, whilst the SHAUPM stands firmly above RMB1,100/gram.
Chart 1: February saw gold prices take different directions
Monthly returns of the SHAUPM in RMB and LBMA Gold Price PM in USD*
*Data to 27 February 2026.
Source: Shanghai Gold Exchange, ICE Benchmark Administration, World Gold Council
Wholesale gold demand showed resilience
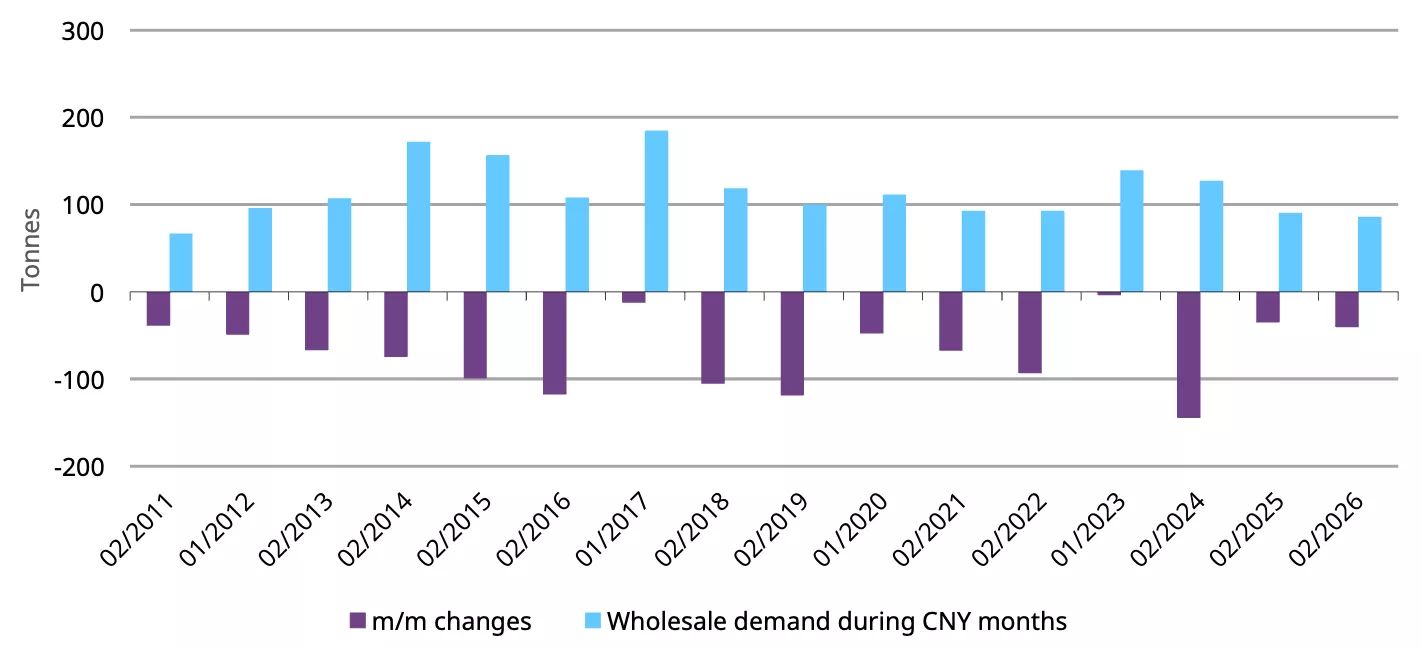
Gold withdrawals from the SGE totalled 85t in February, a CNY month, down 32% m/m (Chart 2), mainly due to fewer working days in February (14) compared to January (20).1 It is noteworthy that most factories in China – including jewellery manufacturers and bullion refiners – usually take longer CNY holidays than other sectors, further weighing on February activity.
Compared to February 2025, also a CNY month, wholesale gold demand fell by a modest 5t. This relative resilience was likely supported by two factors: first, a lower RMB gold price helped underpin some pre‑holiday restocking; and second, bullion sales remained robust likely driven by seasonal factors and similar factors drove gold ETF demand detailed below.
Chart 2: Wholesale gold demand during CNY month stayed relatively resilient
Gold withdrawals from the SGE during CNY months*
*Based on the occurrence of the majority of CNY holidays.
Source: Shanghai Gold Exchange, World Gold Council
Inflows into Chinese gold ETFs persisted
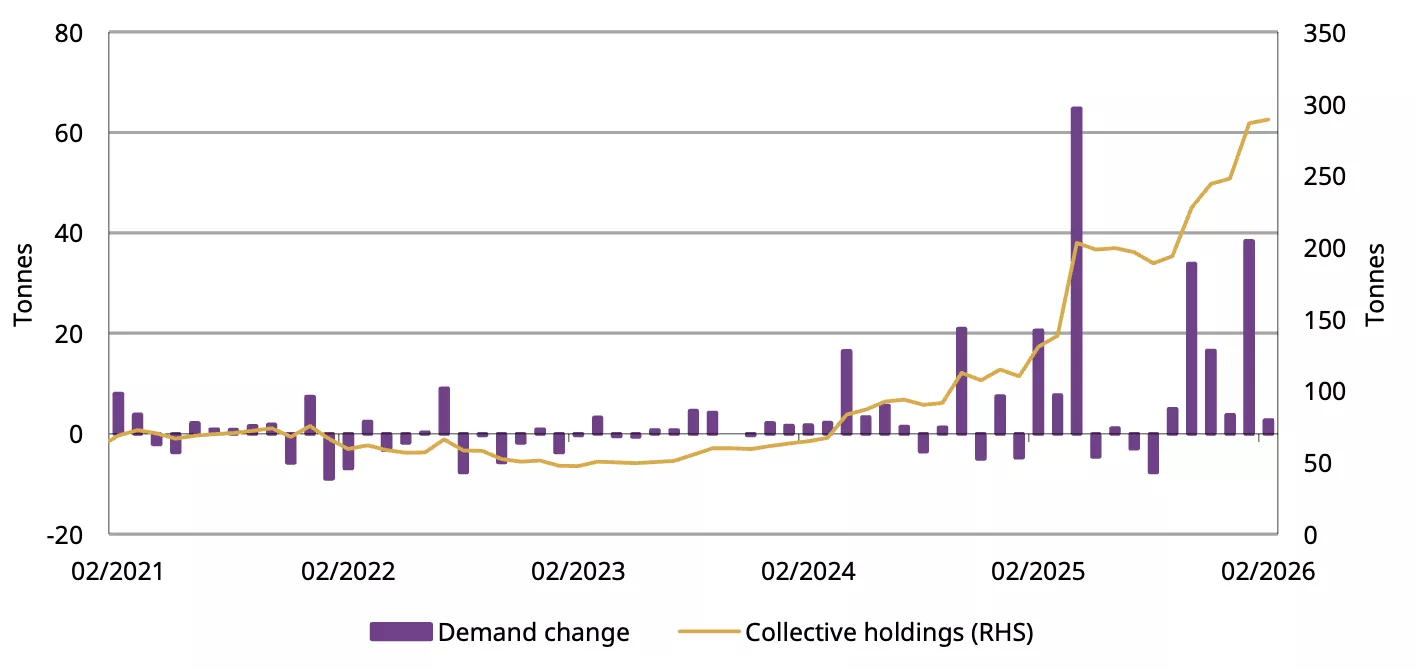
Chinese gold ETFs added RMB4.5bn (US$640mn) in February, marking the sixth consecutive monthly inflow (Chart 3). Collective holdings rose 3.6t to 290t in the month, another all-time high. But their total AUM fell 1% m/m to RMB331bn (US$48bn) as February inflows were insufficient to offset the local gold price drop.
Early‑month volatility may have prompted some investors to reduce their holdings. As the local gold price stabilised investors added gold ETFs back into their portfolios. This is likely driven by both dip-buying as well as rising safe-haven demand amid geopolitical tensions globally and regionally. That said, fewer trading days due to the CNY holiday limited February inflows.
Inflows have accelerated so far in March, despite the gold price volatility. We believe rising safe-haven demand amid escalating global geopolitical tensons and a volatile equity market were main contributors.
Chart 3: Demand for Chinese gold ETFs continued in February
Chinese gold ETF demand and holdings in tonnes*
*Data to 27 February 2026.
Source: Company filings, World Gold Council
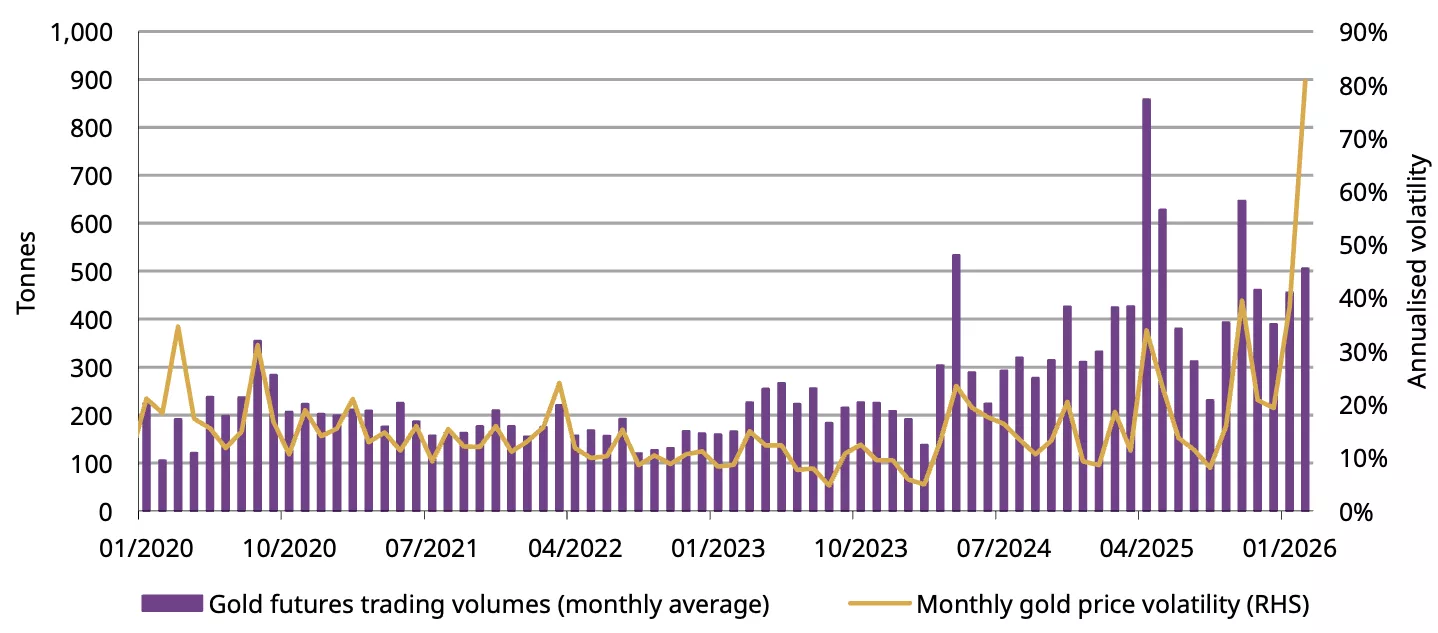
Trading volumes of gold futures on the Shanghai Futures Exchange (SHFE) averaged 505t per day, 11% higher m/m. The surging gold price volatility lifted tactical traders’ interest in gold futures; this was particularly evident in early February when both volatility and volumes spiked (Chart 4).
Chart 4: Trading volumes of gold futures rose in February
Daily average trading volumes of SHFE gold futures and the active gold futures price*
*As of 27 February 2026.
Source: Shanghai Futures Exchange, World Gold Council
China’s official gold holdings kept rising
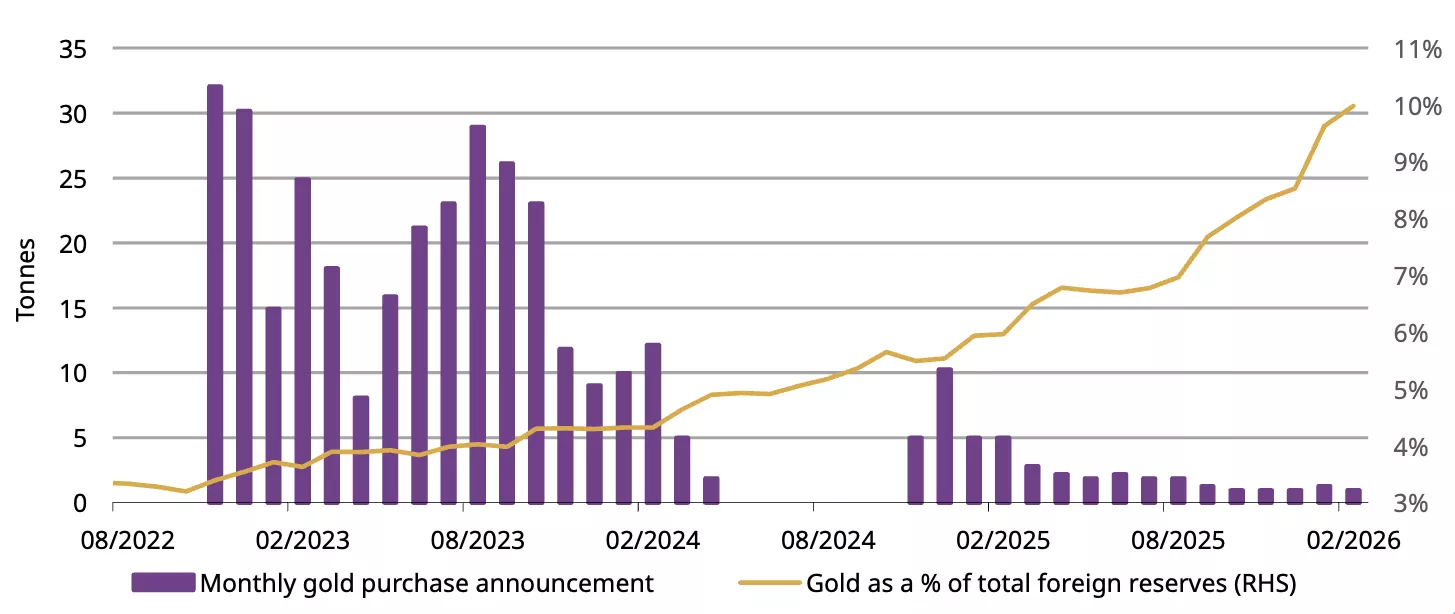
The PBoC reported another 1t addition to gold holdings in February, pushing the total to 2,309t (Chart 5). This now represents 10% of foreign exchange reserves, which rose 0.9% m/m to US$3.9tn. China’s gold reserves have risen consecutively for 16 months, sending an important message: in today’s world, gold’s role as an effective portfolio diversifier and uncertainty cushion is highly relevant.
Chart 5: Another addition to China’s gold reserves in February
The PBoC’s reported gold purchases and gold’s share of total foreign exchange reserves*
*Data to February 2026.
Source: State Administration of Foreign Exchanges, World Gold Council
Footnotes
1The Chinese New Years holiday occurred between 15 and 23 February 2026.
Disclaimer
Important information and disclaimers
© 2026 World Gold Council. All rights reserved. World Gold Council and the Circle device are trademarks of the World Gold Council or its affiliates.
All references to LBMA Gold Price are used with the permission of ICE Benchmark Administration Limited and have been provided for informational purposes only. ICE Benchmark Administration Limited accepts no liability or responsibility for the accuracy of the prices or the underlying product to which the prices may be referenced. Other content is the intellectual property of the respective third party and all rights are reserved to them.
Reproduction or redistribution of any of this information is expressly prohibited without the prior written consent of World Gold Council or the appropriate copyright owners, except as specifically provided below. Information and statistics are copyright © and/or other intellectual property of the World Gold Council or its affiliates or third-party providers identified herein. All rights of the respective owners are reserved.
The use of the statistics in this information is permitted for the purposes of review and commentary (including media commentary) in line with fair industry practice, subject to the following two pre-conditions: (i) only limited extracts of data or analysis be used; and (ii) any and all use of these statistics is accompanied by a citation to World Gold Council and, where appropriate, to Metals Focus or other identified copyright owners as their source. World Gold Council is affiliated with Metals Focus.
The World Gold Council and its affiliates do not guarantee the accuracy or completeness of any information nor accept responsibility for any losses or damages arising directly or indirectly from the use of this information.
This information is for educational purposes only and by receiving this information, you agree with its intended purpose. Nothing contained herein is intended to constitute a recommendation, investment advice, or offer for the purchase or sale of gold, any gold-related products or services or any other products, services, securities or financial instruments (collectively, “Services”). This information does not take into account any investment objectives, financial situation or particular needs of any particular person.
Diversification does not guarantee any investment returns and does not eliminate the risk of loss. Past performance is not necessarily indicative of future results. The resulting performance of any investment outcomes that can be generated through allocation to gold are hypothetical in nature, may not reflect actual investment results and are not guarantees of future results. The World Gold Council and its affiliates do not guarantee or warranty any calculations and models used in any hypothetical portfolios or any outcomes resulting from any such use. Investors should discuss their individual circumstances with their appropriate investment professionals before making any decision regarding any Services or investments.
This information may contain forward-looking statements, such as statements which use the words “believes”, “expects”, “may”, or “suggests”, or similar terminology, which are based on current expectations and are subject to change. Forward-looking statements involve a number of risks and uncertainties. There can be no assurance that any forward-looking statements will be achieved. World Gold Council and its affiliates assume no responsibility for updating any forward-looking statements.
Information regarding the LBMA Gold Price
The LBMA Gold Price is used by the World Gold Council with permission under license by ICE Benchmark Administration Limited and is subject to the restrictions set forth here (www.gold.org/terms-and-conditions).
Information regarding QaurumSM and the Gold Valuation Framework
Note that the resulting performance of various investment outcomes that can be generated through use of Qaurum, the Gold Valuation Framework and other information are hypothetical in nature, may not reflect actual investment results and are not guarantees of future results. Neither World Gold Council (including its affiliates) nor Oxford Economics provides any warranty or guarantee regarding the functionality of the tool, including without limitation any projections, estimates or calculations.
Information from ICRA Analytics Limited
All information obtained from ICRA Analytics Limited contained in this document is subject to the disclaimer set forth here (www.icraanalytics.com/terms-of-use/disclaimer).
Weekly Markets Monitor - Credit, where credit’s due
Weekly Markets Monitor
Highlights
- Global markets faced a turbulent week as the West Asian conflict added to existing economic uncertainty. Economic data pointed to moderating US growth, flat UK GDP, and a sharp drop in Eurozone industrial production, while China continued to post large trade surpluses.
- Global equities ended the week lower, while US Treasury yields, the dollar, and oil moved higher. Gold fell further as investors continued to adjust their expectations of the Fed’s future rate paths.
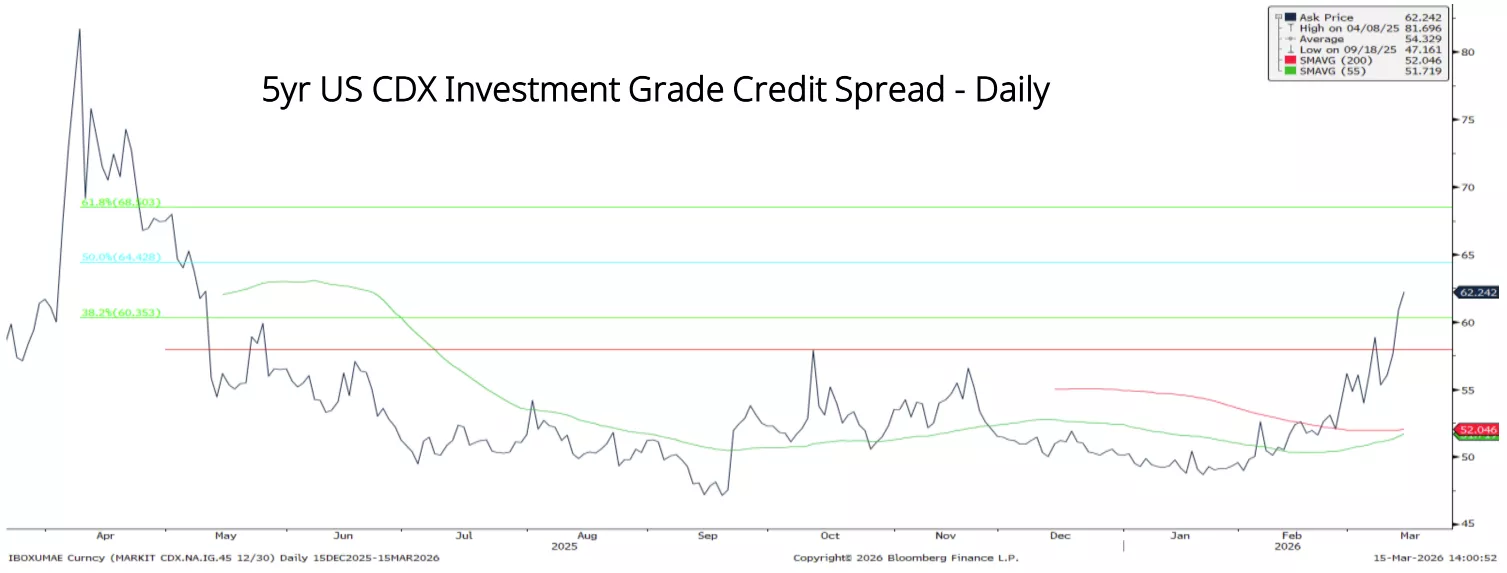
- Private credit is beginning to echo 2007–08. Investor withdrawals from US private credit funds so far appear to reflect liquidity rather than solvency concerns, but public investment‑grade spreads have started to widen. It remains unclear whether this is a localised, “contained” episode or something more systemic. It highlights a core vulnerability of private markets: capital can exit quickly, while the underlying illiquid assets may take far longer to sell. Gold’s liquidity is an advantage, but in a more severe credit shock it could also initially come under pressure (C.O.T.W)
Chart of the week: Credit, where credit’s due
Source: Bloomberg
Disclaimer
Important information and disclaimers
© 2026 World Gold Council. All rights reserved. World Gold Council and the Circle device are trademarks of the World Gold Council or its affiliates.
All references to LBMA Gold Price are used with the permission of ICE Benchmark Administration Limited and have been provided for informational purposes only. ICE Benchmark Administration Limited accepts no liability or responsibility for the accuracy of the prices or the underlying product to which the prices may be referenced. Other content is the intellectual property of the respective third party and all rights are reserved to them.
Reproduction or redistribution of any of this information is expressly prohibited without the prior written consent of World Gold Council or the appropriate copyright owners, except as specifically provided below. Information and statistics are copyright © and/or other intellectual property of the World Gold Council or its affiliates or third-party providers identified herein. All rights of the respective owners are reserved.
The use of the statistics in this information is permitted for the purposes of review and commentary (including media commentary) in line with fair industry practice, subject to the following two pre-conditions: (i) only limited extracts of data or analysis be used; and (ii) any and all use of these statistics is accompanied by a citation to World Gold Council and, where appropriate, to Metals Focus or other identified copyright owners as their source. World Gold Council is affiliated with Metals Focus.
The World Gold Council and its affiliates do not guarantee the accuracy or completeness of any information nor accept responsibility for any losses or damages arising directly or indirectly from the use of this information.
This information is for educational purposes only and by receiving this information, you agree with its intended purpose. Nothing contained herein is intended to constitute a recommendation, investment advice, or offer for the purchase or sale of gold, any gold-related products or services or any other products, services, securities or financial instruments (collectively, “Services”). This information does not take into account any investment objectives, financial situation or particular needs of any particular person.
Diversification does not guarantee any investment returns and does not eliminate the risk of loss. Past performance is not necessarily indicative of future results. The resulting performance of any investment outcomes that can be generated through allocation to gold are hypothetical in nature, may not reflect actual investment results and are not guarantees of future results. The World Gold Council and its affiliates do not guarantee or warranty any calculations and models used in any hypothetical portfolios or any outcomes resulting from any such use. Investors should discuss their individual circumstances with their appropriate investment professionals before making any decision regarding any Services or investments.
This information may contain forward-looking statements, such as statements which use the words “believes”, “expects”, “may”, or “suggests”, or similar terminology, which are based on current expectations and are subject to change. Forward-looking statements involve a number of risks and uncertainties. There can be no assurance that any forward-looking statements will be achieved. World Gold Council and its affiliates assume no responsibility for updating any forward-looking statements.
Information regarding the LBMA Gold Price
The LBMA Gold Price is used by the World Gold Council with permission under license by ICE Benchmark Administration Limited and is subject to the restrictions set forth here (www.gold.org/terms-and-conditions).
Information regarding QaurumSM and the Gold Valuation Framework
Note that the resulting performance of various investment outcomes that can be generated through use of Qaurum, the Gold Valuation Framework and other information are hypothetical in nature, may not reflect actual investment results and are not guarantees of future results. Neither World Gold Council (including its affiliates) nor Oxford Economics provides any warranty or guarantee regarding the functionality of the tool, including without limitation any projections, estimates or calculations.
Information from ICRA Analytics Limited
All information obtained from ICRA Analytics Limited contained in this document is subject to the disclaimer set forth here (www.icraanalytics.com/terms-of-use/disclaimer).
Get updates in your inbox
Get email updates
India gold market update: Volatility softens demand
Kavita Chacko
Research Head, India World Gold CouncilHighlights
- Gold prices ease from peak, but underlying strength holds
- Indian domestic price remains at a discount to international price, indicating adequate supply and subdued local demand
- Price volatility weighs on demand, structural support stays constructive
- Gold ETFs see persistent inflows despite tactical profit taking
- Imports cool but remain above trend.
Looking ahead
- Demand could see a recovery around key festivals in April and the wedding season in smaller towns. Overall buying interest will be influenced by price-trend stability.
Prices ease, underlying strength prevails
Gold prices have pulled back from end-January highs, pressured by a stronger US dollar and a rise in US Treasury yields. In addition, outflows from gold ETFs, particularly US-listed gold ETFs, – likely indicating tactical profit taking from the sharp rally in January – further weighed on prices. However, the pullback was contained, as heightened geopolitical tensions and ongoing policy uncertainty continued to reinforce gold’s role as a safe-haven asset. Moreover, Asian demand has been strong, with trading during Asian hours contributing positively to returns (1.5% v/s -4.7% during US trading hours).1 Also, barring the US, ETF demand has been positive across other regions, and the COMEX net long positioning has continued to build.
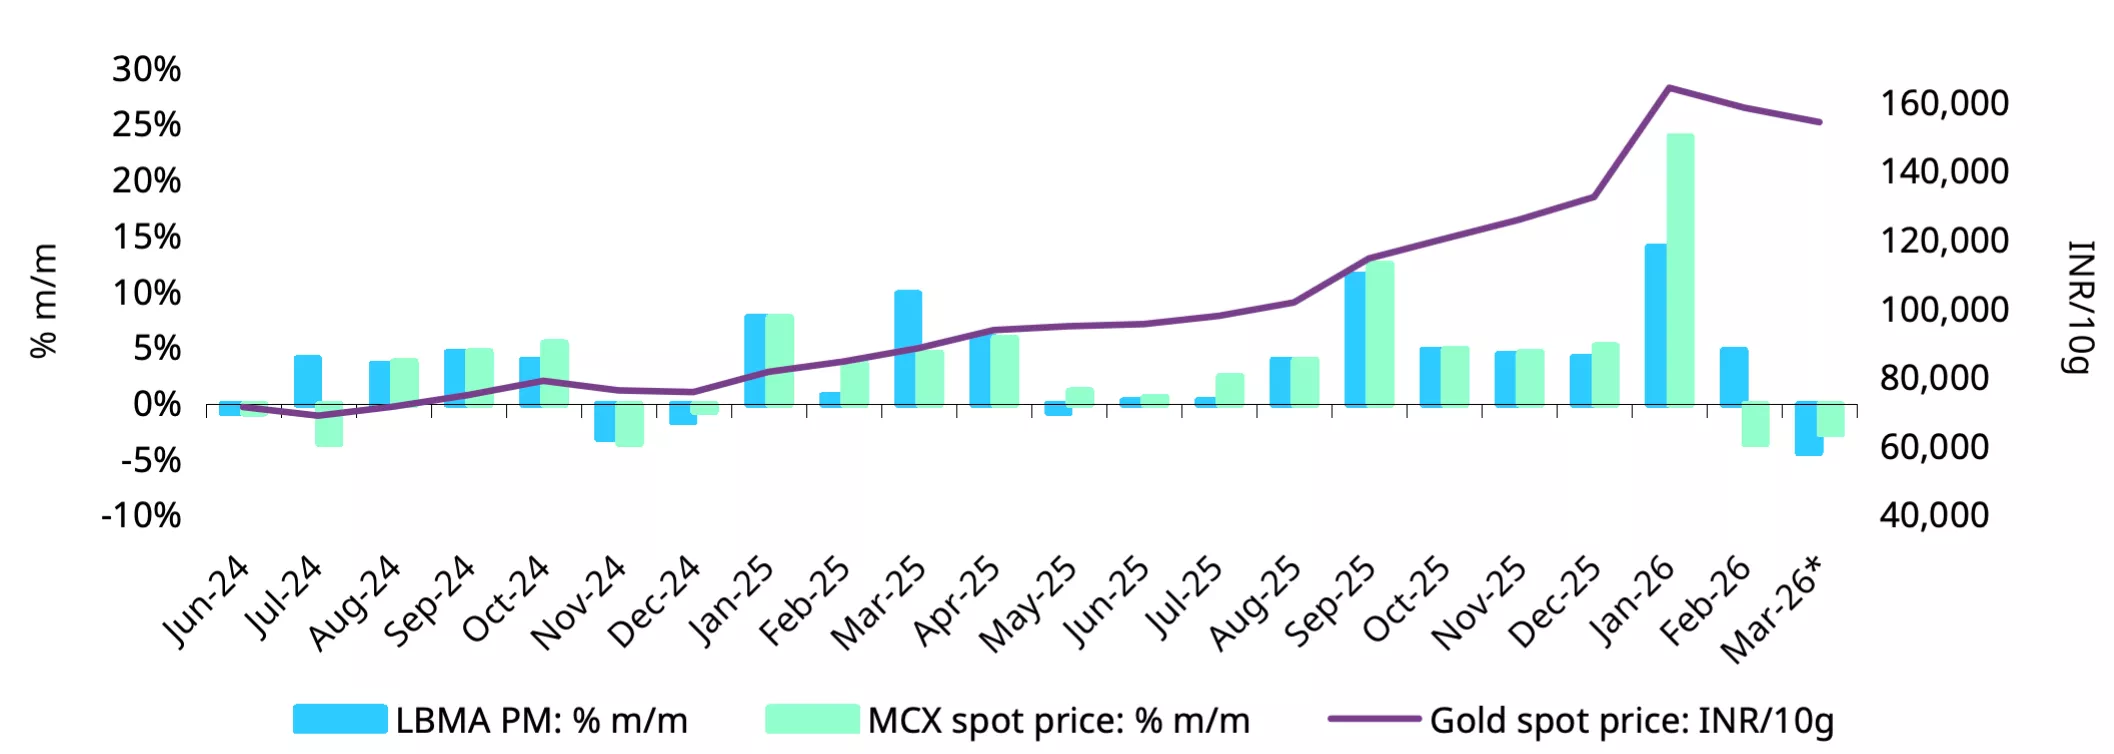
Chart 1: Prices ease, levels stay elevated
End-of-month LBMA Gold Price PM and MCX domestic spot price m/m changes and price level*
*Based on the LBMA Gold Price PM in US$ and MCX spot gold price as of 16 March 2026.
Source: Bloomberg, World Gold Council
Domestic gold prices diverged from international trends during February, declining 3.5%, even as international prices gained 5%.2This divergence was primarily driven by an appreciation in the Indian rupee against the US dollar and fewer revisions in the customs tariff value.3 So far in March domestic prices have realigned with international price trends: both moderating from end-February levels. However, as of 16 March the decline in domestic prices (2.6%) has been less pronounced than the 4.4% decline in international prices, as the recent INR depreciation4 has cushioned the downside in local prices. Despite the recent pullback, gold prices remain firm on a y-t-d basis, with international prices up 14% and domestic prices rising 16% to INR 154,395/10g,5 underscoring that the broader uptrend remains in place.
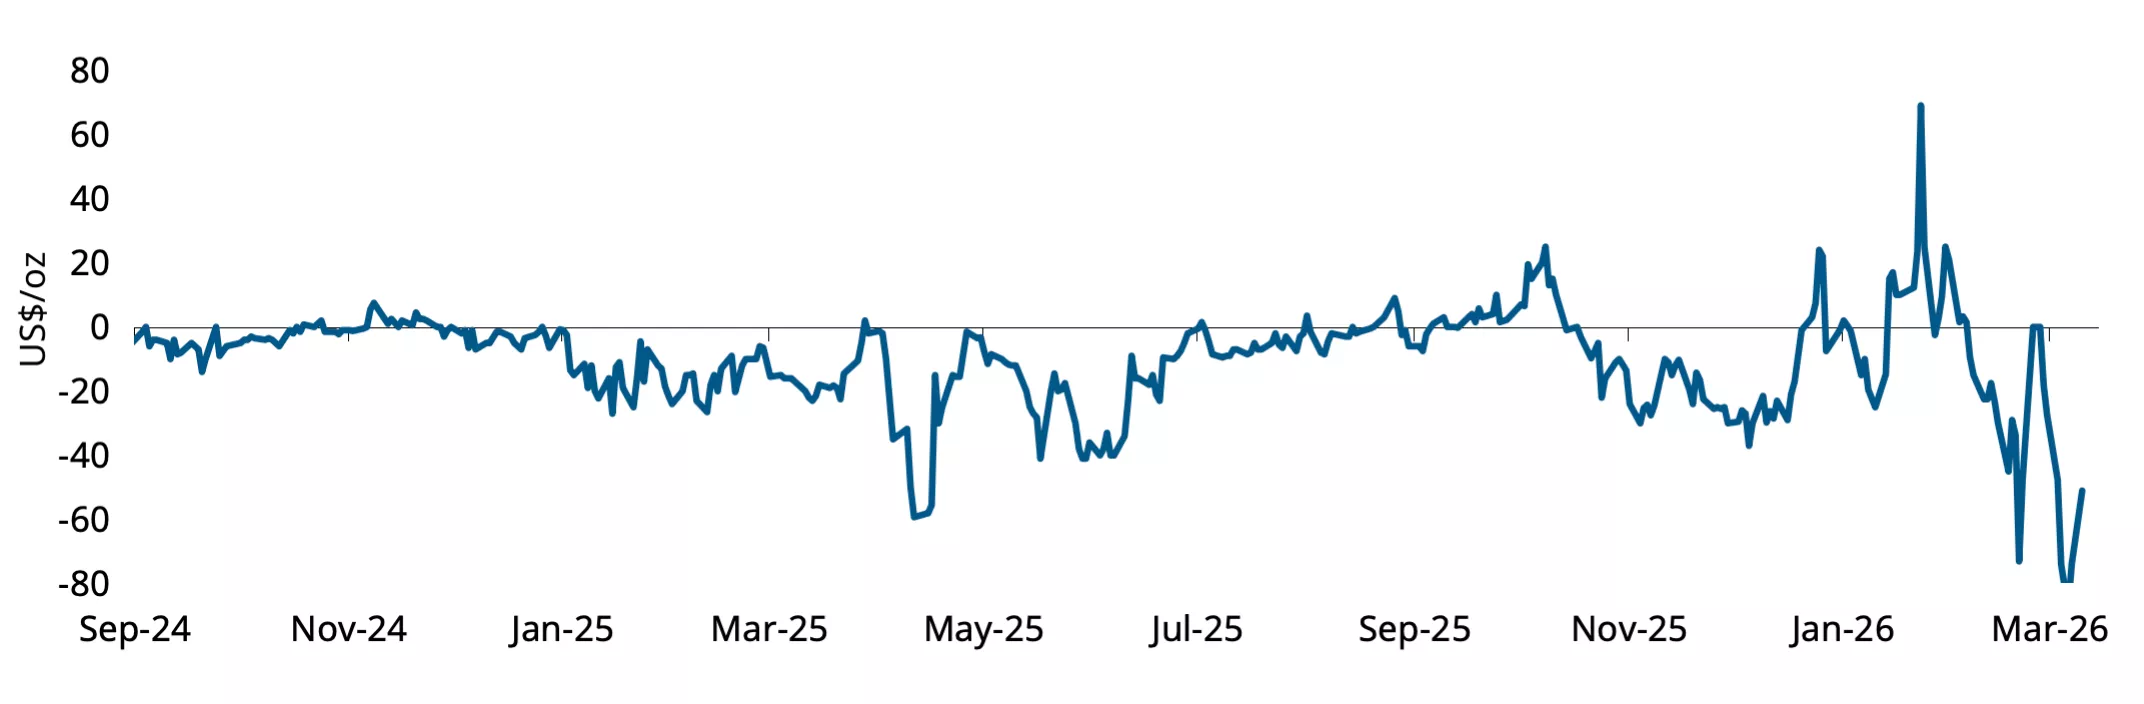
Chart 2: Discounts persist
NCDEX gold premium/discount relative to the international price*
*As of 16 March 2026.
Source: NCDEX, World Gold Council.
The domestic market has traded at a discount to international benchmarks since the second week of February. The discount briefly narrowed to par/slight-premium levels in early March on fears of supply tightness following geopolitical tensions involving Iran–US–Israel; disrupted flight routes from the UAE have interrupted India’s key supply channel, through which 24% of India’s gold was imported in 2025.
The move, however, was short-lived, with domestic prices reverting to a discount. Muted jewellery demand, along with likely earlier inventory build-up, ensured adequate supply. Discounts averaged US$58/oz during the first half of March, suggesting that near-term supply remains adequate relative to demand.
Volatility dents demand, structural support intact
Insights gathered from local market participants suggest that consumer demand for gold remained subdued despite the recent pullback from record highs. Buying interest was stronger during the earlier price uptrend – particularly on the investment side (bars and coins) – but has since softened amid heightened price volatility, leading consumers to defer purchases.
Seasonal and financial factors further weighed on demand. March is typically a softer month, marked by financial year-end closures and related statutory payments and tax outflows, which constrain liquidity for both consumers and retailers. Some retailers have reportedly liquidated inventory to meet tax obligations.
But the underlying trends remain constructive. Affluent consumers, who are relatively less sensitive to price levels, continue to support jewellery demand. Retailers are also reporting emerging interest from younger buyers, particularly for lightweight, contemporary, and predominantly plain gold jewellery (of 22k and 18k purity), which is increasingly viewed as an investment. Importantly, there is only limited evidence of profit-booking-driven liquidation, suggesting that sentiment towards gold remains positive, even as consumers gradually adjust to a higher price base. Retailer purchases, meanwhile, have been largely linked to store expansion and inventory requirements, rather than demand-led restocking.
Gold ETFs: inflow momentum continues alongside profit taking
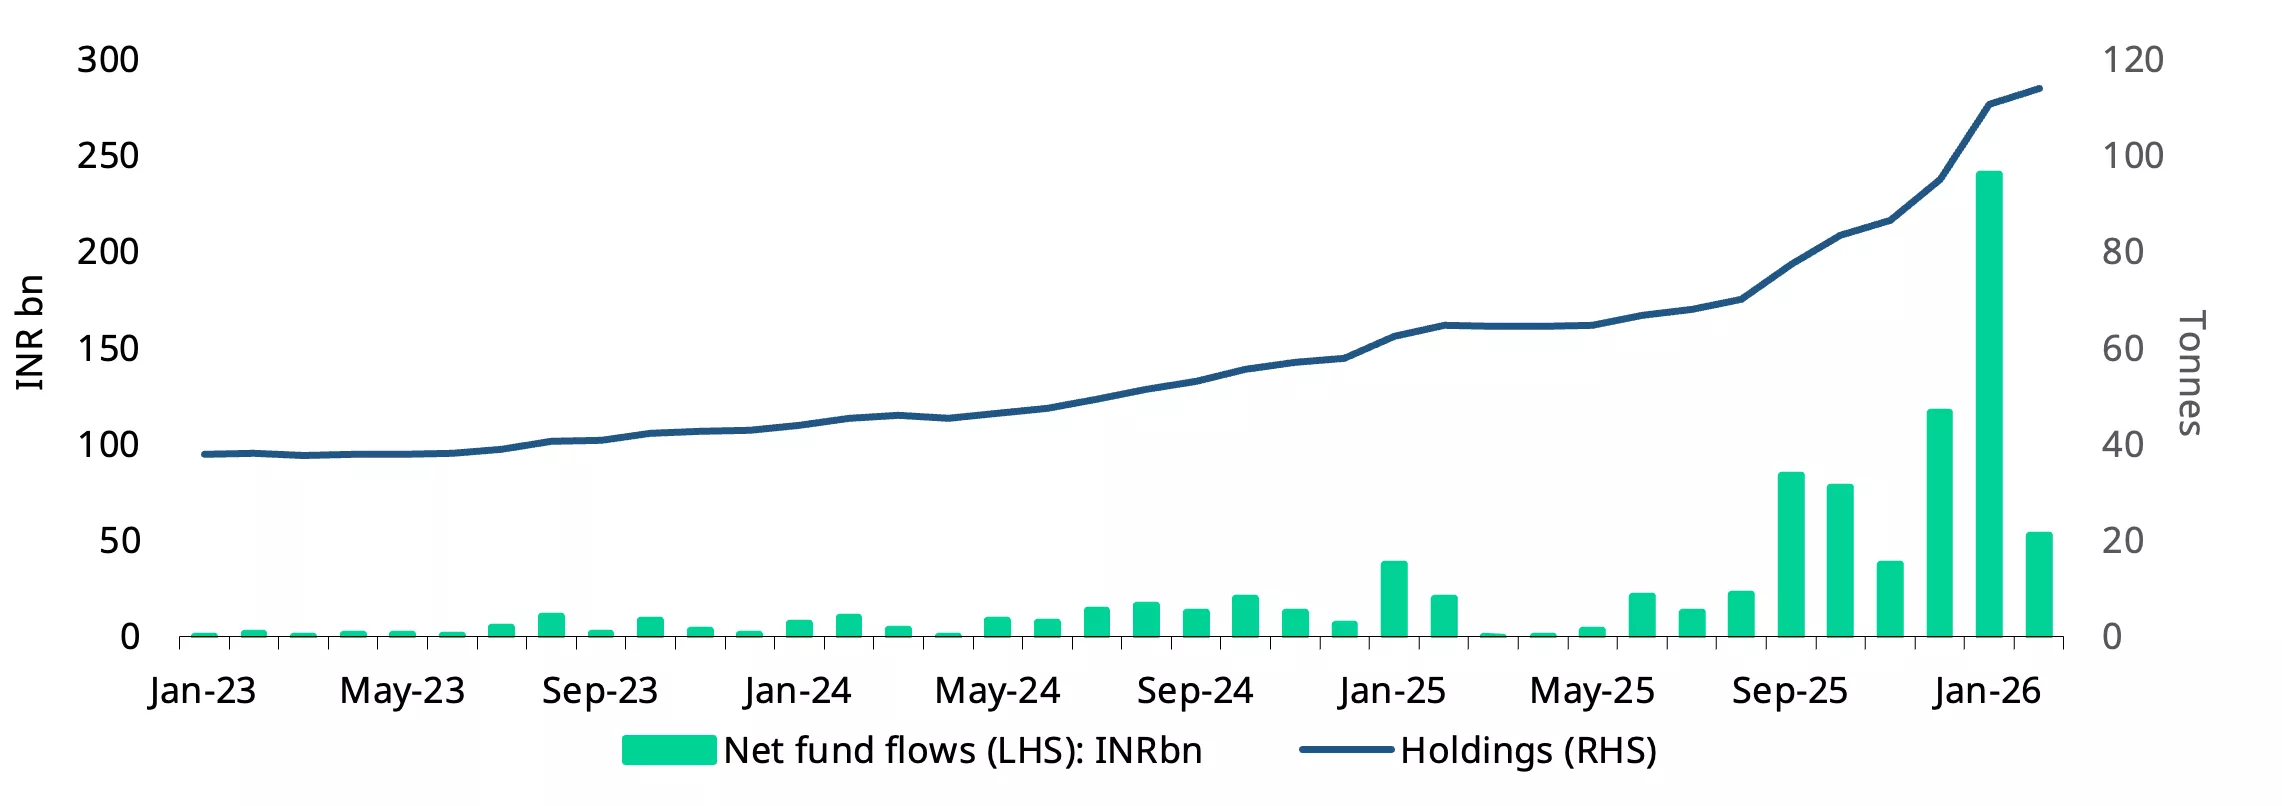
Gold ETF inflows remained positive in February for the tenth consecutive month, albeit at a slower pace compared to the exceptionally strong inflows in the preceding two months. In line with our initial estimates, net inflows stood at INR52.5bn (US$579mn), translating into an addition of 3.3t to ETF gold holdings. The 78% m/m decline in net inflows in February was largely driven by tactical profit taking amid softer gold prices, with redemption during the month reaching a record INR250bn (US$276mn) as per AMFI data.
Despite the moderation on a sequential basis, February inflows remained well above the May-November 2025 average of INR 36.7bn (US$417mn), indicating that investor interest in gold ETFs remains relatively sticky. The trend has continued into March, with estimated net inflows of INR42bn (US$456mn) during the period 1-12 March; this additional 2.6t takes total holdings to 116.5t.
Investor participation continued to broaden during February, with around 0.65mn new folios (accounts) added, taking the total number of accounts directly invested in gold ETFs to 12.1mn. This highlights the growing adoption of gold ETFs within investor portfolios.
Regulatory developments could further support the segment’s growth. In February, Securities and Exchange Board of India (SEBI) introduced new rules6 allowing actively managed equity mutual funds to invest part of their residual portfolio allocation (up to 35% of assets beyond core equity exposure) in gold and silver ETFs, giving fund managers greater flexibility in portfolio diversification. The move could potentially lead to incremental institutional flows into gold ETFs. Reflecting the segment’s expanding role within the mutual fund industry, gold ETFs accounted for around 2.3% of overall mutual fund assets in February, broadly stable m/m but significantly higher than 0.9% one year ago.
A new gold ETF is being launched in March, taking the total number of gold ETFs in India to 26.7 A full list of the gold ETFs we track worldwide is available on Goldhub.com.
Chart 3: Inflows moderate, momentum holds
Gold ETF flows in INRbn, and total holdings in tonnes*
*As of end February 2026.
Source: AMFI, ICRA Analytics, CMIE, World Gold Council
Sequential drop in imports
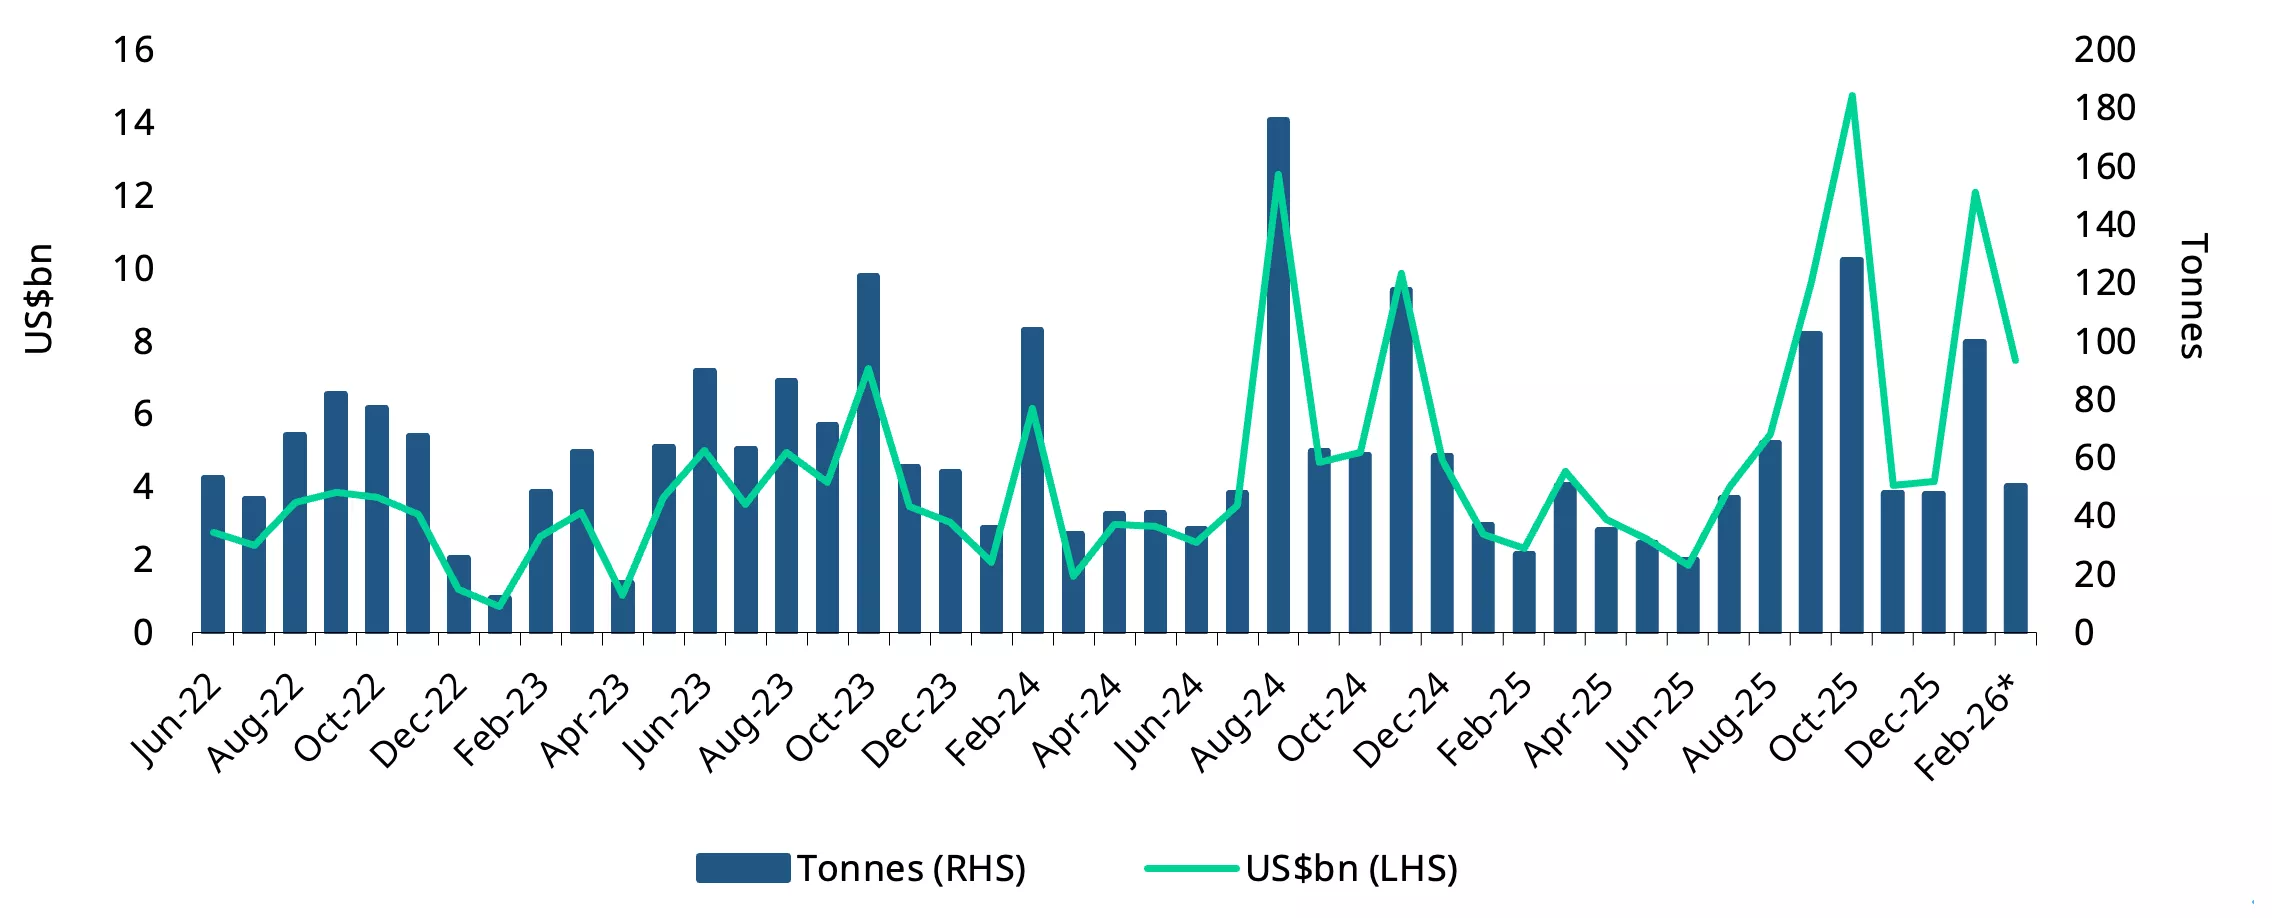
Gold imports moderated in February from the previous month, reflecting near-term demand softness amid elevated prices and volatility. However, imports remained significantly higher on an annual basis, rising 224% in value terms and over 80% in volume terms. At US$7.5bn, imports were 38% lower m/m but ~31% higher than the trailing 12-month average, indicating that underlying demand prevails despite likely price-led moderation in buying activity. In volume terms, February imports are estimated to be in the range of 48t–56t, notably lower than the 99t recorded in January but above the 31t of February 2025 and broadly in line with the 12-month average of 59t.
Late-February geopolitical developments in the Middle East are not yet reflected in the import data. Media reports8 indicate that flight disruptions have impacted gold shipments from key regional hubs, particularly the UAE. Any sustained disruption from the region could tighten near-term domestic supply conditions and prompt rerouting of imports.
Chart 4: Imports strong despite m/m dip
Monthly gold imports in tonnes and US$bn
*Includes World Gold Council estimates on import volumes.
Source: Ministry of Commerce and Industry, CMIE, World Gold Council
Footnotes
1Based on Asia, Europe and US trading window from 2 March to 18 March 2026 as estimated by World Gold Council.
2Based on MCX spot gold price in INR and LBMA Gold Price PM in USD.
3Customs duty on gold imports is levied on a notified value fixed by the Central Board of Indirect Taxes and Customs, rather than solely on invoice prices. There is no fixed schedule for revising the notified value. It is typically updated every few weeks and more frequently during periods when international price volatility is high.
4INR has depreciated against the USD by 1.6% during 1-16 March 2026.
5MCX spot gold price as of 16 March 2026.
6Categorization and Rationalization of Mutual Fund Schemes, SEBI, 26 February 2026.
8India staring at likely gold, diamond shortage after US and Israel strikes on Iran, Economic Times, 2 March 2026.
Disclaimer
Important information and disclaimers
© 2026 World Gold Council. All rights reserved. World Gold Council and the Circle device are trademarks of the World Gold Council or its affiliates.
All references to LBMA Gold Price are used with the permission of ICE Benchmark Administration Limited and have been provided for informational purposes only. ICE Benchmark Administration Limited accepts no liability or responsibility for the accuracy of the prices or the underlying product to which the prices may be referenced. Other content is the intellectual property of the respective third party and all rights are reserved to them.
Reproduction or redistribution of any of this information is expressly prohibited without the prior written consent of World Gold Council or the appropriate copyright owners, except as specifically provided below. Information and statistics are copyright © and/or other intellectual property of the World Gold Council or its affiliates or third-party providers identified herein. All rights of the respective owners are reserved.
The use of the statistics in this information is permitted for the purposes of review and commentary (including media commentary) in line with fair industry practice, subject to the following two pre-conditions: (i) only limited extracts of data or analysis be used; and (ii) any and all use of these statistics is accompanied by a citation to World Gold Council and, where appropriate, to Metals Focus or other identified copyright owners as their source. World Gold Council is affiliated with Metals Focus.
The World Gold Council and its affiliates do not guarantee the accuracy or completeness of any information nor accept responsibility for any losses or damages arising directly or indirectly from the use of this information.
This information is for educational purposes only and by receiving this information, you agree with its intended purpose. Nothing contained herein is intended to constitute a recommendation, investment advice, or offer for the purchase or sale of gold, any gold-related products or services or any other products, services, securities or financial instruments (collectively, “Services”). This information does not take into account any investment objectives, financial situation or particular needs of any particular person.
Diversification does not guarantee any investment returns and does not eliminate the risk of loss. Past performance is not necessarily indicative of future results. The resulting performance of any investment outcomes that can be generated through allocation to gold are hypothetical in nature, may not reflect actual investment results and are not guarantees of future results. The World Gold Council and its affiliates do not guarantee or warranty any calculations and models used in any hypothetical portfolios or any outcomes resulting from any such use. Investors should discuss their individual circumstances with their appropriate investment professionals before making any decision regarding any Services or investments.
This information may contain forward-looking statements, such as statements which use the words “believes”, “expects”, “may”, or “suggests”, or similar terminology, which are based on current expectations and are subject to change. Forward-looking statements involve a number of risks and uncertainties. There can be no assurance that any forward-looking statements will be achieved. World Gold Council and its affiliates assume no responsibility for updating any forward-looking statements.
Information regarding the LBMA Gold Price
The LBMA Gold Price is used by the World Gold Council with permission under license by ICE Benchmark Administration Limited and is subject to the restrictions set forth here (www.gold.org/terms-and-conditions).
Information regarding QaurumSM and the Gold Valuation Framework
Note that the resulting performance of various investment outcomes that can be generated through use of Qaurum, the Gold Valuation Framework and other information are hypothetical in nature, may not reflect actual investment results and are not guarantees of future results. Neither World Gold Council (including its affiliates) nor Oxford Economics provides any warranty or guarantee regarding the functionality of the tool, including without limitation any projections, estimates or calculations.
Information from ICRA Analytics Limited
All information obtained from ICRA Analytics Limited contained in this document is subject to the disclaimer set forth here (www.icraanalytics.com/terms-of-use/disclaimer).
Weekly Markets Monitor - Testing gold’s resolve
Weekly Markets Monitor
Highlights
- Last week was marked by major central bank meetings and escalating geopolitical tensions. Most central banks, including the Fed, ECB, BoE, BoJ, held rates steady but highlighted rising inflation risks and signaled a hawkish bias, while the RBA hiked. Economic data was mixed, stronger in China but weaker across other major economies.
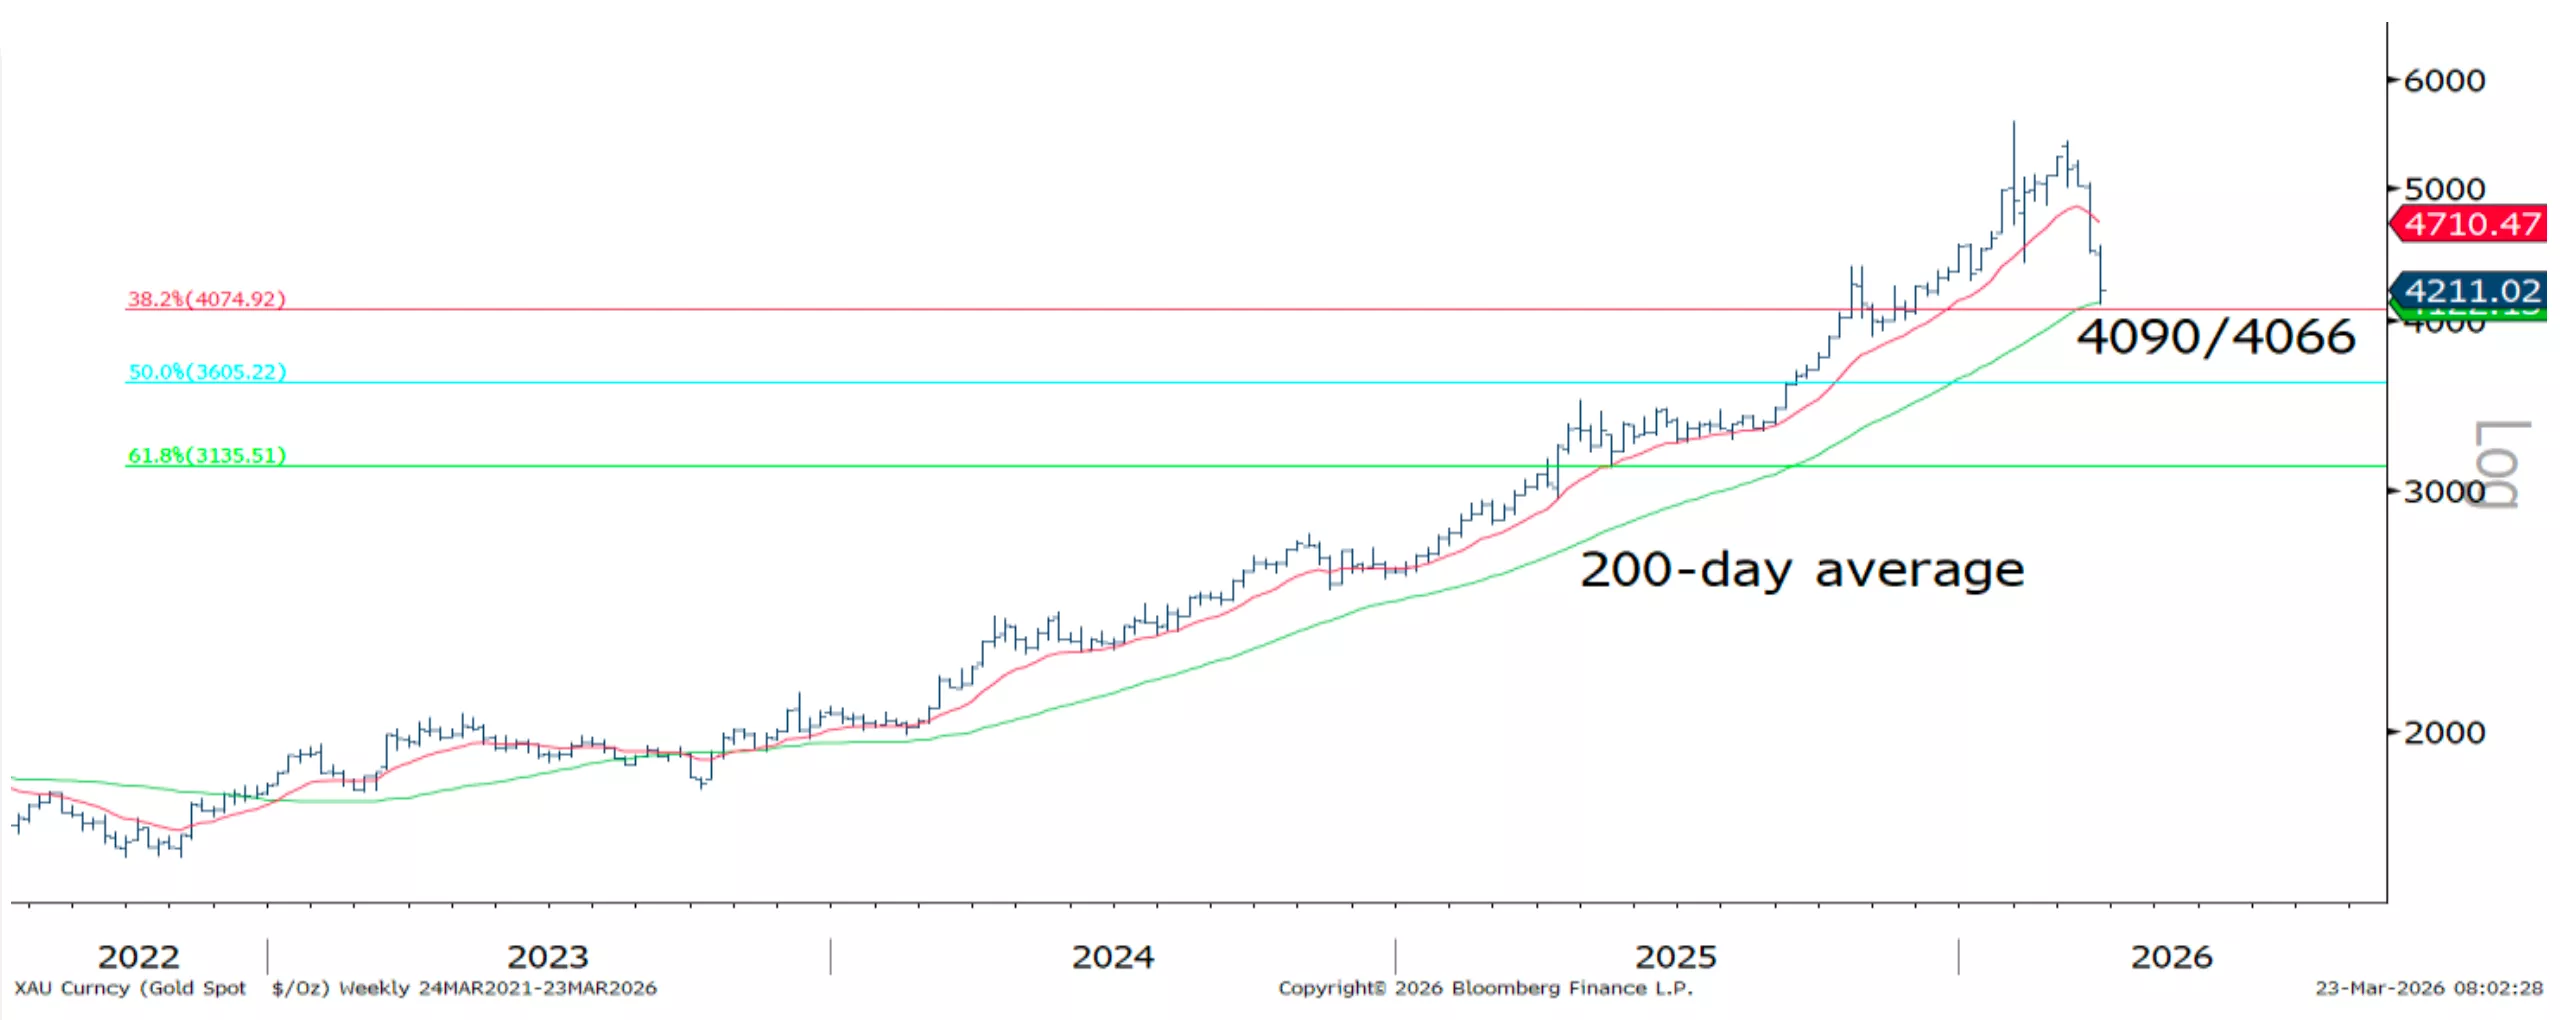
- Gold has fallen to new lows for the year as bond yields move sharply higher with next key support seen at US$4,090/oz – US$4,066/oz, which includes its long-term 200-day moving average and the 38.2% retracement of the 2022/2026 uptrend (C.O.T.W).
- The drivers of the weakness are currently debated. Sharply higher real yields and expectations that policy rates will now rise in 2026, alongside de‑leveraging and profit‑taking, have all weighed on sentiment. The speed and breadth of market moves echo risk‑off episodes seen in 2008 and 2020, when liquidity dynamics temporarily dominated fundamentals. The prospect of a prolonged Middle East conflict is concerning, as it raises humanitarian and geopolitical risks alongside the threat of economic stagnation and higher industrial input prices. We’re in wait-and-see mode.
Chart of the week: Testing gold’s resolve
Source: Bloomberg, World Gold Council
Disclaimer
Important information and disclaimers
© 2026 World Gold Council. All rights reserved. World Gold Council and the Circle device are trademarks of the World Gold Council or its affiliates.
All references to LBMA Gold Price are used with the permission of ICE Benchmark Administration Limited and have been provided for informational purposes only. ICE Benchmark Administration Limited accepts no liability or responsibility for the accuracy of the prices or the underlying product to which the prices may be referenced. Other content is the intellectual property of the respective third party and all rights are reserved to them.
Reproduction or redistribution of any of this information is expressly prohibited without the prior written consent of World Gold Council or the appropriate copyright owners, except as specifically provided below. Information and statistics are copyright © and/or other intellectual property of the World Gold Council or its affiliates or third-party providers identified herein. All rights of the respective owners are reserved.
The use of the statistics in this information is permitted for the purposes of review and commentary (including media commentary) in line with fair industry practice, subject to the following two pre-conditions: (i) only limited extracts of data or analysis be used; and (ii) any and all use of these statistics is accompanied by a citation to World Gold Council and, where appropriate, to Metals Focus or other identified copyright owners as their source. World Gold Council is affiliated with Metals Focus.
The World Gold Council and its affiliates do not guarantee the accuracy or completeness of any information nor accept responsibility for any losses or damages arising directly or indirectly from the use of this information.
This information is for educational purposes only and by receiving this information, you agree with its intended purpose. Nothing contained herein is intended to constitute a recommendation, investment advice, or offer for the purchase or sale of gold, any gold-related products or services or any other products, services, securities or financial instruments (collectively, “Services”). This information does not take into account any investment objectives, financial situation or particular needs of any particular person.
Diversification does not guarantee any investment returns and does not eliminate the risk of loss. Past performance is not necessarily indicative of future results. The resulting performance of any investment outcomes that can be generated through allocation to gold are hypothetical in nature, may not reflect actual investment results and are not guarantees of future results. The World Gold Council and its affiliates do not guarantee or warranty any calculations and models used in any hypothetical portfolios or any outcomes resulting from any such use. Investors should discuss their individual circumstances with their appropriate investment professionals before making any decision regarding any Services or investments.
This information may contain forward-looking statements, such as statements which use the words “believes”, “expects”, “may”, or “suggests”, or similar terminology, which are based on current expectations and are subject to change. Forward-looking statements involve a number of risks and uncertainties. There can be no assurance that any forward-looking statements will be achieved. World Gold Council and its affiliates assume no responsibility for updating any forward-looking statements.
Information regarding the LBMA Gold Price
The LBMA Gold Price is used by the World Gold Council with permission under license by ICE Benchmark Administration Limited and is subject to the restrictions set forth here (www.gold.org/terms-and-conditions).
Information regarding QaurumSM and the Gold Valuation Framework
Note that the resulting performance of various investment outcomes that can be generated through use of Qaurum, the Gold Valuation Framework and other information are hypothetical in nature, may not reflect actual investment results and are not guarantees of future results. Neither World Gold Council (including its affiliates) nor Oxford Economics provides any warranty or guarantee regarding the functionality of the tool, including without limitation any projections, estimates or calculations.
Information from ICRA Analytics Limited
All information obtained from ICRA Analytics Limited contained in this document is subject to the disclaimer set forth here (www.icraanalytics.com/terms-of-use/disclaimer).
Get updates in your inbox
Get email updates
Weekly Markets Monitor - Conflict pressure mounts
Weekly Markets Monitor
Highlights
- Geopolitics and rising energy prices dominated markets last week, raising stagflation concerns. Early signs of fallout from the Middle East conflict are emerging, with softer PMIs across several economies. In the US, consumer sentiment weakened as inflation expectations rose. UK inflation held steady in February but faces upward pressure from higher energy costs, while Japan’s inflation eased on subsidies. China’s industrial profits rose, pointing to a firmer recovery
- Major global equities closed the week lower, a bond sell-off drove yields higher, while the US dollar strengthened and oil prices rose.
- Our take on the Deutsche Bank ‘Pressure Index’**, suggests we are above levels where the US administration has previously issued rhetoric or strategic reversals of key policies (C.O.T.W). The reaction of index components: the 10-year Treasury yield, S&P 500, approval ratings and inflation expectations to the Middle East conflict was swift and sharp. Whether a de-escalation will happen is unclear. Following its recent liquidity-led retracement, gold appears to have stabilised with short-term risks facing off against constructive medium-term fundamentals.
Chart of the week: Conflict pressure mounts
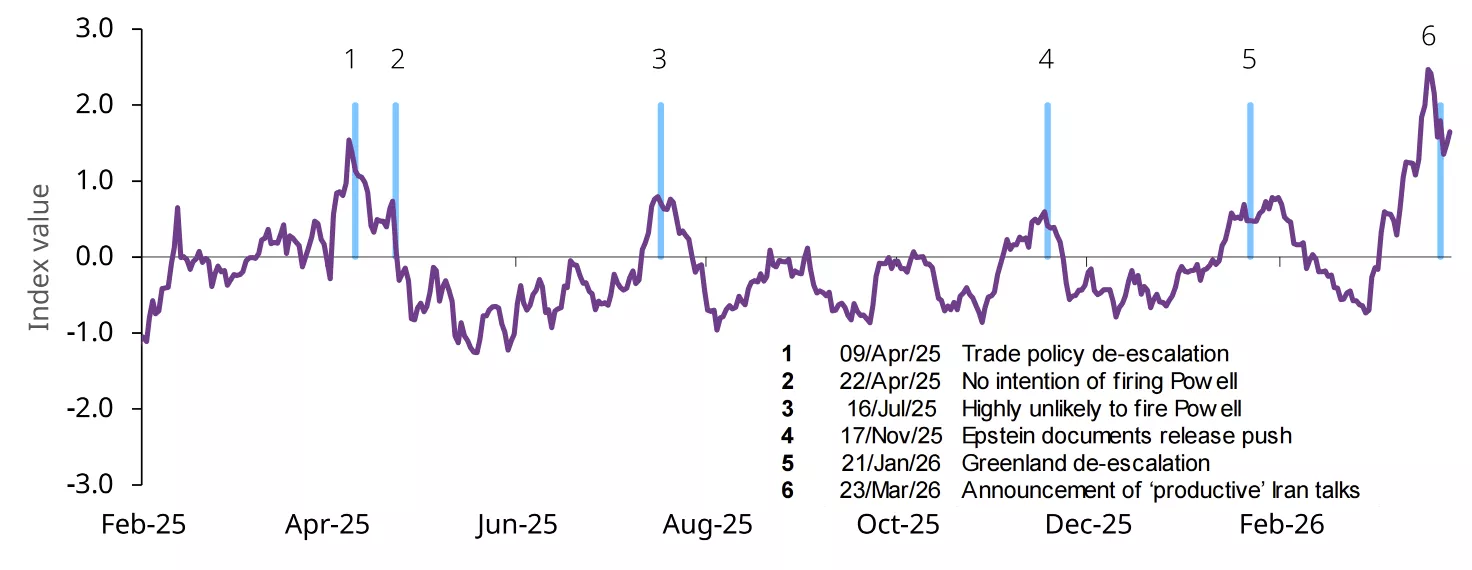
Our version of Deutsche Bank’s “Pressure Index” uses the 20-day change in four variables: US 10-year Treasury yield, S&P 500, 1-year inflation expectations, Presidential approval ratings (RealClear). These are standardised and equally weighted as an index.
Source: Bloomberg, World Gold Council
Disclaimer
Important information and disclaimers
© 2026 World Gold Council. All rights reserved. World Gold Council and the Circle device are trademarks of the World Gold Council or its affiliates.
All references to LBMA Gold Price are used with the permission of ICE Benchmark Administration Limited and have been provided for informational purposes only. ICE Benchmark Administration Limited accepts no liability or responsibility for the accuracy of the prices or the underlying product to which the prices may be referenced. Other content is the intellectual property of the respective third party and all rights are reserved to them.
Reproduction or redistribution of any of this information is expressly prohibited without the prior written consent of World Gold Council or the appropriate copyright owners, except as specifically provided below. Information and statistics are copyright © and/or other intellectual property of the World Gold Council or its affiliates or third-party providers identified herein. All rights of the respective owners are reserved.
The use of the statistics in this information is permitted for the purposes of review and commentary (including media commentary) in line with fair industry practice, subject to the following two pre-conditions: (i) only limited extracts of data or analysis be used; and (ii) any and all use of these statistics is accompanied by a citation to World Gold Council and, where appropriate, to Metals Focus or other identified copyright owners as their source. World Gold Council is affiliated with Metals Focus.
The World Gold Council and its affiliates do not guarantee the accuracy or completeness of any information nor accept responsibility for any losses or damages arising directly or indirectly from the use of this information.
This information is for educational purposes only and by receiving this information, you agree with its intended purpose. Nothing contained herein is intended to constitute a recommendation, investment advice, or offer for the purchase or sale of gold, any gold-related products or services or any other products, services, securities or financial instruments (collectively, “Services”). This information does not take into account any investment objectives, financial situation or particular needs of any particular person.
Diversification does not guarantee any investment returns and does not eliminate the risk of loss. Past performance is not necessarily indicative of future results. The resulting performance of any investment outcomes that can be generated through allocation to gold are hypothetical in nature, may not reflect actual investment results and are not guarantees of future results. The World Gold Council and its affiliates do not guarantee or warranty any calculations and models used in any hypothetical portfolios or any outcomes resulting from any such use. Investors should discuss their individual circumstances with their appropriate investment professionals before making any decision regarding any Services or investments.
This information may contain forward-looking statements, such as statements which use the words “believes”, “expects”, “may”, or “suggests”, or similar terminology, which are based on current expectations and are subject to change. Forward-looking statements involve a number of risks and uncertainties. There can be no assurance that any forward-looking statements will be achieved. World Gold Council and its affiliates assume no responsibility for updating any forward-looking statements.
Information regarding the LBMA Gold Price
The LBMA Gold Price is used by the World Gold Council with permission under license by ICE Benchmark Administration Limited and is subject to the restrictions set forth here (www.gold.org/terms-and-conditions).
Information regarding QaurumSM and the Gold Valuation Framework
Note that the resulting performance of various investment outcomes that can be generated through use of Qaurum, the Gold Valuation Framework and other information are hypothetical in nature, may not reflect actual investment results and are not guarantees of future results. Neither World Gold Council (including its affiliates) nor Oxford Economics provides any warranty or guarantee regarding the functionality of the tool, including without limitation any projections, estimates or calculations.
Information from ICRA Analytics Limited
All information obtained from ICRA Analytics Limited contained in this document is subject to the disclaimer set forth here (www.icraanalytics.com/terms-of-use/disclaimer).
Get updates in your inbox
Get email updates
Weekly Markets Monitor - 21 tonne salute
Weekly Markets Monitor
Highlights
- In a holiday-shortened and geo-politically volatile week, economic data came in stronger than expected—US jobs, manufacturing, retail sales, and confidence all beat forecasts. China showed improving economic momentum and India’s manufacturing output rose. At the same time, in the Eurozone, price pressures from the surge in energy costs are emerging.
- Gold continues to stabilize above key technical supports including its rising long-term 200-day average.
- Global gold ETFs have recorded a 21‑tonne inflow to start April - a notable show of support across regions. With market and liquidity stress subsiding, as evidenced by falling VIX and MOVE implied volatility indices, attention may now shift back to the longer‑term structural drivers that have supported gold over recent years (C.O.T.W).
Chart of the week: 21 tonne salute
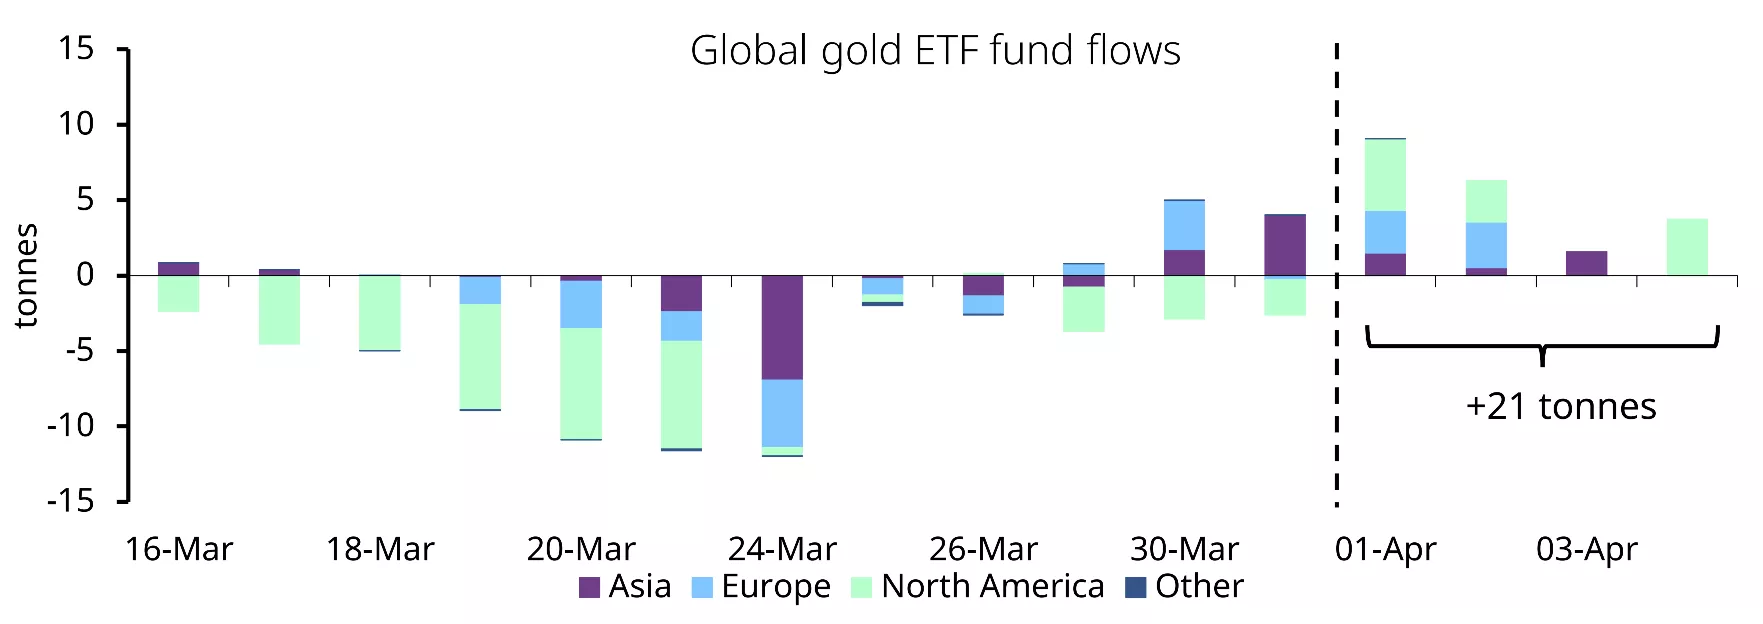
Daily ETF fund flow data is subject to possible revision. As of 3 April.
Source: World Gold Council
Disclaimer
Important information and disclaimers
© 2026 World Gold Council. All rights reserved. World Gold Council and the Circle device are trademarks of the World Gold Council or its affiliates.
All references to LBMA Gold Price are used with the permission of ICE Benchmark Administration Limited and have been provided for informational purposes only. ICE Benchmark Administration Limited accepts no liability or responsibility for the accuracy of the prices or the underlying product to which the prices may be referenced. Other content is the intellectual property of the respective third party and all rights are reserved to them.
Reproduction or redistribution of any of this information is expressly prohibited without the prior written consent of World Gold Council or the appropriate copyright owners, except as specifically provided below. Information and statistics are copyright © and/or other intellectual property of the World Gold Council or its affiliates or third-party providers identified herein. All rights of the respective owners are reserved.
The use of the statistics in this information is permitted for the purposes of review and commentary (including media commentary) in line with fair industry practice, subject to the following two pre-conditions: (i) only limited extracts of data or analysis be used; and (ii) any and all use of these statistics is accompanied by a citation to World Gold Council and, where appropriate, to Metals Focus or other identified copyright owners as their source. World Gold Council is affiliated with Metals Focus.
The World Gold Council and its affiliates do not guarantee the accuracy or completeness of any information nor accept responsibility for any losses or damages arising directly or indirectly from the use of this information.
This information is for educational purposes only and by receiving this information, you agree with its intended purpose. Nothing contained herein is intended to constitute a recommendation, investment advice, or offer for the purchase or sale of gold, any gold-related products or services or any other products, services, securities or financial instruments (collectively, “Services”). This information does not take into account any investment objectives, financial situation or particular needs of any particular person.
Diversification does not guarantee any investment returns and does not eliminate the risk of loss. Past performance is not necessarily indicative of future results. The resulting performance of any investment outcomes that can be generated through allocation to gold are hypothetical in nature, may not reflect actual investment results and are not guarantees of future results. The World Gold Council and its affiliates do not guarantee or warranty any calculations and models used in any hypothetical portfolios or any outcomes resulting from any such use. Investors should discuss their individual circumstances with their appropriate investment professionals before making any decision regarding any Services or investments.
This information may contain forward-looking statements, such as statements which use the words “believes”, “expects”, “may”, or “suggests”, or similar terminology, which are based on current expectations and are subject to change. Forward-looking statements involve a number of risks and uncertainties. There can be no assurance that any forward-looking statements will be achieved. World Gold Council and its affiliates assume no responsibility for updating any forward-looking statements.
Information regarding the LBMA Gold Price
The LBMA Gold Price is used by the World Gold Council with permission under license by ICE Benchmark Administration Limited and is subject to the restrictions set forth here (www.gold.org/terms-and-conditions).
Information regarding QaurumSM and the Gold Valuation Framework
Note that the resulting performance of various investment outcomes that can be generated through use of Qaurum, the Gold Valuation Framework and other information are hypothetical in nature, may not reflect actual investment results and are not guarantees of future results. Neither World Gold Council (including its affiliates) nor Oxford Economics provides any warranty or guarantee regarding the functionality of the tool, including without limitation any projections, estimates or calculations.
Information from ICRA Analytics Limited
All information obtained from ICRA Analytics Limited contained in this document is subject to the disclaimer set forth here (www.icraanalytics.com/terms-of-use/disclaimer).
Get updates in your inbox
Get email updates
China gold market update: A seasonal demand rebound in March
Ray Jia
Head of Research (Asia Pacific, ex-India) and Deputy Head of Trade Engagement (China) World Gold CouncilHighlights
- Gold ended Q1 with a weak March; both the LBMA Gold Price PM in USD and the Shanghai Gold Benchmark Price PM (SHAUPM) in RMB pulled back, trimming Q1 gains
- Gold’s price recovery at the end of March extended into April with global investors adding gold back into their portfolios
- Wholesale demand in March rebounded seasonally by 57% m/m to 134t, pushing the Q1 total 3% higher y/y to 345t, with strong investment buying offsetting weakness in the jewellery sector
- Chinese gold ETFs continued to expand in the month, ending Q1 with record inflows of RMB59bn (US$8.5bn); total assets under management (AUM) soared 26% to RMB304bn (US$44bn) and holdings rose 50t to 298t
- The People’s Bank of China (PBoC) reported its 17th consecutive gold purchase in March, lifting its gold holdings 5t to 2,313t; 9% of total foreign reserves. China’s official gold holdings rose by 7t in Q1.
Looking ahead
- Q2 is the traditional off season for jewellery consumption but a boost may come should the gold price stabilise. Investment demand strength may gain support from declining bond yields and the lack of other local investment opportunities – but the gold price trajectory will remain key to investor decisions. More detailed Q2 outlook and Q1 review will be included in our Gold Demand Trends report coming up on 29 April.
A weak March capped gold’s Q1 gain
Gold plunged in March. The LBMA Gold Price PM in USD fell 12% in the month, weighed by rapidly cooling expectations of future Fed cuts – due to inflationary fears stemming from the Middle East war – and momentum factors as investors unwind their positions in futures, ETFs and options. The SHAUPM saw a similar pullback of 11% although a depreciating local currency limited the extent of the decline.
A weak March trimmed gold’s Q1 gain. The international gold price in dollars and the Chinese benchmark in RMB both registered a 7% rise in the first quarter (Chart 1). Despite a turbulent quarter for gold, signs of recovery were evident towards the end of March and in early April.
Chart 1: Gold’s Q1 performance remained attractive
Q1 returns of Au9999 in RMB and LBMA Gold Price PM in USD*
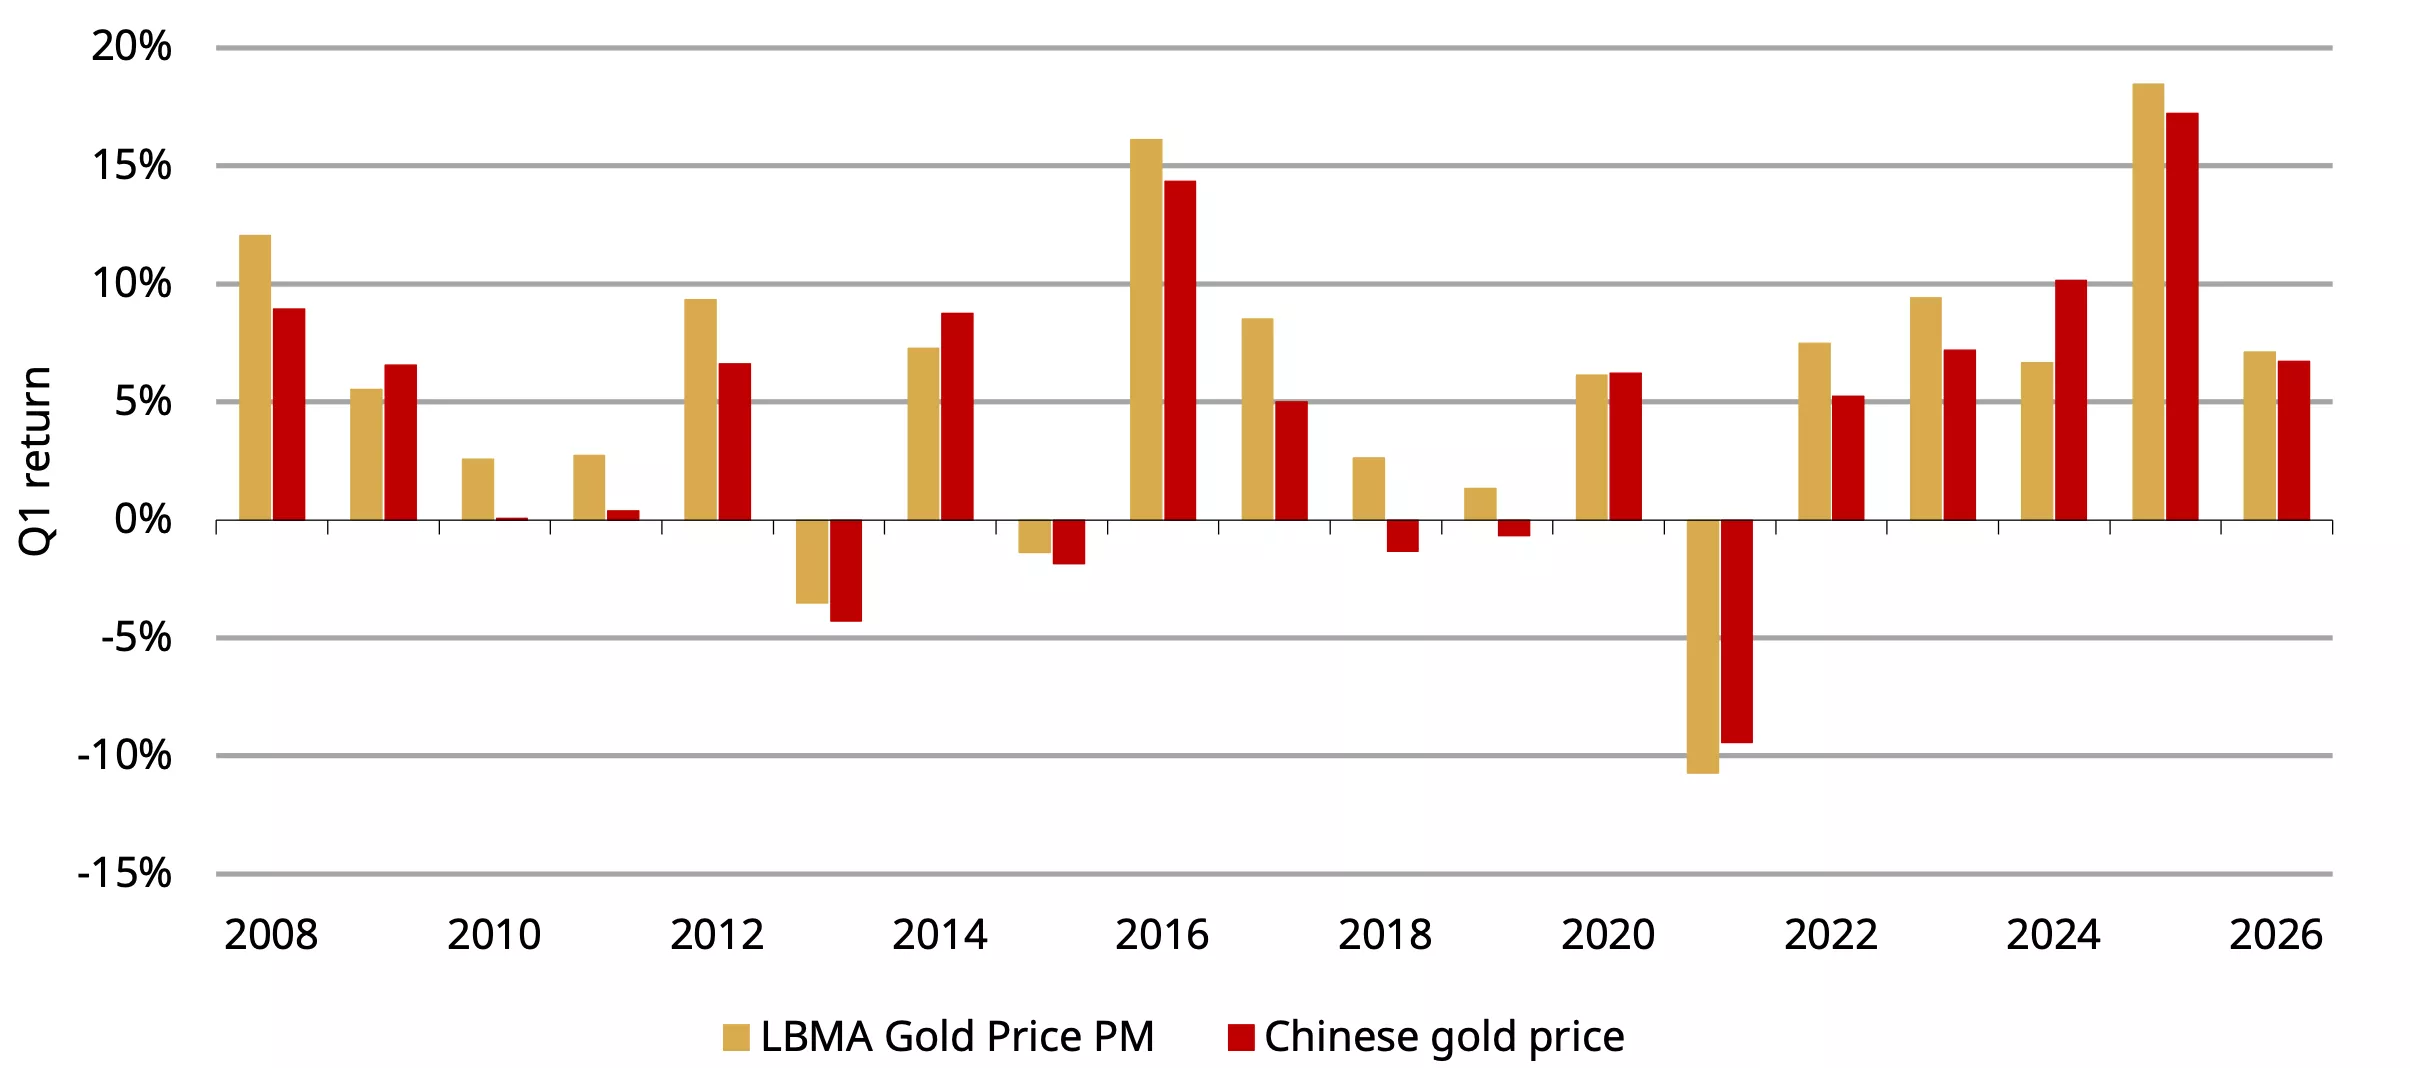
*Data to March 2026. Chinese gold price based on Au9999 as SHAUPM only dates back to 2016.
Source: Shanghai Gold Exchange, ICE Benchmark Administration, World Gold Council
Wholesale gold demand ended Q1 with a seasonal rebound
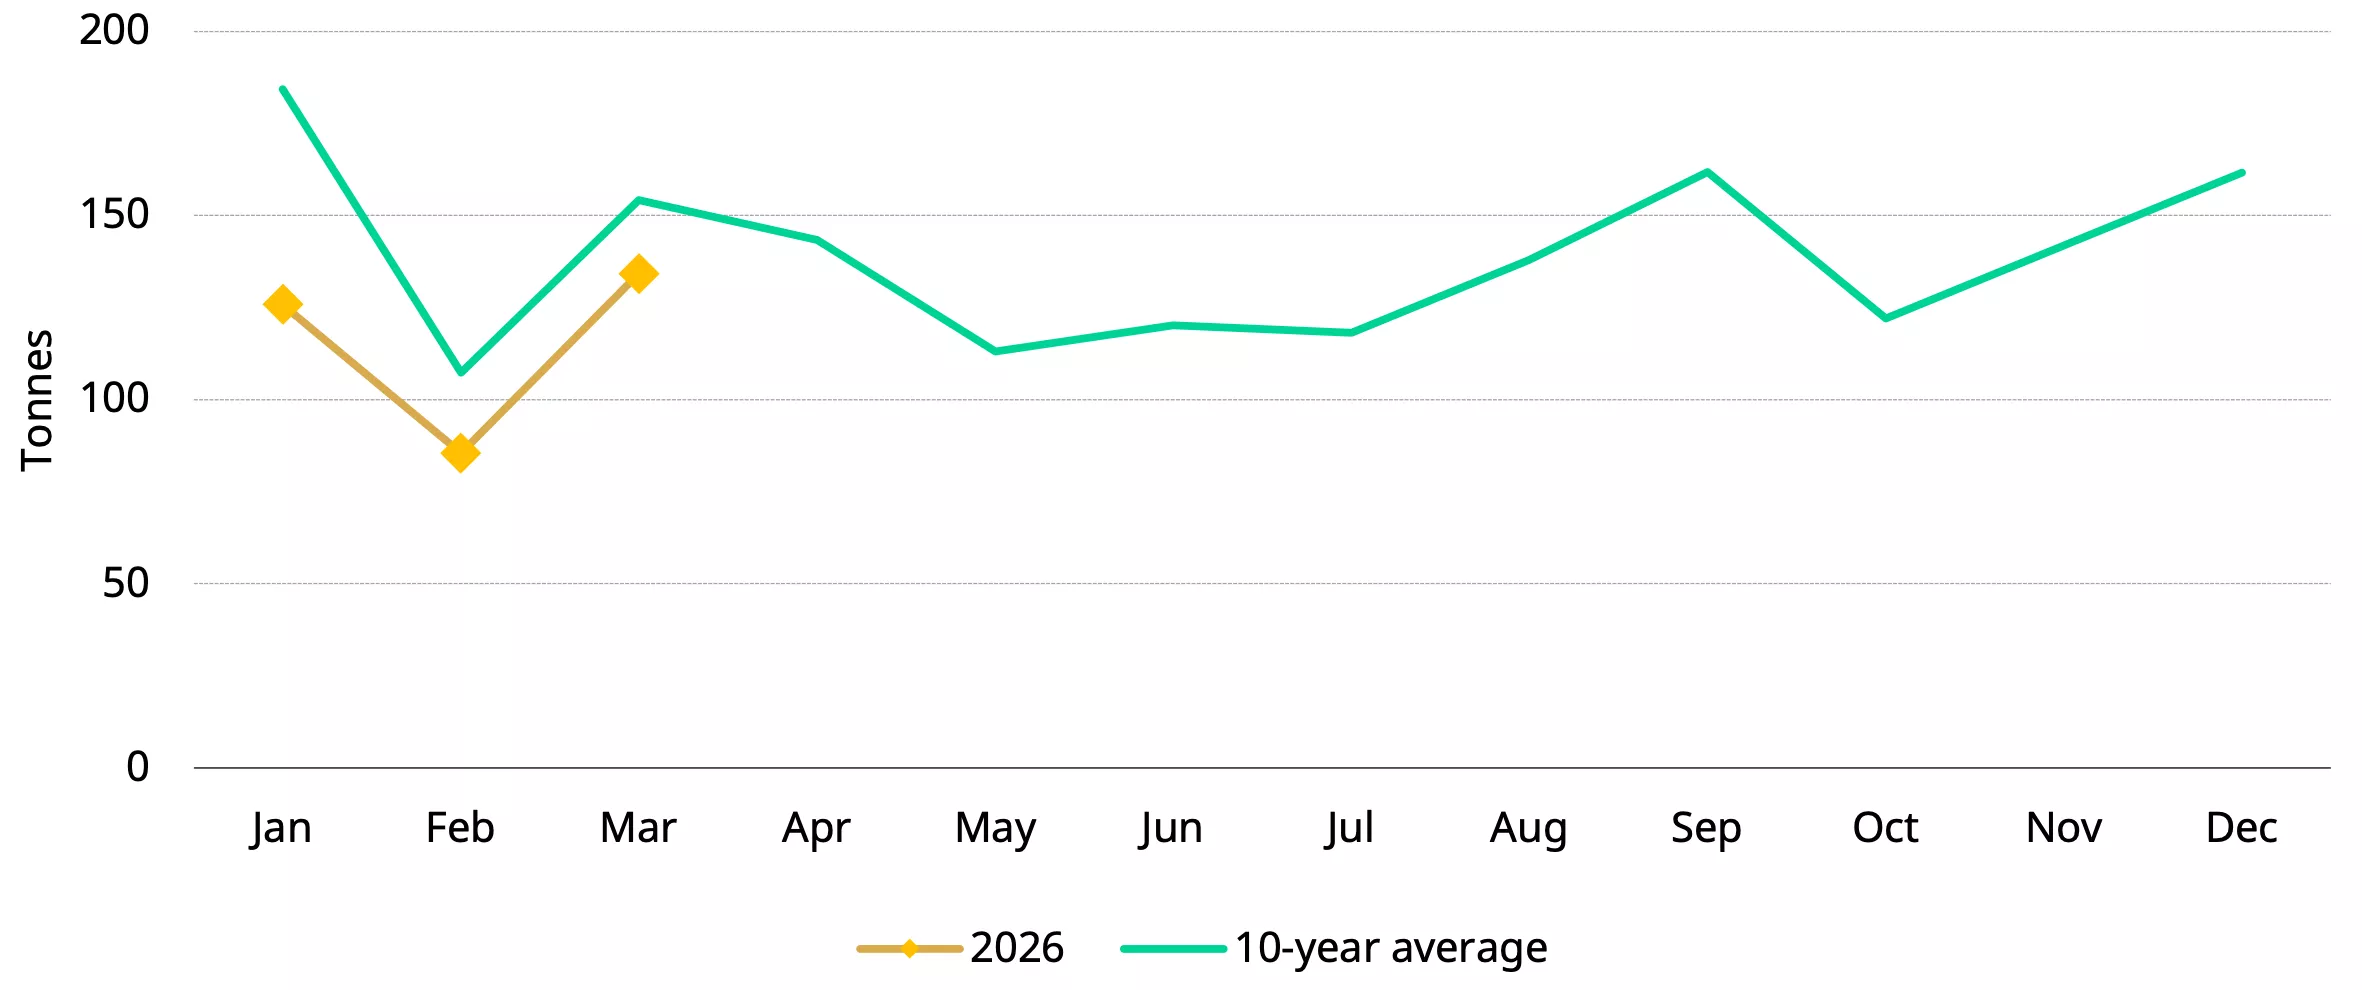
Banks, jewellers and refiners withdrew 134t of gold from the SGE in March (Chart 2), marking a 57% m/m rebound and a 12% increase y/y. The m/m recovery was largely seasonal, reflecting more working days in March (22 vs 14 in February) and post–Chinese New Year restocking by industry participants. We believe the gold price pullback also encouraged opportunistic replenishment.
This price dynamic likely contributed to the y/y increase as well, as the sharp gold price rally in March last year had dampened jewellers’ restocking appetite. Nevertheless, the month’s wholesale demand remained below its ten‑year average, underscoring continued weakness in the jewellery sector.
A firmer March lifted Q1 wholesale gold demand to 345t – 3% higher y/y but still 23% below the ten‑year average. Overall, Chinese gold demand continued to diverge in line with trends observed in 2025: as gold prices surged through most of Q1, strong investment demand offset persistent weakness in gold jewellery consumption.
Chart 2: Wholesale gold demand rebounded seasonally in March
Gold withdrawals from the SGE by month and the ten-year monthly average*
*Ten-year average based on data between 2016 and 2025.
Source: Shanghai Gold Exchange, World Gold Council
Chinese gold ETFs saw non-stop inflows throughout Q1
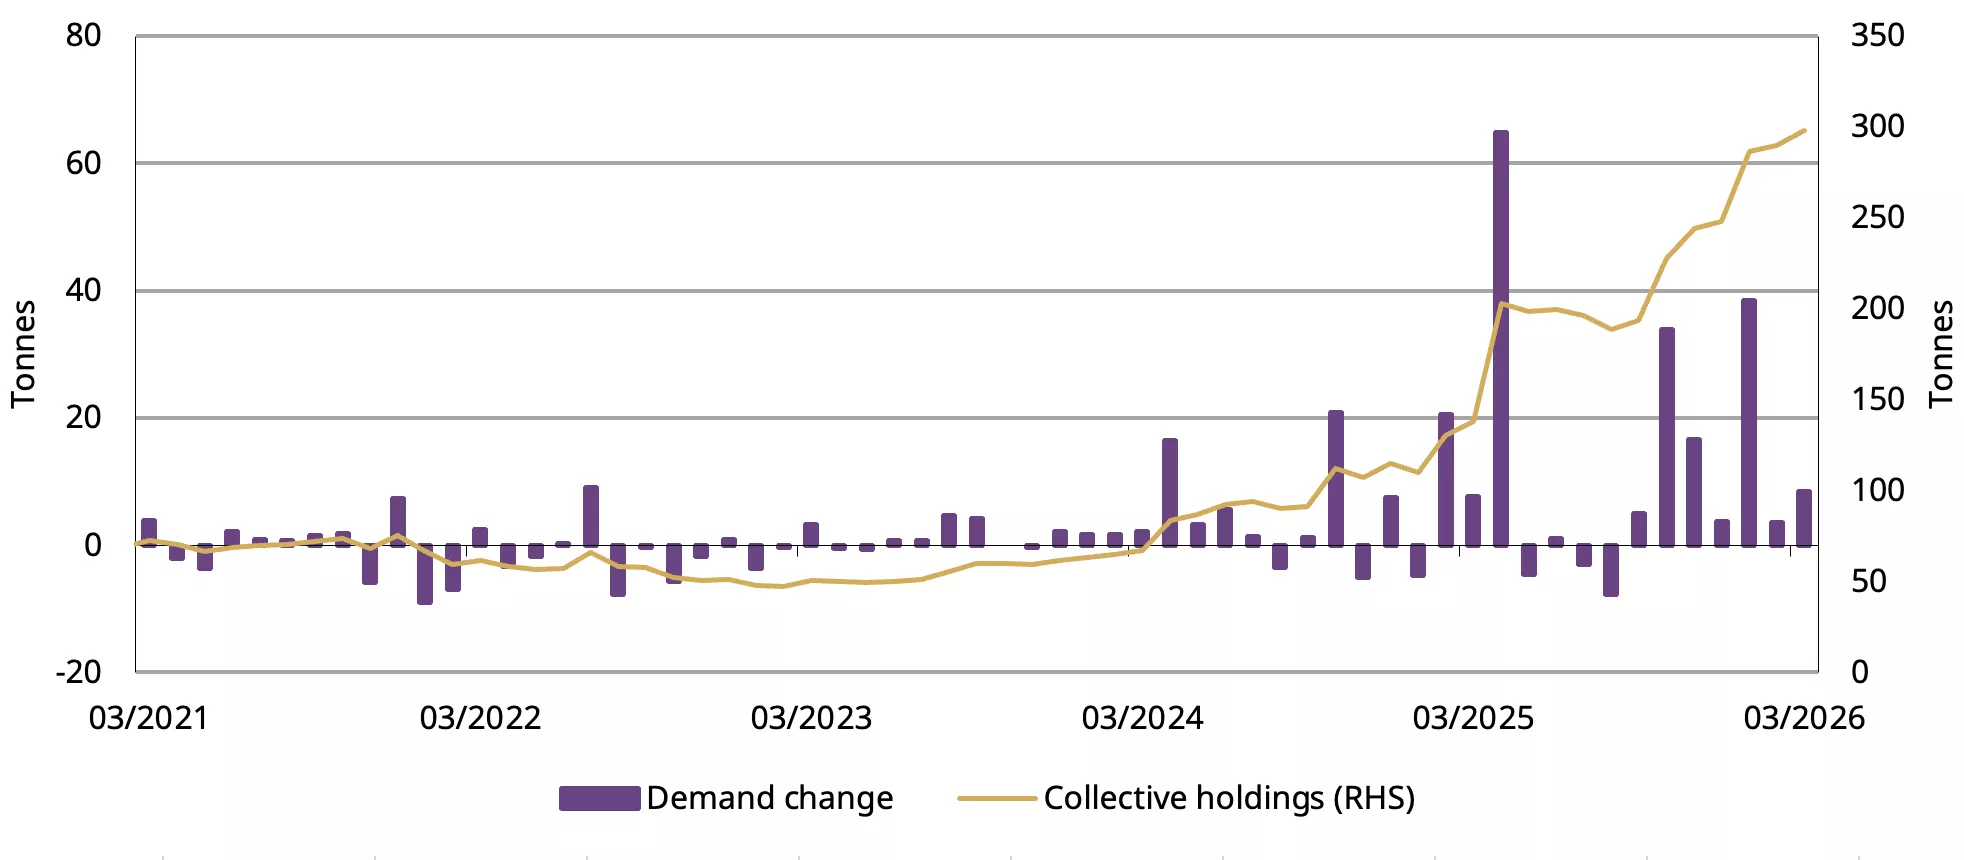
Chinese gold ETFs have now seen inflows for seven months in a row, attracting RMB12bn (US$1.7bn) in March, equivalent to a 8.4t rise in holdings (Chart 3). The plummeting local gold price did not interrupt Chinese investor appetite for gold ETFs. In March, the CSI300 stock index fell 6% and the local currency depreciated by 0.8% against the dollar; these factors, combined with safe-haven demand prompted by the US-Israel-Iran war, and continued regional geopolitical tensions supported local gold ETF buying. We also witnessed some dip buying during the first half of the month.
Chinese investors bought a total of RMB59bn (US$8.5bn, 50t) of gold ETFs in Q1, shattering the previous quarter’s record. This is the strongest quarter ever: Chinese gold ETFs’ total AUM – supported by the price increase and inflows – rose 26% to RMB304bn (US$44bn) and holdings climbed to 298t, both reaching quarter-end peaks.
Chart 3: Chinese gold ETFs kept expanding in March
Chinese gold ETF demand and holdings in tonnes*
*Data to 31 March 2026.
Source: Company filings, World Gold Council
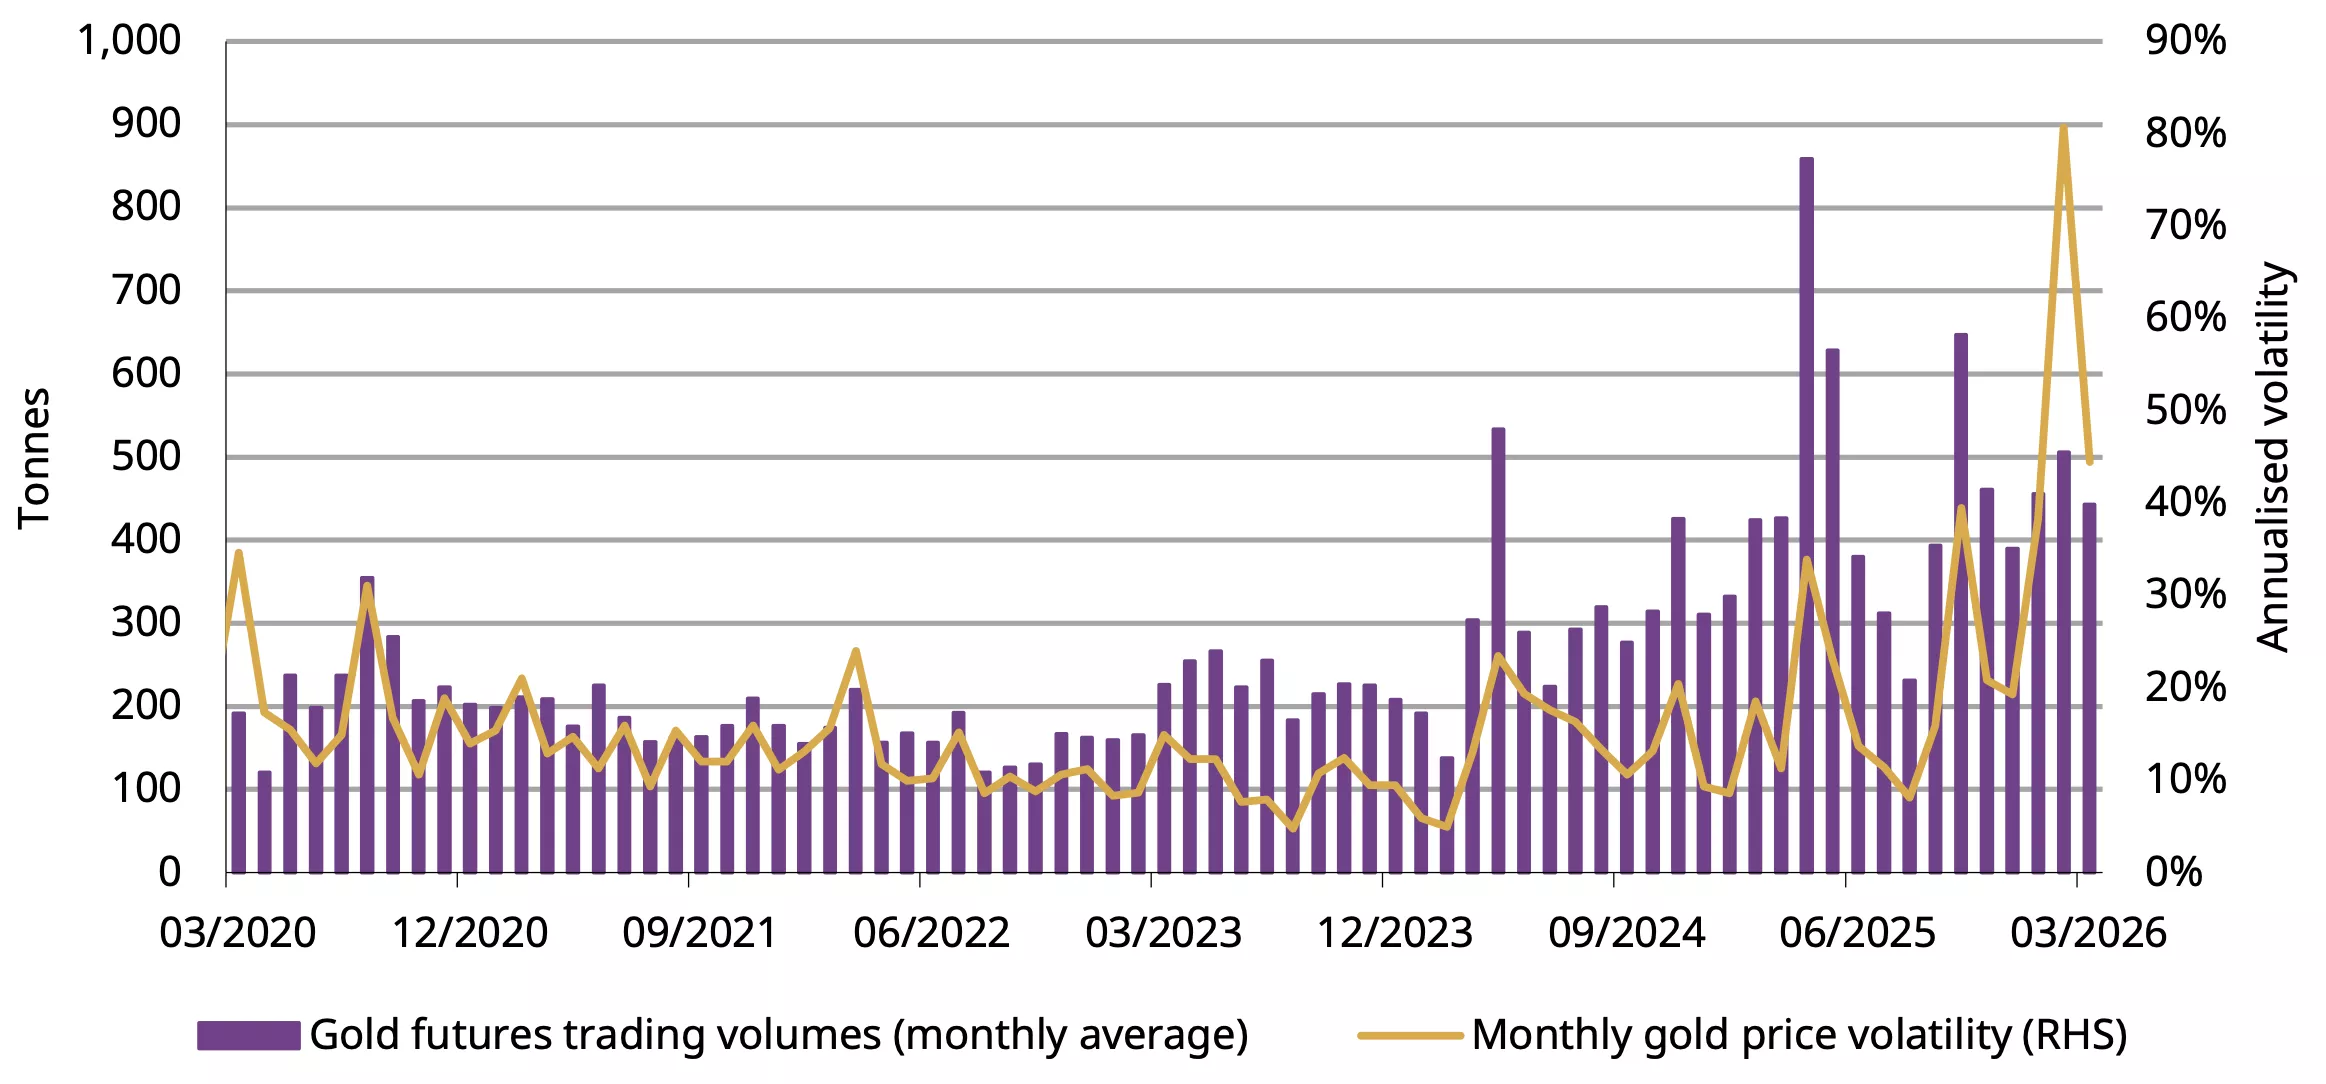
Chinese gold futures trading volumes fell by 12% m/m to an average of 443t/day in March. We believe the decline can be largely attributed to lower gold price volatility and a weakening gold price performance, factors that dimmed trader interest (Chart 4). Over the course of Q1 gold futures trading at the Shanghai Futures Exchange (SHFE) averaged 468t per day in volumes, well above the five-year average of 265t/day.
Chart 4: Gold futures trading cooled in March
Daily average trading volumes of SHFE gold futures and monthly gold price volatility*
*As of 31 March 2026.
Source: Shanghai Futures Exchange, World Gold Council
The PBoC bought gold on dip in March
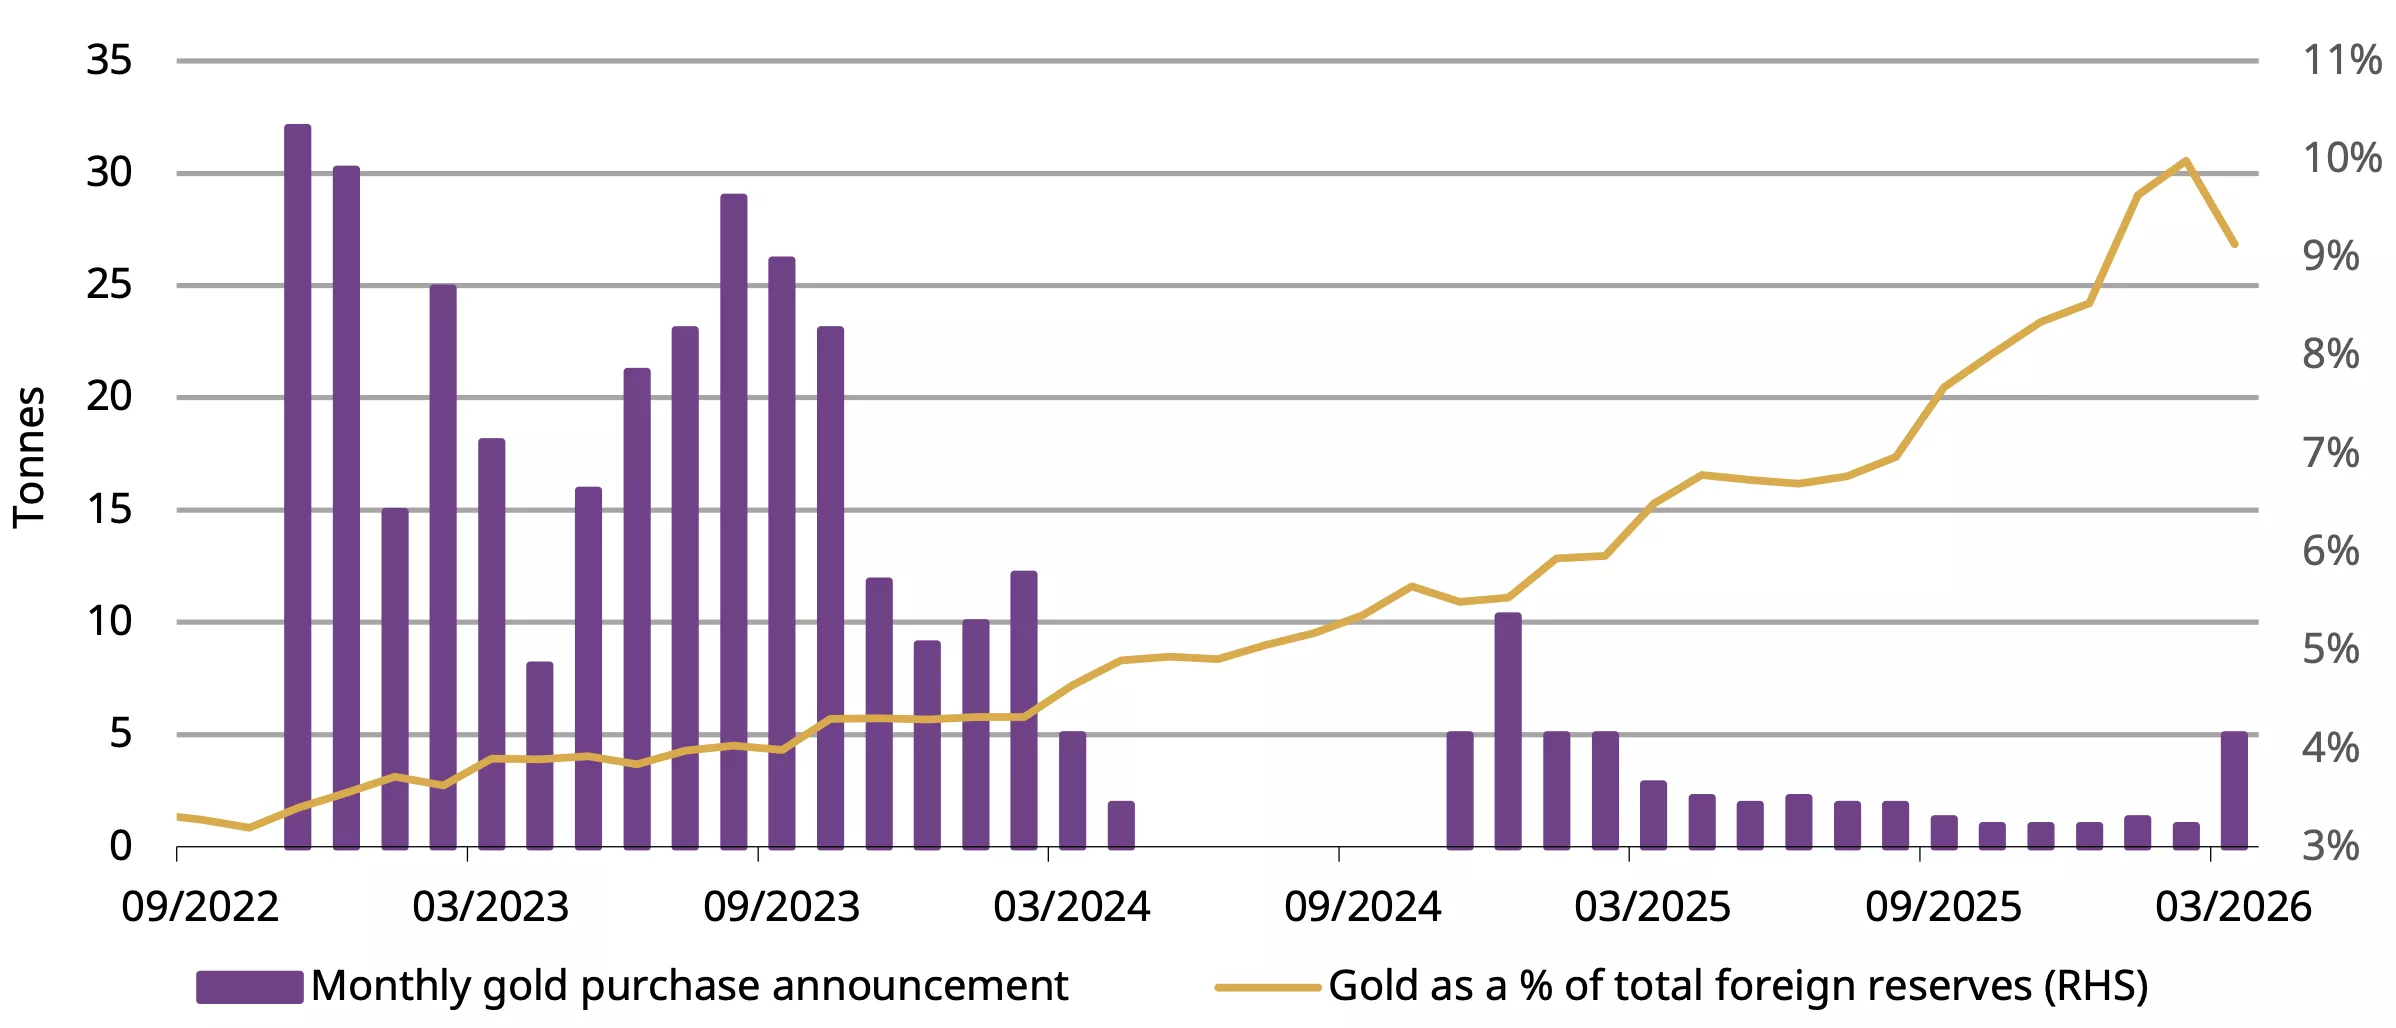
The PBoC announced its 17th consecutive monthly gold purchase in March. This 5t addition, the largest since February 2025, pushed China’s official gold holdings to 2,313t (Chart 5). Gold now accounts for 9% of China’s foreign exchange reserves, down from February’s 10% due mainly to the gold price pullback in March. Non-stop buying throughout the quarter has accumulated an additional 7t of gold for the Chinese central bank, the highest since Q1 2025.
Chart 5: Strong gold buying from the PBoC amidst the gold price adjustment in March
The PBoC’s reported gold purchases and gold’s share of total foreign exchange reserves*
*Data to March 2026.
Source: State Administration of Foreign Exchanges, World Gold Council
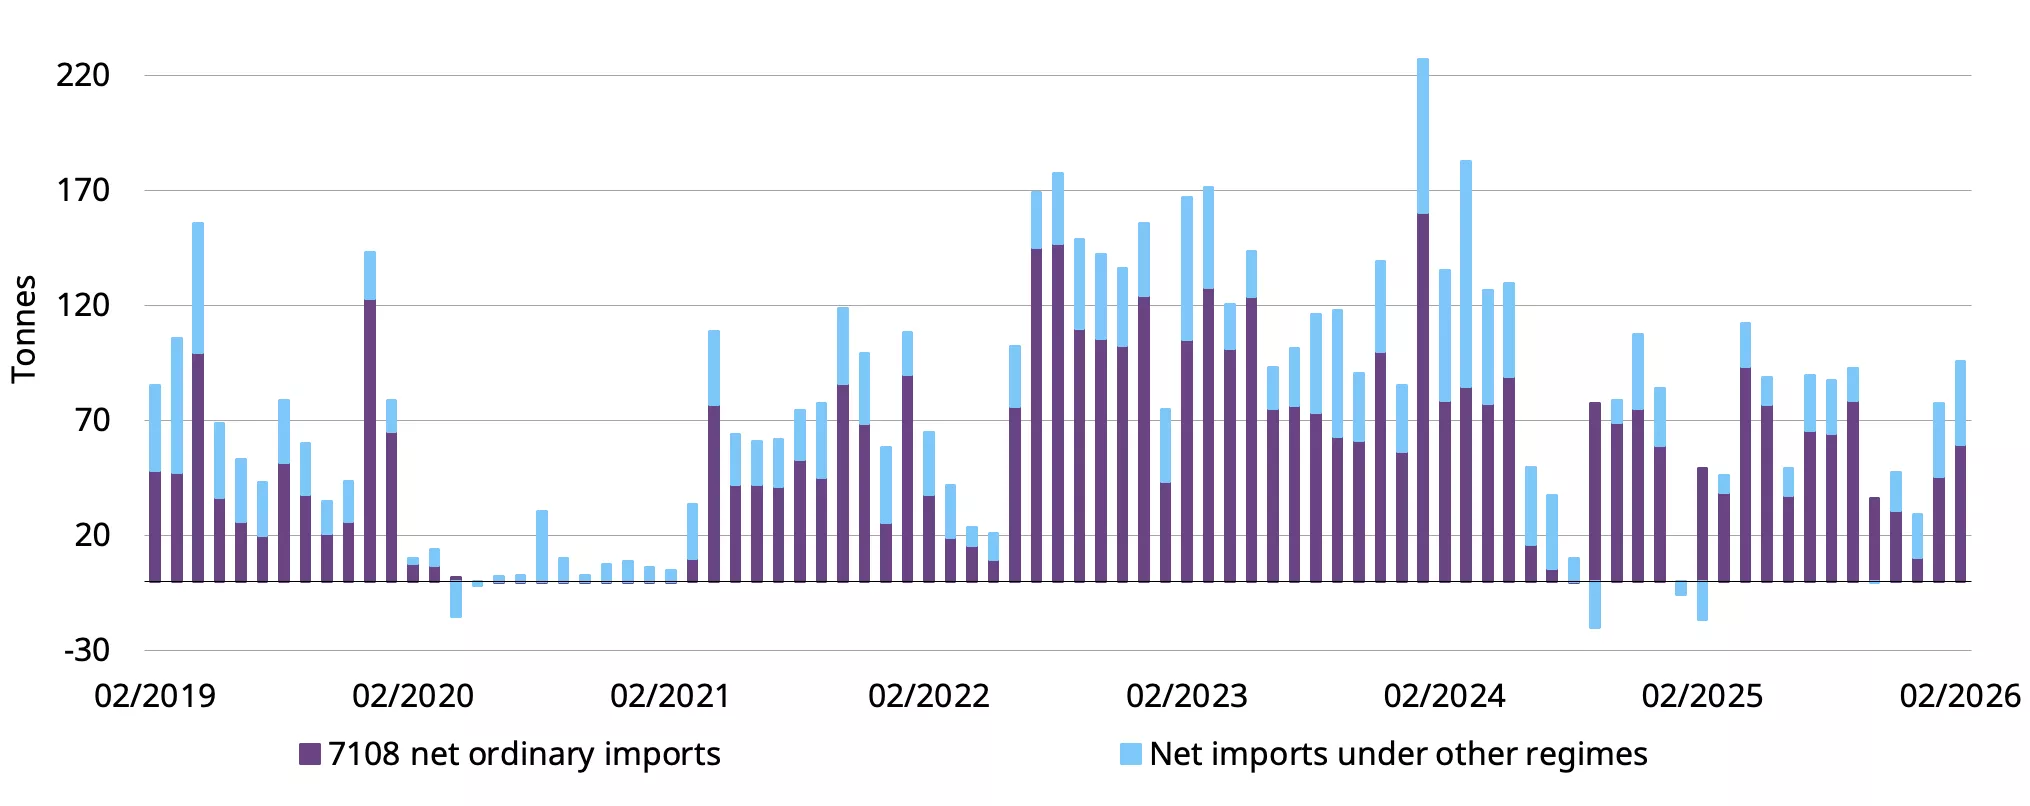
Imports rose at the start of the year
China’s gold imports picked up at the beginning of 2026, according to the latest data from China Customs (Chart 6). January net imports reached 77t, a significant increase compared to the net exports of 6t last year. Net imports in February totalled 96t, 63t higher y/y. This robustness was underpinned by resilient demand during the month, and the rebounding local gold price premium also boosted importer interest.
Chart 6: Gold imports rebounded at the start of 2026
Net gold imports under HS code 7108*
*Data to February 2026.
Source: China Customs, World Gold Council
Disclaimer
Important information and disclaimers
© 2026 World Gold Council. All rights reserved. World Gold Council and the Circle device are trademarks of the World Gold Council or its affiliates.
All references to LBMA Gold Price are used with the permission of ICE Benchmark Administration Limited and have been provided for informational purposes only. ICE Benchmark Administration Limited accepts no liability or responsibility for the accuracy of the prices or the underlying product to which the prices may be referenced. Other content is the intellectual property of the respective third party and all rights are reserved to them.
Reproduction or redistribution of any of this information is expressly prohibited without the prior written consent of World Gold Council or the appropriate copyright owners, except as specifically provided below. Information and statistics are copyright © and/or other intellectual property of the World Gold Council or its affiliates or third-party providers identified herein. All rights of the respective owners are reserved.
The use of the statistics in this information is permitted for the purposes of review and commentary (including media commentary) in line with fair industry practice, subject to the following two pre-conditions: (i) only limited extracts of data or analysis be used; and (ii) any and all use of these statistics is accompanied by a citation to World Gold Council and, where appropriate, to Metals Focus or other identified copyright owners as their source. World Gold Council is affiliated with Metals Focus.
The World Gold Council and its affiliates do not guarantee the accuracy or completeness of any information nor accept responsibility for any losses or damages arising directly or indirectly from the use of this information.
This information is for educational purposes only and by receiving this information, you agree with its intended purpose. Nothing contained herein is intended to constitute a recommendation, investment advice, or offer for the purchase or sale of gold, any gold-related products or services or any other products, services, securities or financial instruments (collectively, “Services”). This information does not take into account any investment objectives, financial situation or particular needs of any particular person.
Diversification does not guarantee any investment returns and does not eliminate the risk of loss. Past performance is not necessarily indicative of future results. The resulting performance of any investment outcomes that can be generated through allocation to gold are hypothetical in nature, may not reflect actual investment results and are not guarantees of future results. The World Gold Council and its affiliates do not guarantee or warranty any calculations and models used in any hypothetical portfolios or any outcomes resulting from any such use. Investors should discuss their individual circumstances with their appropriate investment professionals before making any decision regarding any Services or investments.
This information may contain forward-looking statements, such as statements which use the words “believes”, “expects”, “may”, or “suggests”, or similar terminology, which are based on current expectations and are subject to change. Forward-looking statements involve a number of risks and uncertainties. There can be no assurance that any forward-looking statements will be achieved. World Gold Council and its affiliates assume no responsibility for updating any forward-looking statements.
Information regarding the LBMA Gold Price
The LBMA Gold Price is used by the World Gold Council with permission under license by ICE Benchmark Administration Limited and is subject to the restrictions set forth here (www.gold.org/terms-and-conditions).
Information regarding QaurumSM and the Gold Valuation Framework
Note that the resulting performance of various investment outcomes that can be generated through use of Qaurum, the Gold Valuation Framework and other information are hypothetical in nature, may not reflect actual investment results and are not guarantees of future results. Neither World Gold Council (including its affiliates) nor Oxford Economics provides any warranty or guarantee regarding the functionality of the tool, including without limitation any projections, estimates or calculations.
Information from ICRA Analytics Limited
All information obtained from ICRA Analytics Limited contained in this document is subject to the disclaimer set forth here (www.icraanalytics.com/terms-of-use/disclaimer).
