China gold market update: A seasonal demand rebound in March
14 April, 2026
Highlights
- Gold ended Q1 with a weak March; both the LBMA Gold Price PM in USD and the Shanghai Gold Benchmark Price PM (SHAUPM) in RMB pulled back, trimming Q1 gains
- Gold’s price recovery at the end of March extended into April with global investors adding gold back into their portfolios
- Wholesale demand in March rebounded seasonally by 57% m/m to 134t, pushing the Q1 total 3% higher y/y to 345t, with strong investment buying offsetting weakness in the jewellery sector
- Chinese gold ETFs continued to expand in the month, ending Q1 with record inflows of RMB59bn (US$8.5bn); total assets under management (AUM) soared 26% to RMB304bn (US$44bn) and holdings rose 50t to 298t
- The People’s Bank of China (PBoC) reported its 17th consecutive gold purchase in March, lifting its gold holdings 5t to 2,313t; 9% of total foreign reserves. China’s official gold holdings rose by 7t in Q1.
Looking ahead
- Q2 is the traditional off season for jewellery consumption but a boost may come should the gold price stabilise. Investment demand strength may gain support from declining bond yields and the lack of other local investment opportunities – but the gold price trajectory will remain key to investor decisions. More detailed Q2 outlook and Q1 review will be included in our Gold Demand Trends report coming up on 29 April.
A weak March capped gold’s Q1 gain
Gold plunged in March. The LBMA Gold Price PM in USD fell 12% in the month, weighed by rapidly cooling expectations of future Fed cuts – due to inflationary fears stemming from the Middle East war – and momentum factors as investors unwind their positions in futures, ETFs and options. The SHAUPM saw a similar pullback of 11% although a depreciating local currency limited the extent of the decline.
A weak March trimmed gold’s Q1 gain. The international gold price in dollars and the Chinese benchmark in RMB both registered a 7% rise in the first quarter (Chart 1). Despite a turbulent quarter for gold, signs of recovery were evident towards the end of March and in early April.
Chart 1: Gold’s Q1 performance remained attractive
Q1 returns of Au9999 in RMB and LBMA Gold Price PM in USD*
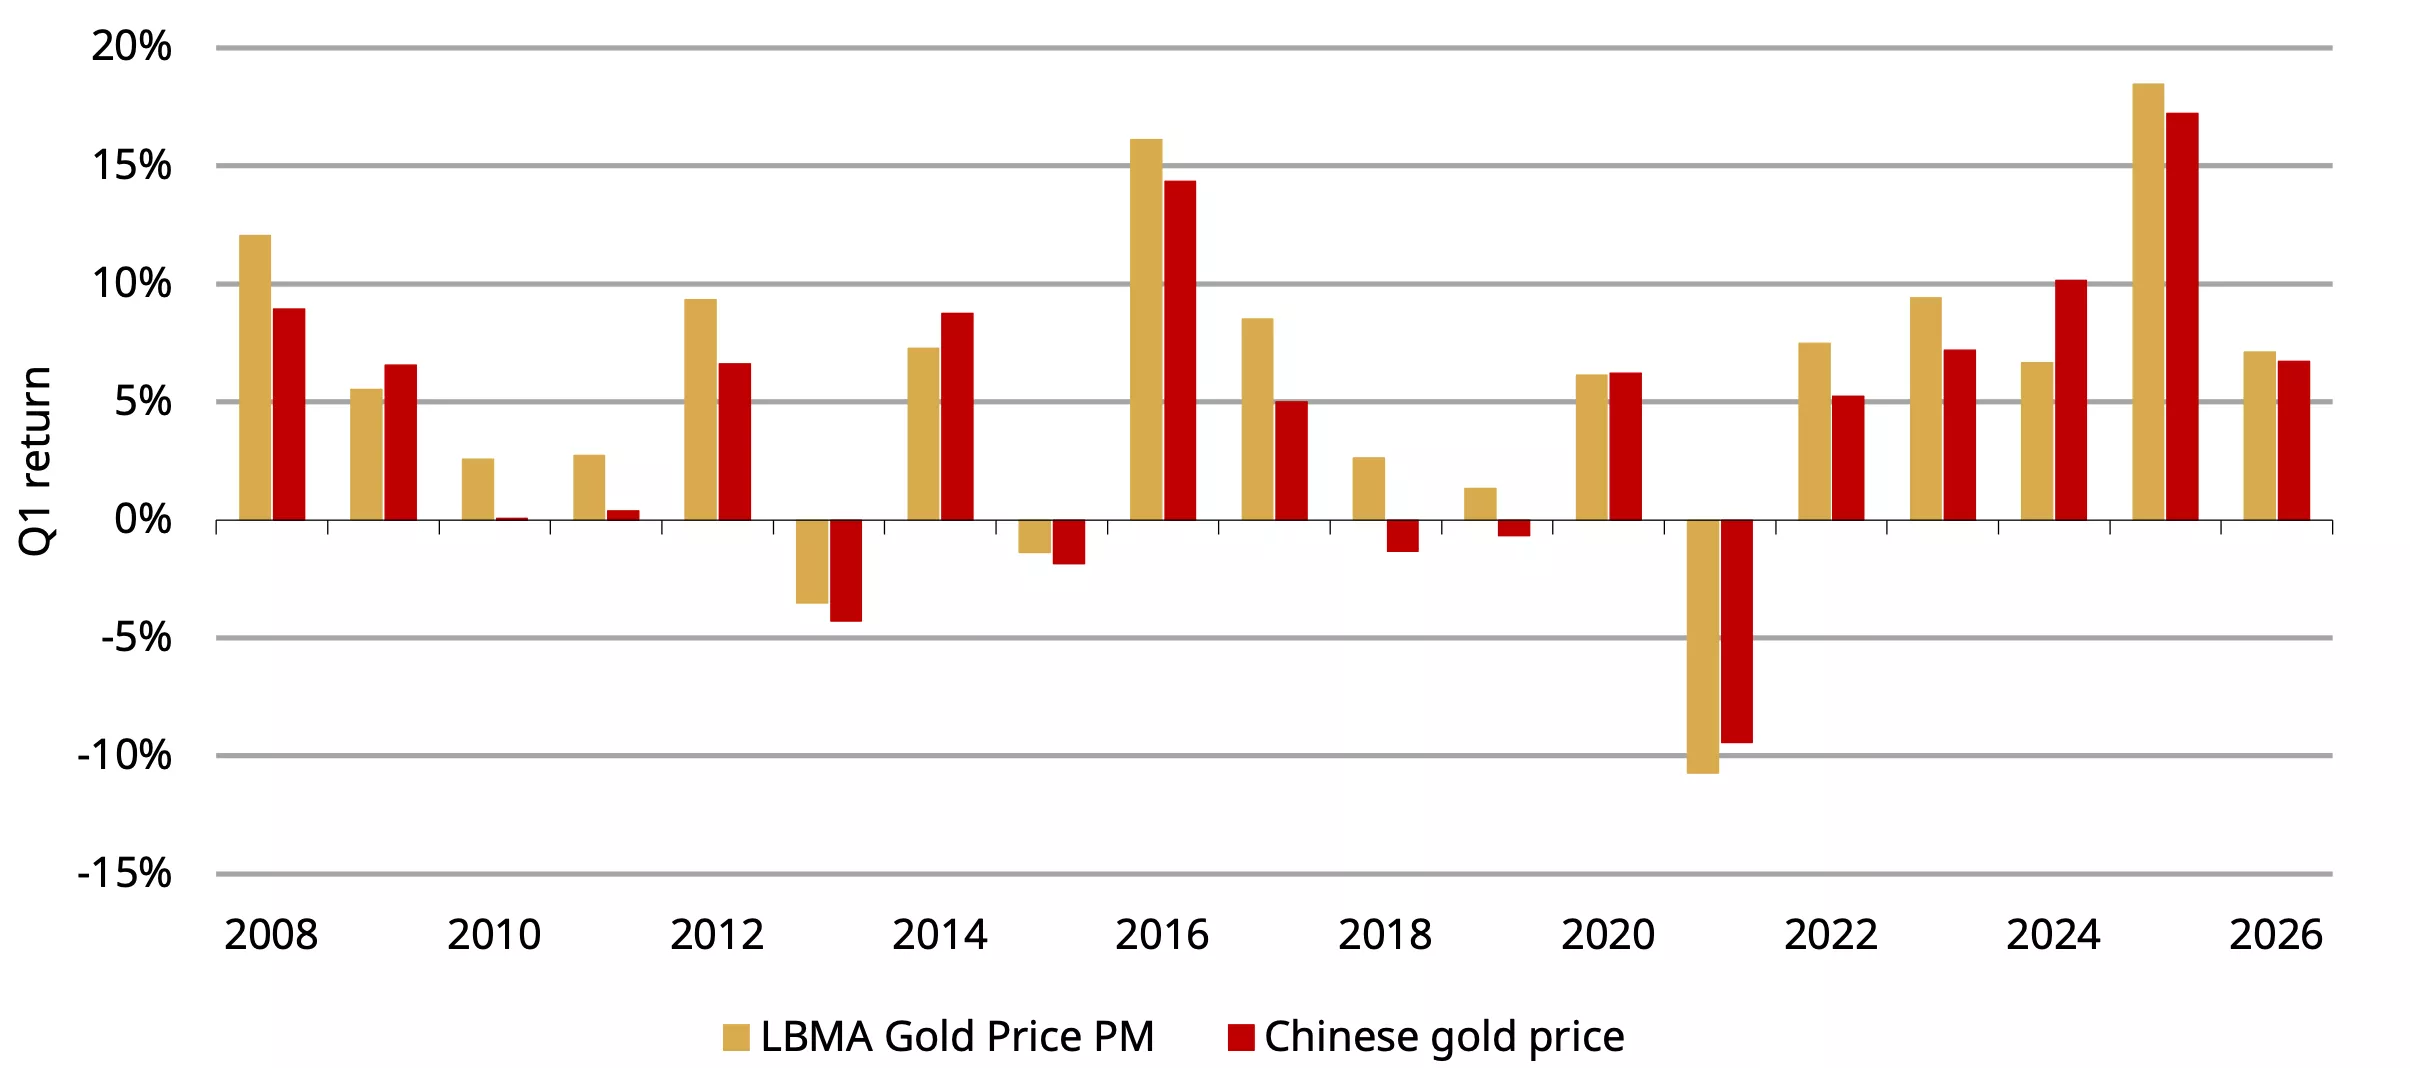
*Data to March 2026. Chinese gold price based on Au9999 as SHAUPM only dates back to 2016.
Source: Shanghai Gold Exchange, ICE Benchmark Administration, World Gold Council
Wholesale gold demand ended Q1 with a seasonal rebound
Banks, jewellers and refiners withdrew 134t of gold from the SGE in March (Chart 2), marking a 57% m/m rebound and a 12% increase y/y. The m/m recovery was largely seasonal, reflecting more working days in March (22 vs 14 in February) and post–Chinese New Year restocking by industry participants. We believe the gold price pullback also encouraged opportunistic replenishment.
This price dynamic likely contributed to the y/y increase as well, as the sharp gold price rally in March last year had dampened jewellers’ restocking appetite. Nevertheless, the month’s wholesale demand remained below its ten‑year average, underscoring continued weakness in the jewellery sector.
A firmer March lifted Q1 wholesale gold demand to 345t – 3% higher y/y but still 23% below the ten‑year average. Overall, Chinese gold demand continued to diverge in line with trends observed in 2025: as gold prices surged through most of Q1, strong investment demand offset persistent weakness in gold jewellery consumption.
Chart 2: Wholesale gold demand rebounded seasonally in March
Gold withdrawals from the SGE by month and the ten-year monthly average*
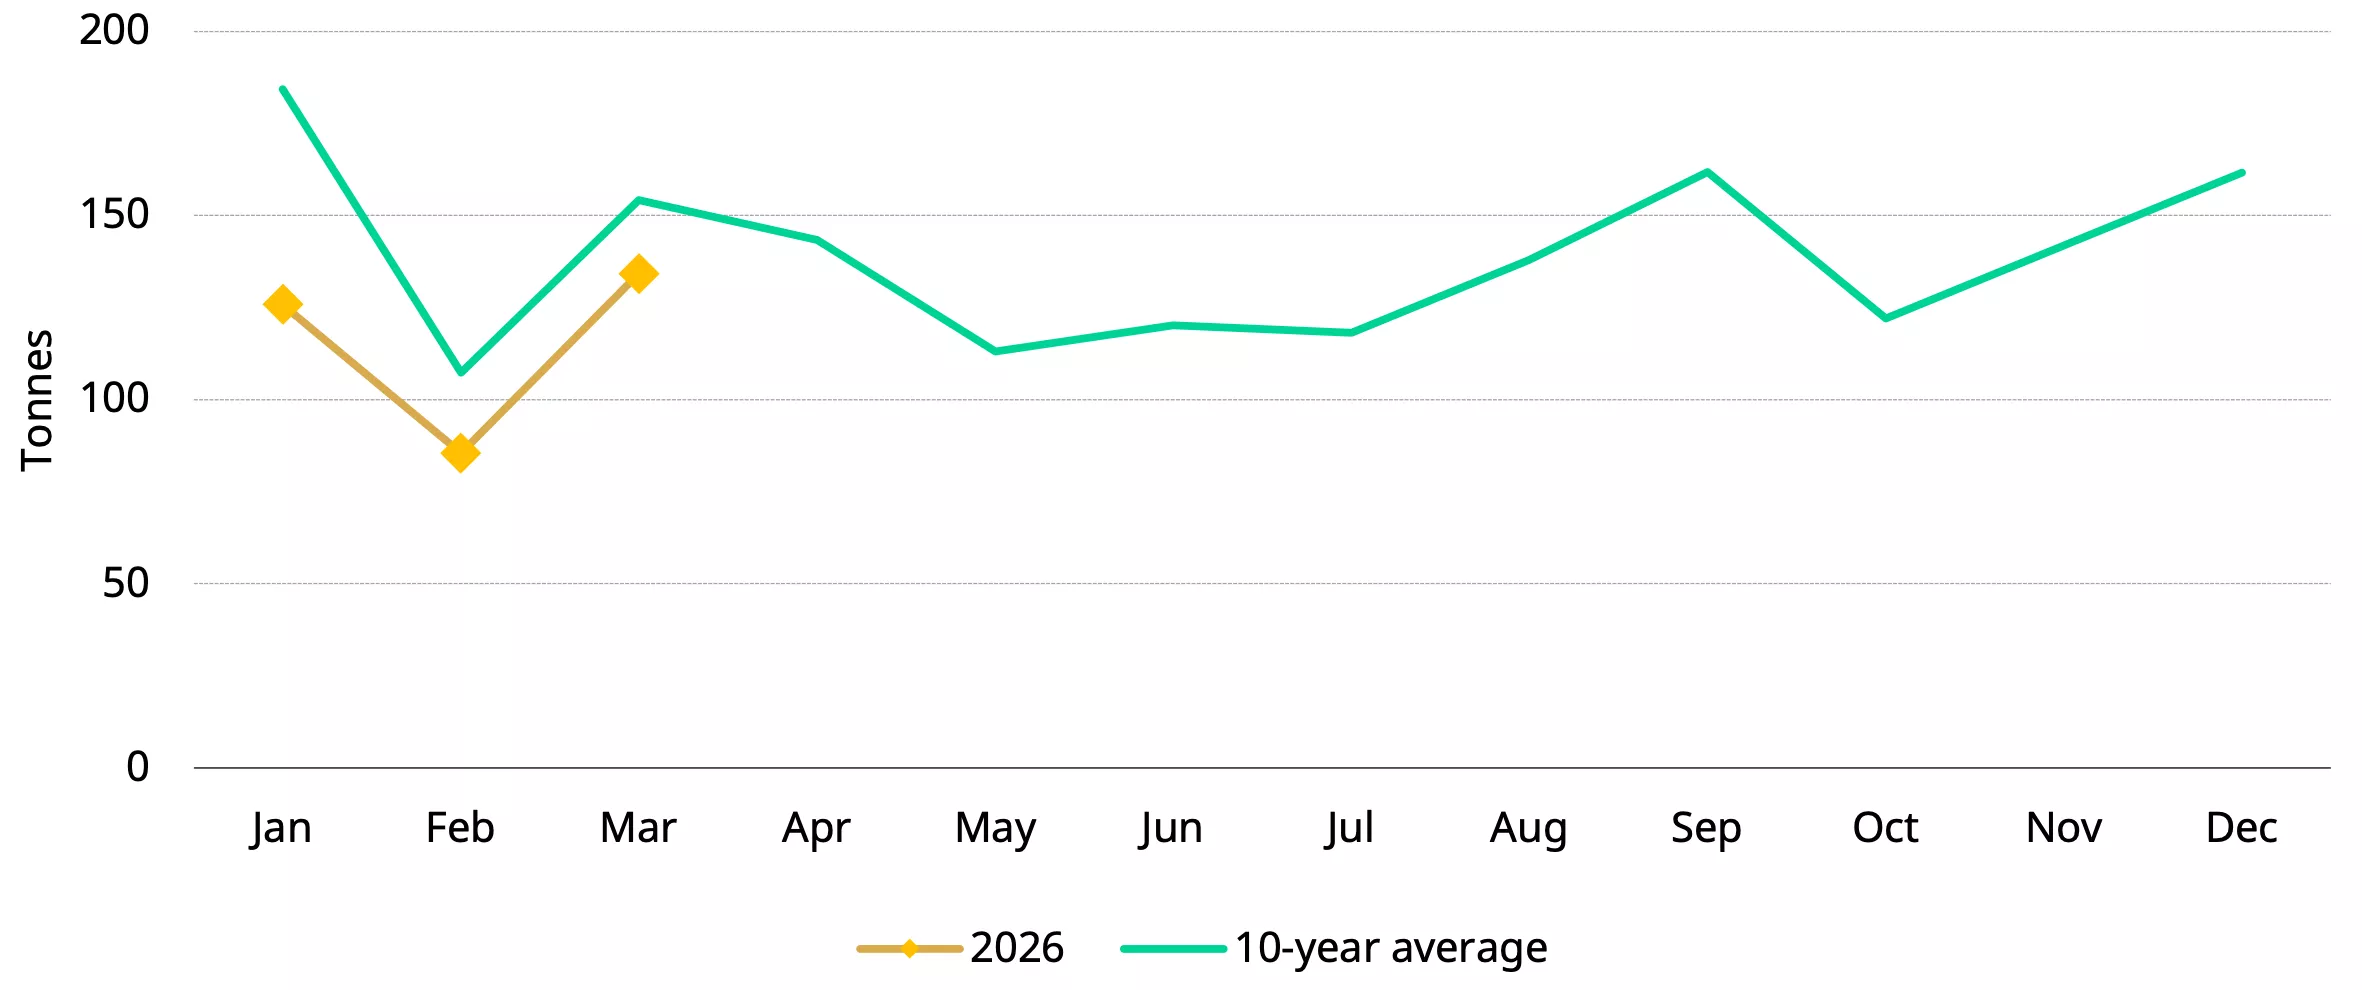
*Ten-year average based on data between 2016 and 2025.
Source: Shanghai Gold Exchange, World Gold Council
Chinese gold ETFs saw non-stop inflows throughout Q1
Chinese gold ETFs have now seen inflows for seven months in a row, attracting RMB12bn (US$1.7bn) in March, equivalent to a 8.4t rise in holdings (Chart 3). The plummeting local gold price did not interrupt Chinese investor appetite for gold ETFs. In March, the CSI300 stock index fell 6% and the local currency depreciated by 0.8% against the dollar; these factors, combined with safe-haven demand prompted by the US-Israel-Iran war, and continued regional geopolitical tensions supported local gold ETF buying. We also witnessed some dip buying during the first half of the month.
Chinese investors bought a total of RMB59bn (US$8.5bn, 50t) of gold ETFs in Q1, shattering the previous quarter’s record. This is the strongest quarter ever: Chinese gold ETFs’ total AUM – supported by the price increase and inflows – rose 26% to RMB304bn (US$44bn) and holdings climbed to 298t, both reaching quarter-end peaks.
Chart 3: Chinese gold ETFs kept expanding in March
Chinese gold ETF demand and holdings in tonnes*
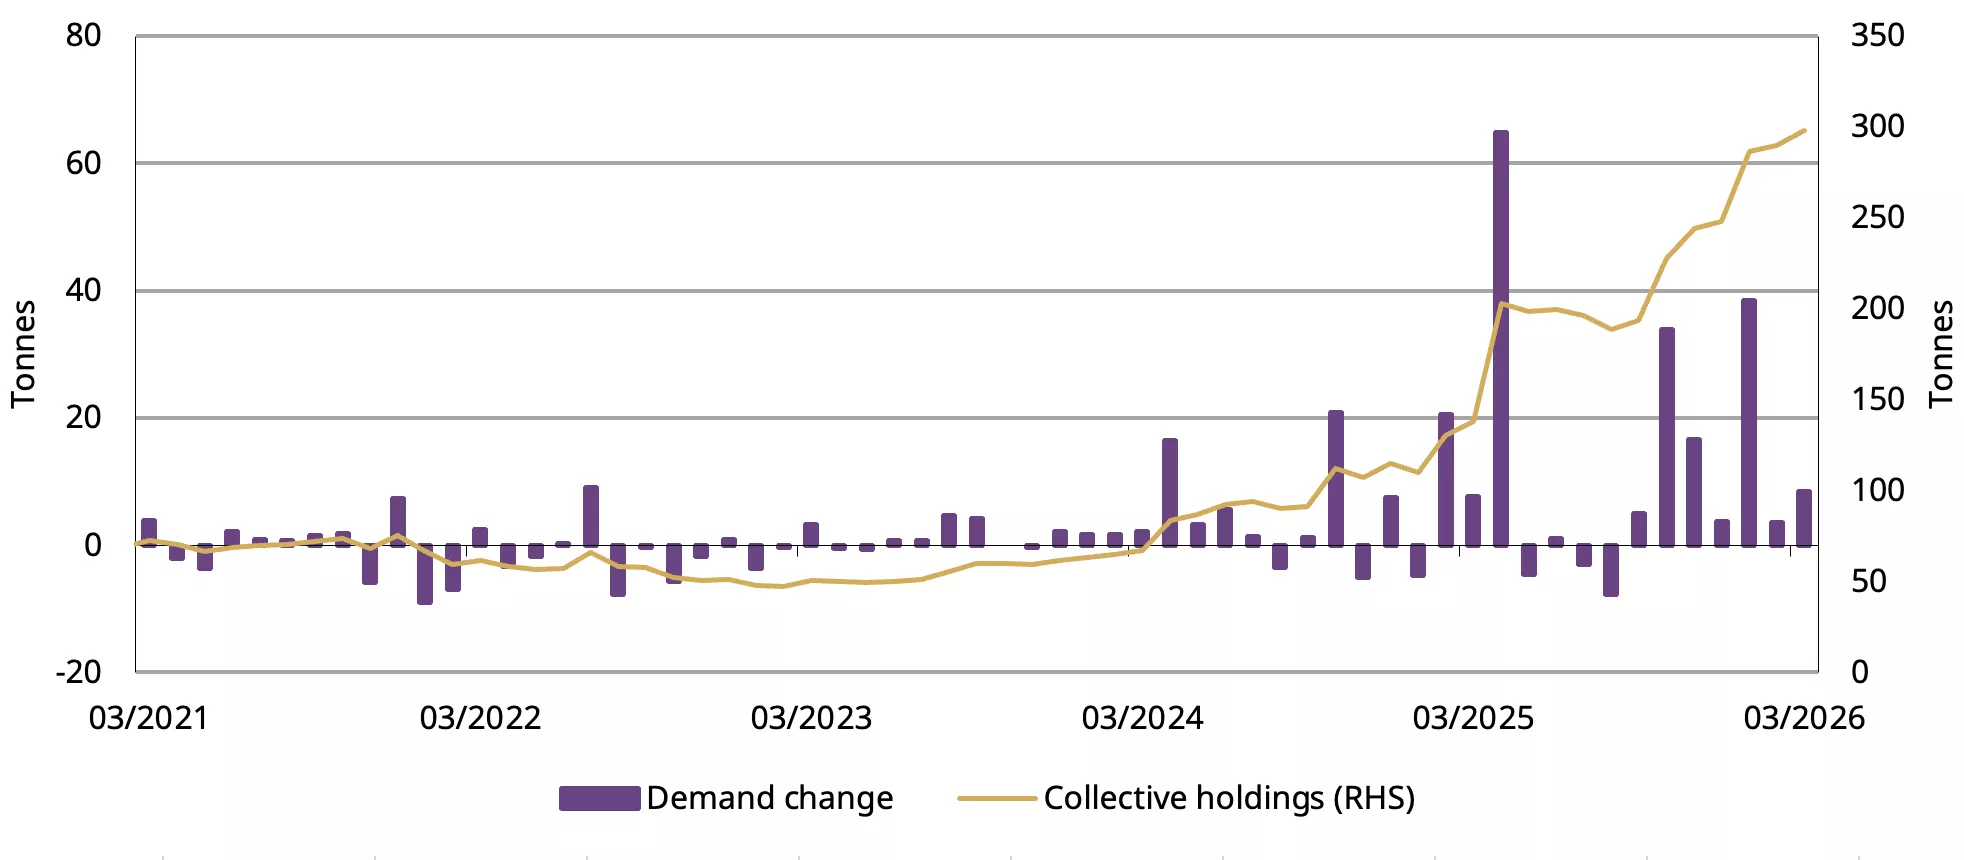
*Data to 31 March 2026.
Source: Company filings, World Gold Council
Chinese gold futures trading volumes fell by 12% m/m to an average of 443t/day in March. We believe the decline can be largely attributed to lower gold price volatility and a weakening gold price performance, factors that dimmed trader interest (Chart 4). Over the course of Q1 gold futures trading at the Shanghai Futures Exchange (SHFE) averaged 468t per day in volumes, well above the five-year average of 265t/day.
Chart 4: Gold futures trading cooled in March
Daily average trading volumes of SHFE gold futures and monthly gold price volatility*
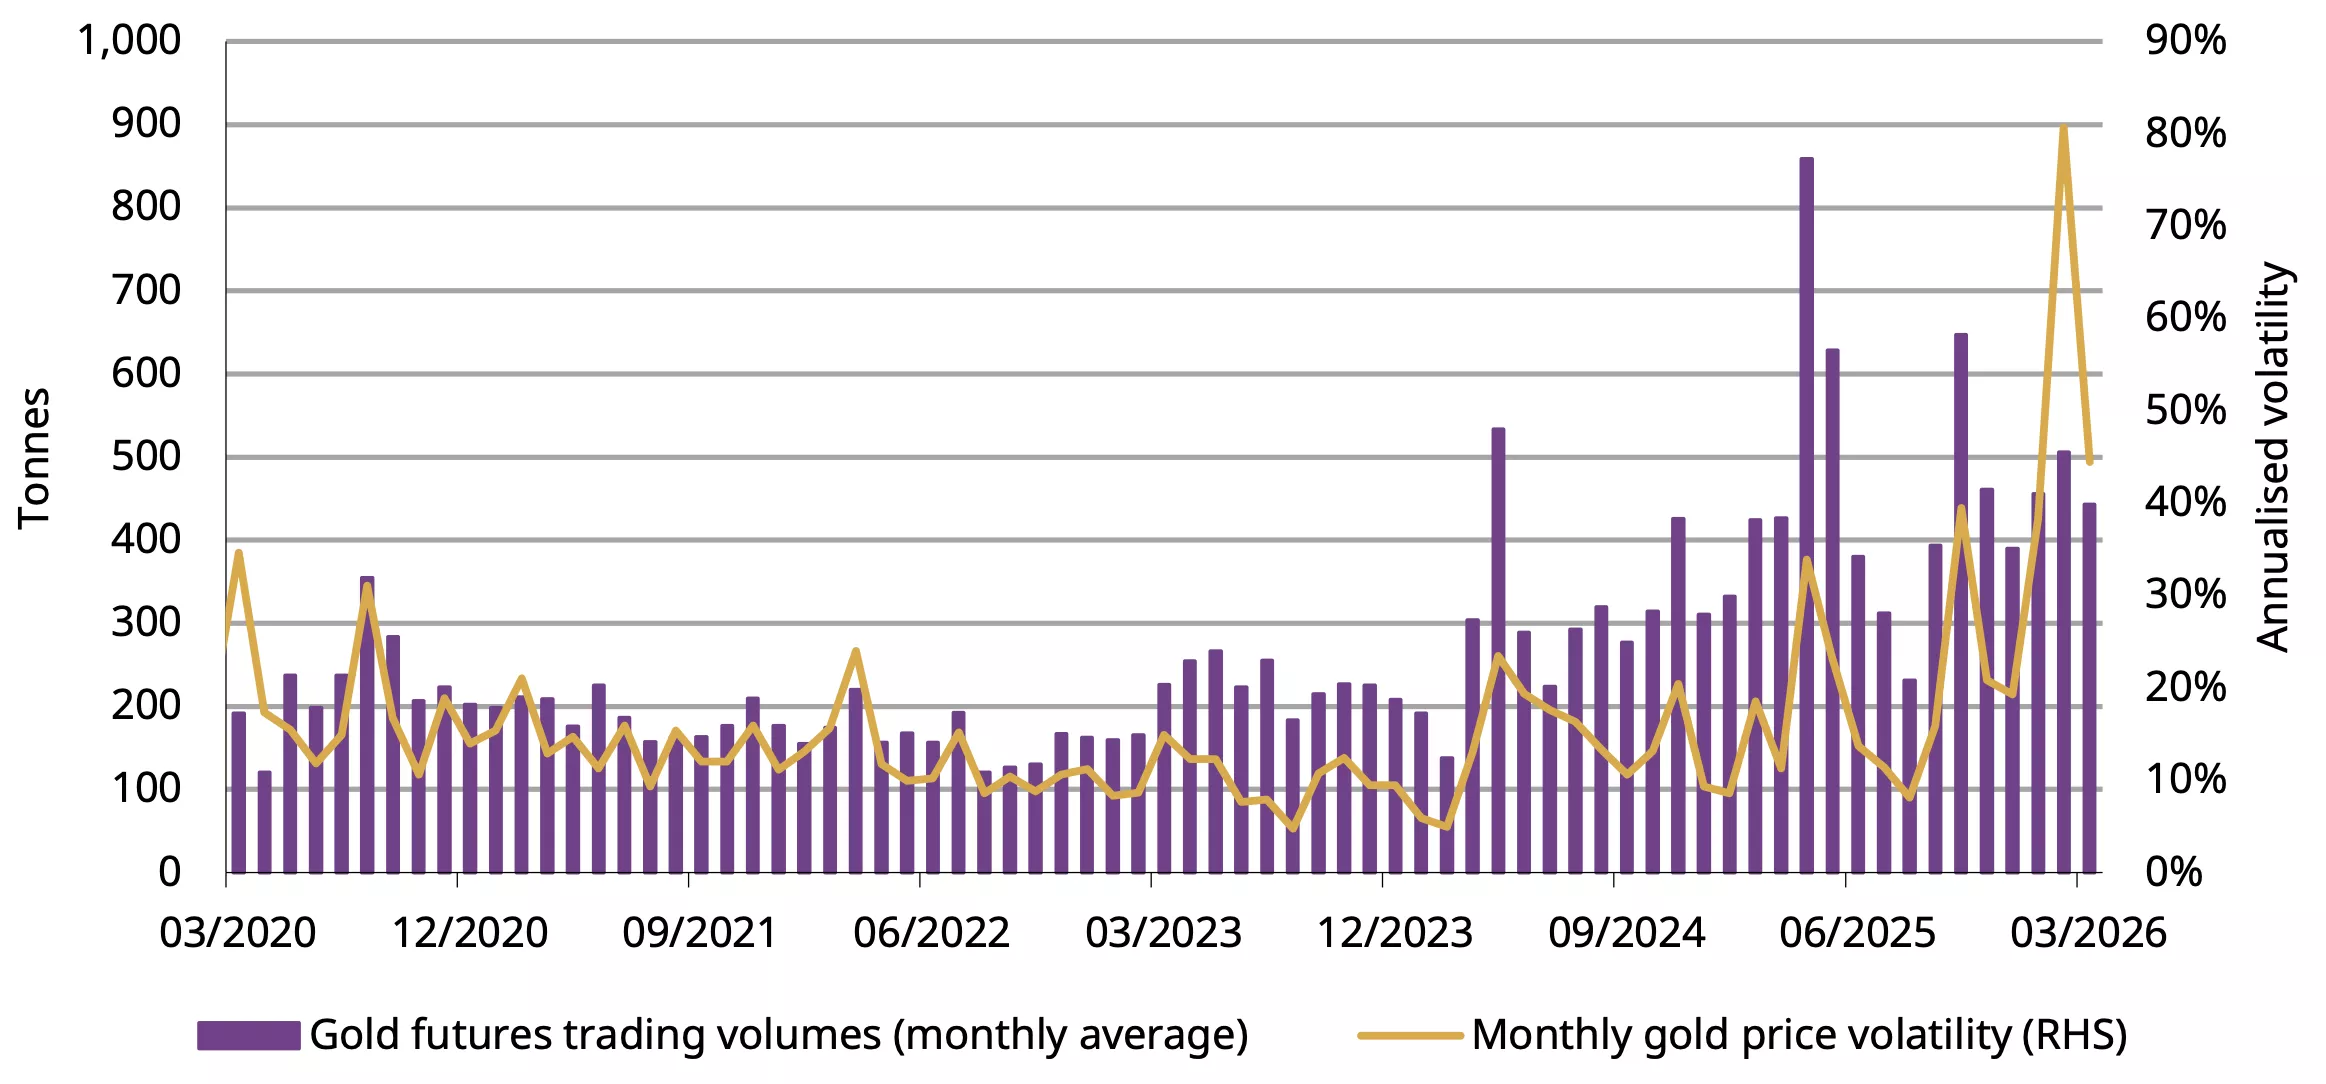
*As of 31 March 2026.
Source: Shanghai Futures Exchange, World Gold Council
The PBoC bought gold on dip in March
The PBoC announced its 17th consecutive monthly gold purchase in March. This 5t addition, the largest since February 2025, pushed China’s official gold holdings to 2,313t (Chart 5). Gold now accounts for 9% of China’s foreign exchange reserves, down from February’s 10% due mainly to the gold price pullback in March. Non-stop buying throughout the quarter has accumulated an additional 7t of gold for the Chinese central bank, the highest since Q1 2025.
Chart 5: Strong gold buying from the PBoC amidst the gold price adjustment in March
The PBoC’s reported gold purchases and gold’s share of total foreign exchange reserves*
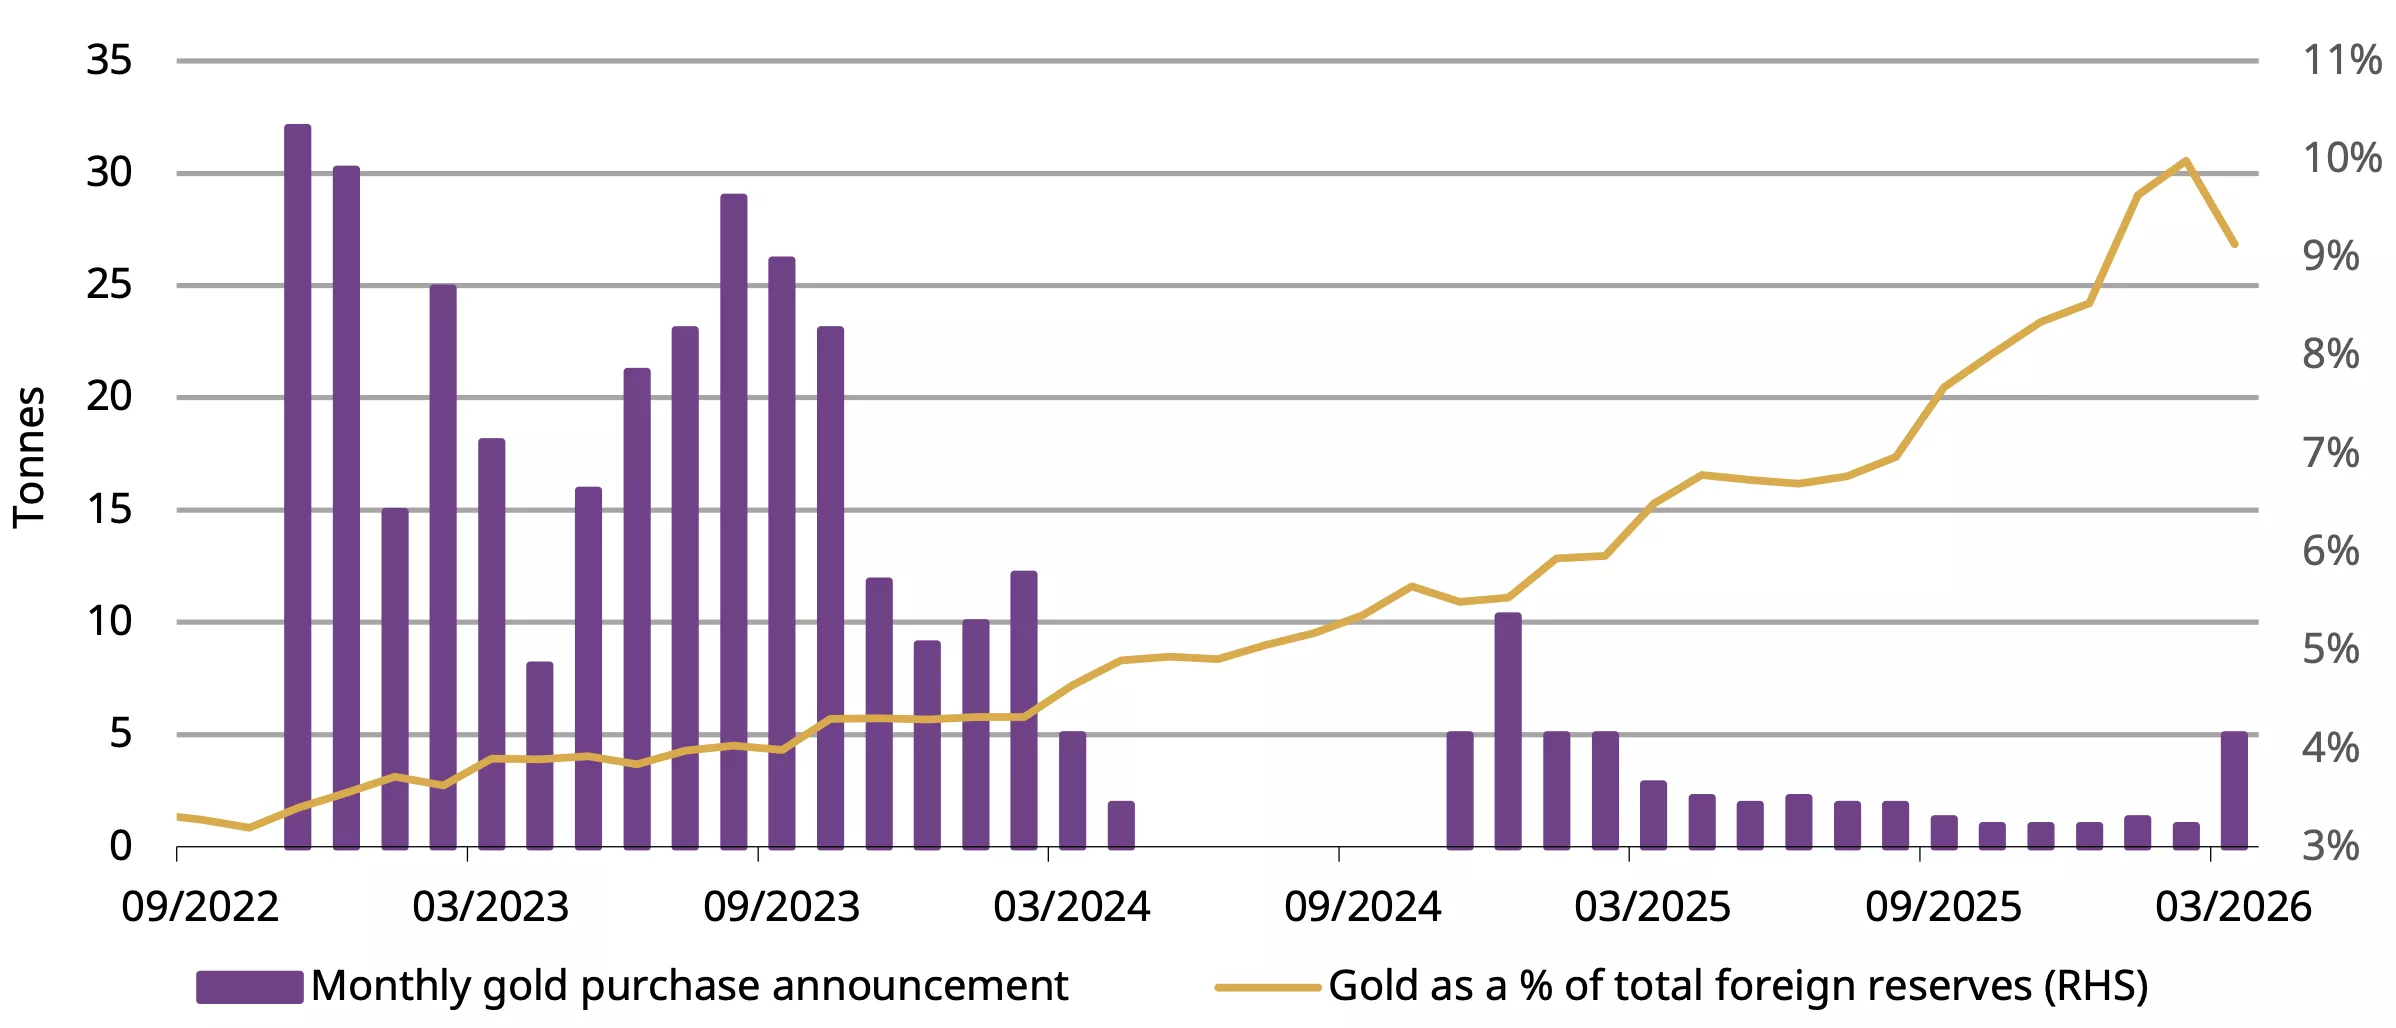
*Data to March 2026.
Source: State Administration of Foreign Exchanges, World Gold Council
Imports rose at the start of the year
China’s gold imports picked up at the beginning of 2026, according to the latest data from China Customs (Chart 6). January net imports reached 77t, a significant increase compared to the net exports of 6t last year. Net imports in February totalled 96t, 63t higher y/y. This robustness was underpinned by resilient demand during the month, and the rebounding local gold price premium also boosted importer interest.
Chart 6: Gold imports rebounded at the start of 2026
Net gold imports under HS code 7108*
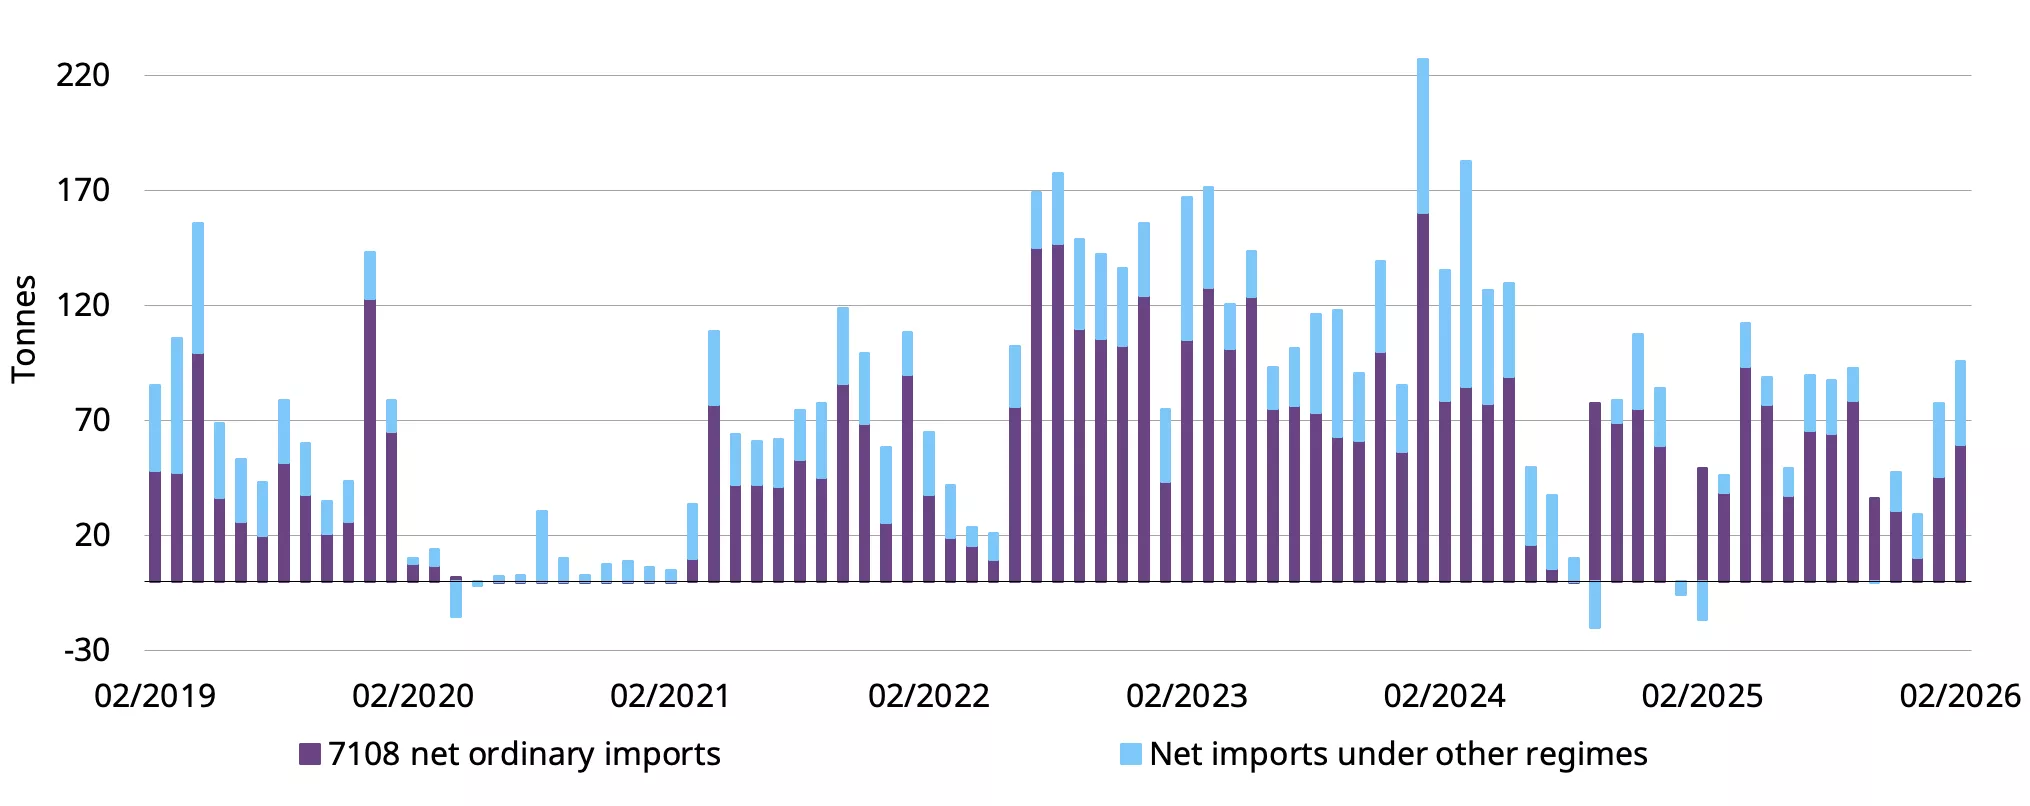
*Data to February 2026.
Source: China Customs, World Gold Council
Disclaimer
Important information and disclaimers
© 2026 World Gold Council. All rights reserved. World Gold Council and the Circle device are trademarks of the World Gold Council or its affiliates.
All references to LBMA Gold Price are used with the permission of ICE Benchmark Administration Limited and have been provided for informational purposes only. ICE Benchmark Administration Limited accepts no liability or responsibility for the accuracy of the prices or the underlying product to which the prices may be referenced. Other content is the intellectual property of the respective third party and all rights are reserved to them.
Reproduction or redistribution of any of this information is expressly prohibited without the prior written consent of World Gold Council or the appropriate copyright owners, except as specifically provided below. Information and statistics are copyright © and/or other intellectual property of the World Gold Council or its affiliates or third-party providers identified herein. All rights of the respective owners are reserved.
The use of the statistics in this information is permitted for the purposes of review and commentary (including media commentary) in line with fair industry practice, subject to the following two pre-conditions: (i) only limited extracts of data or analysis be used; and (ii) any and all use of these statistics is accompanied by a citation to World Gold Council and, where appropriate, to Metals Focus or other identified copyright owners as their source. World Gold Council is affiliated with Metals Focus.
The World Gold Council and its affiliates do not guarantee the accuracy or completeness of any information nor accept responsibility for any losses or damages arising directly or indirectly from the use of this information.
This information is for educational purposes only and by receiving this information, you agree with its intended purpose. Nothing contained herein is intended to constitute a recommendation, investment advice, or offer for the purchase or sale of gold, any gold-related products or services or any other products, services, securities or financial instruments (collectively, “Services”). This information does not take into account any investment objectives, financial situation or particular needs of any particular person.
Diversification does not guarantee any investment returns and does not eliminate the risk of loss. Past performance is not necessarily indicative of future results. The resulting performance of any investment outcomes that can be generated through allocation to gold are hypothetical in nature, may not reflect actual investment results and are not guarantees of future results. The World Gold Council and its affiliates do not guarantee or warranty any calculations and models used in any hypothetical portfolios or any outcomes resulting from any such use. Investors should discuss their individual circumstances with their appropriate investment professionals before making any decision regarding any Services or investments.
This information may contain forward-looking statements, such as statements which use the words “believes”, “expects”, “may”, or “suggests”, or similar terminology, which are based on current expectations and are subject to change. Forward-looking statements involve a number of risks and uncertainties. There can be no assurance that any forward-looking statements will be achieved. World Gold Council and its affiliates assume no responsibility for updating any forward-looking statements.
Information regarding the LBMA Gold Price
The LBMA Gold Price is used by the World Gold Council with permission under license by ICE Benchmark Administration Limited and is subject to the restrictions set forth here (www.gold.org/terms-and-conditions).
Information regarding QaurumSM and the Gold Valuation Framework
Note that the resulting performance of various investment outcomes that can be generated through use of Qaurum, the Gold Valuation Framework and other information are hypothetical in nature, may not reflect actual investment results and are not guarantees of future results. Neither World Gold Council (including its affiliates) nor Oxford Economics provides any warranty or guarantee regarding the functionality of the tool, including without limitation any projections, estimates or calculations.
Information from ICRA Analytics Limited
All information obtained from ICRA Analytics Limited contained in this document is subject to the disclaimer set forth here (www.icraanalytics.com/terms-of-use/disclaimer).
