China gold market update: Resilient demand in a festive month
13 March, 2026
Highlights
- Gold took different directions in February: the LBMA Gold Price PM in USD kept rising while the Shanghai Gold Benchmark Price PM (SHAUPM) in RMB fell, due mainly to a stronger local currency. So far in Marh, both prices have stabilised above their key thresholds.
- Wholesale demand showed some resilience during the Spring Festival month, falling modestly by 5t y/y to 85t, likely supported by the industry’s pre-holiday restocking and robust investment demand
- Chinese gold ETFs added RMB4.5bn (US$640mn) in February; holdings rose 4t to 290t while assets under management (AUM) fell 1% to RMB331bn (US$48bn), impacted by the local gold price decline. And inflows accelerated in early March, likely driven by higher safe-haven demand
- China’s gold reserves have expanded for 16 months in a row, and rose a further 1t in February to 2,309t; gold now represents 10% of China’s total foreign exchange reserves.
Looking ahead
- The gold jewellery sector may experience some seasonal weaknesses in the month ahead, which could be dampened further if gold price rises. Meanwhile, investment demand for gold should remain robust, potentially supported by ongoing geopolitical risks, globally and regionally.
Gold’s diverging price trends from west to east
Gold prices diverged in February (Chart 1). The LBMA Gold Price PM in USD rose 4.8%, supported by factors such as heightened geopolitical risks and lower US Treasury yields. while the SHAUPM in RMB fell 1.3%, likely impacted by the 1.4% appreciation in RMB against the dollar and the Chinese New Year (CNY) holiday, which disrupted both local trading and physical gold withdrawals.
So far in March gold prices have experienced mild declines as investor expectations of the Fed’s future rate path shift. But supported by rising safe-haven demand amid the Middle East chaos, the LBMA Gold Price PM remains above the US$5,000/oz threshold, whilst the SHAUPM stands firmly above RMB1,100/gram.
Chart 1: February saw gold prices take different directions
Monthly returns of the SHAUPM in RMB and LBMA Gold Price PM in USD*
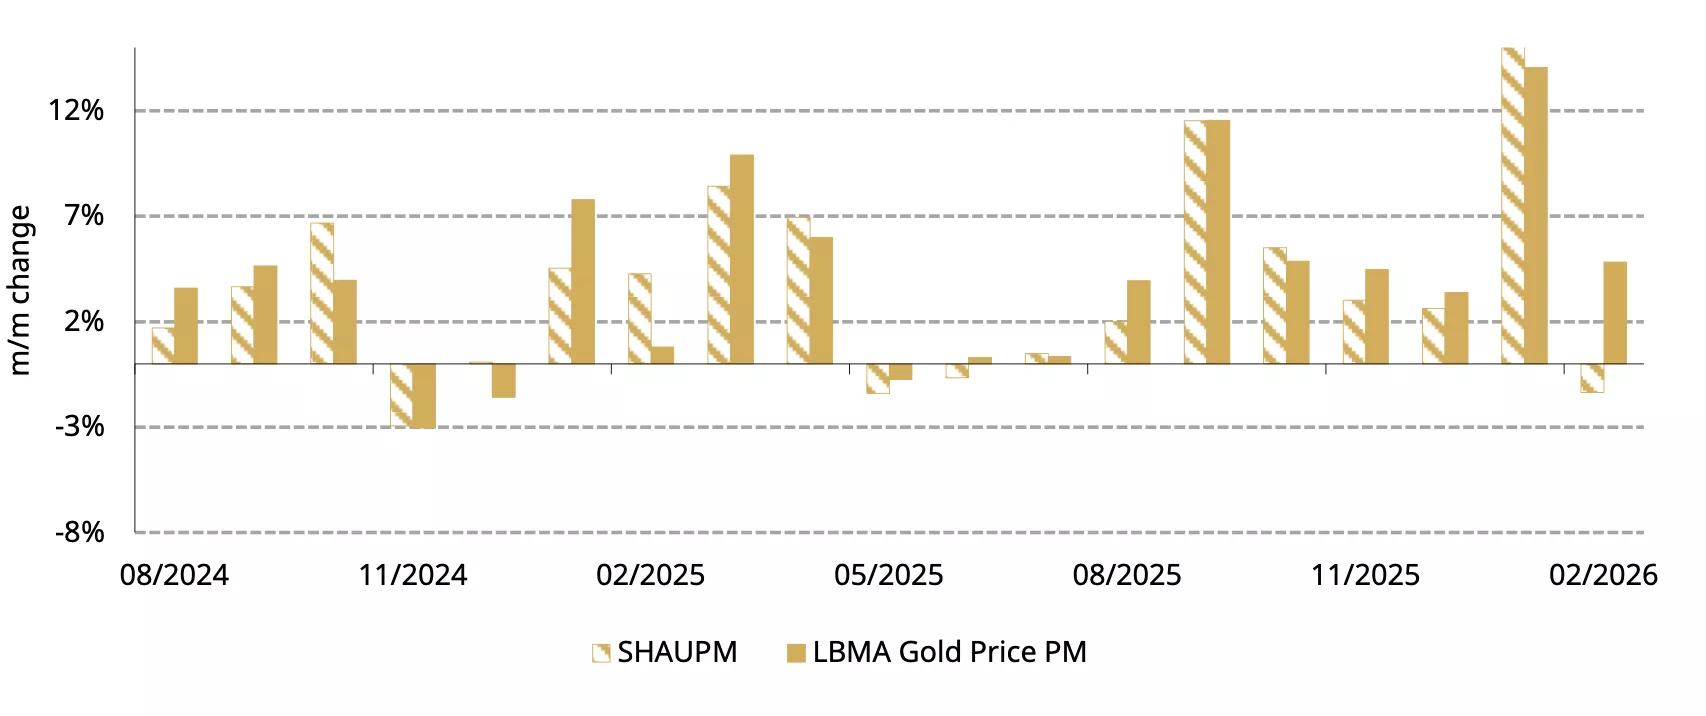
*Data to 27 February 2026.
Source: Shanghai Gold Exchange, ICE Benchmark Administration, World Gold Council
Wholesale gold demand showed resilience
Gold withdrawals from the SGE totalled 85t in February, a CNY month, down 32% m/m (Chart 2), mainly due to fewer working days in February (14) compared to January (20).1 It is noteworthy that most factories in China – including jewellery manufacturers and bullion refiners – usually take longer CNY holidays than other sectors, further weighing on February activity.
Compared to February 2025, also a CNY month, wholesale gold demand fell by a modest 5t. This relative resilience was likely supported by two factors: first, a lower RMB gold price helped underpin some pre‑holiday restocking; and second, bullion sales remained robust likely driven by seasonal factors and similar factors drove gold ETF demand detailed below.
Chart 2: Wholesale gold demand during CNY month stayed relatively resilient
Gold withdrawals from the SGE during CNY months*
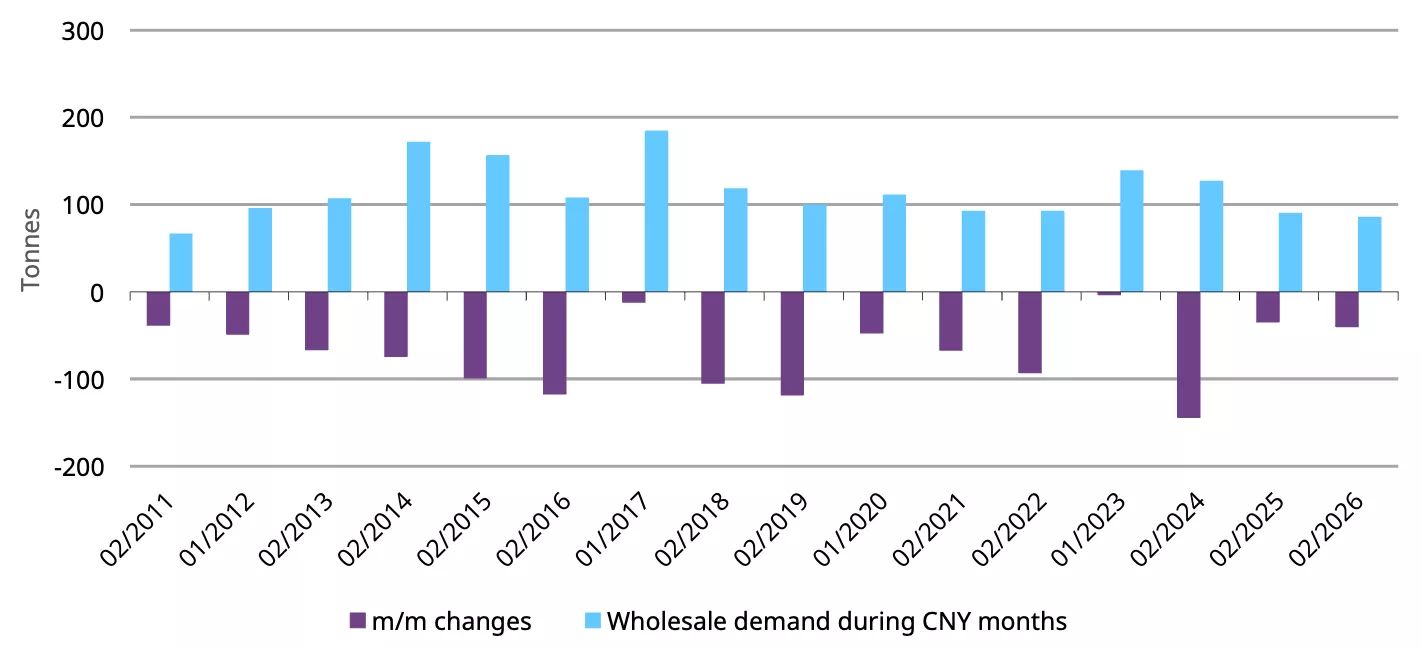
*Based on the occurrence of the majority of CNY holidays.
Source: Shanghai Gold Exchange, World Gold Council
Inflows into Chinese gold ETFs persisted
Chinese gold ETFs added RMB4.5bn (US$640mn) in February, marking the sixth consecutive monthly inflow (Chart 3). Collective holdings rose 3.6t to 290t in the month, another all-time high. But their total AUM fell 1% m/m to RMB331bn (US$48bn) as February inflows were insufficient to offset the local gold price drop.
Early‑month volatility may have prompted some investors to reduce their holdings. As the local gold price stabilised investors added gold ETFs back into their portfolios. This is likely driven by both dip-buying as well as rising safe-haven demand amid geopolitical tensions globally and regionally. That said, fewer trading days due to the CNY holiday limited February inflows.
Inflows have accelerated so far in March, despite the gold price volatility. We believe rising safe-haven demand amid escalating global geopolitical tensons and a volatile equity market were main contributors.
Chart 3: Demand for Chinese gold ETFs continued in February
Chinese gold ETF demand and holdings in tonnes*
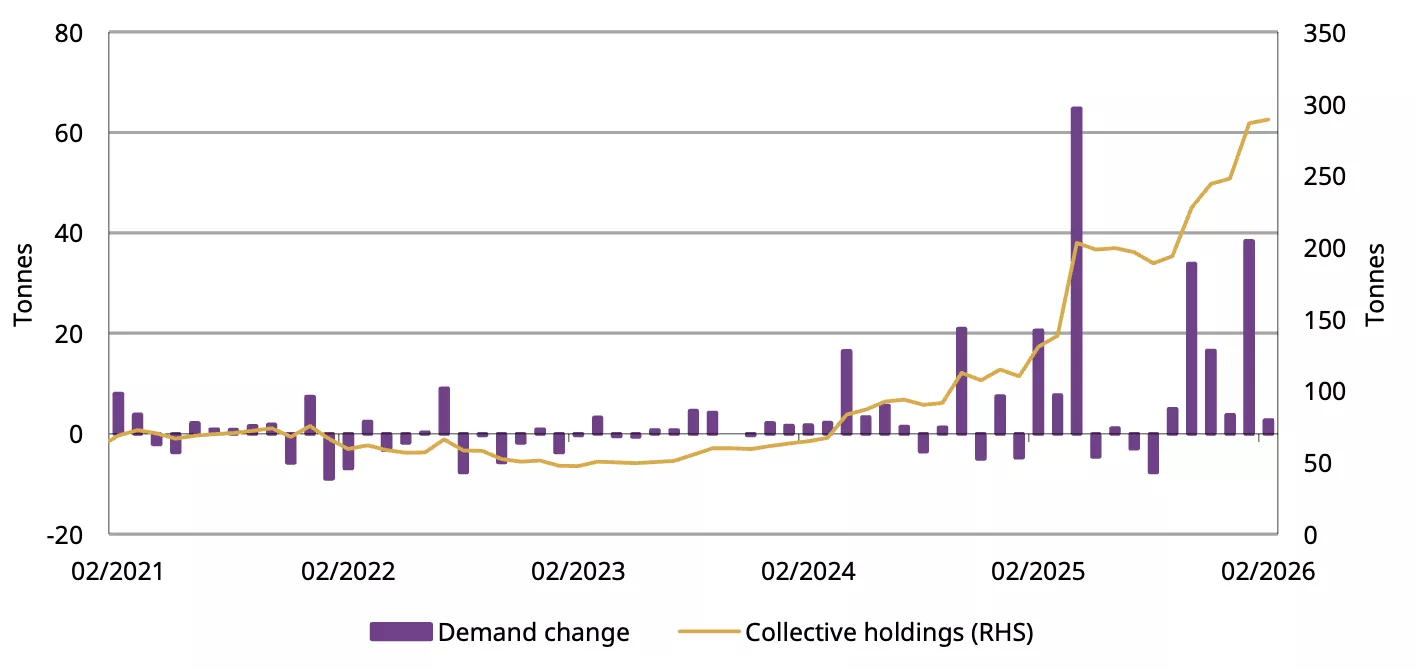
*Data to 27 February 2026.
Source: Company filings, World Gold Council
Trading volumes of gold futures on the Shanghai Futures Exchange (SHFE) averaged 505t per day, 11% higher m/m. The surging gold price volatility lifted tactical traders’ interest in gold futures; this was particularly evident in early February when both volatility and volumes spiked (Chart 4).
Chart 4: Trading volumes of gold futures rose in February
Daily average trading volumes of SHFE gold futures and the active gold futures price*
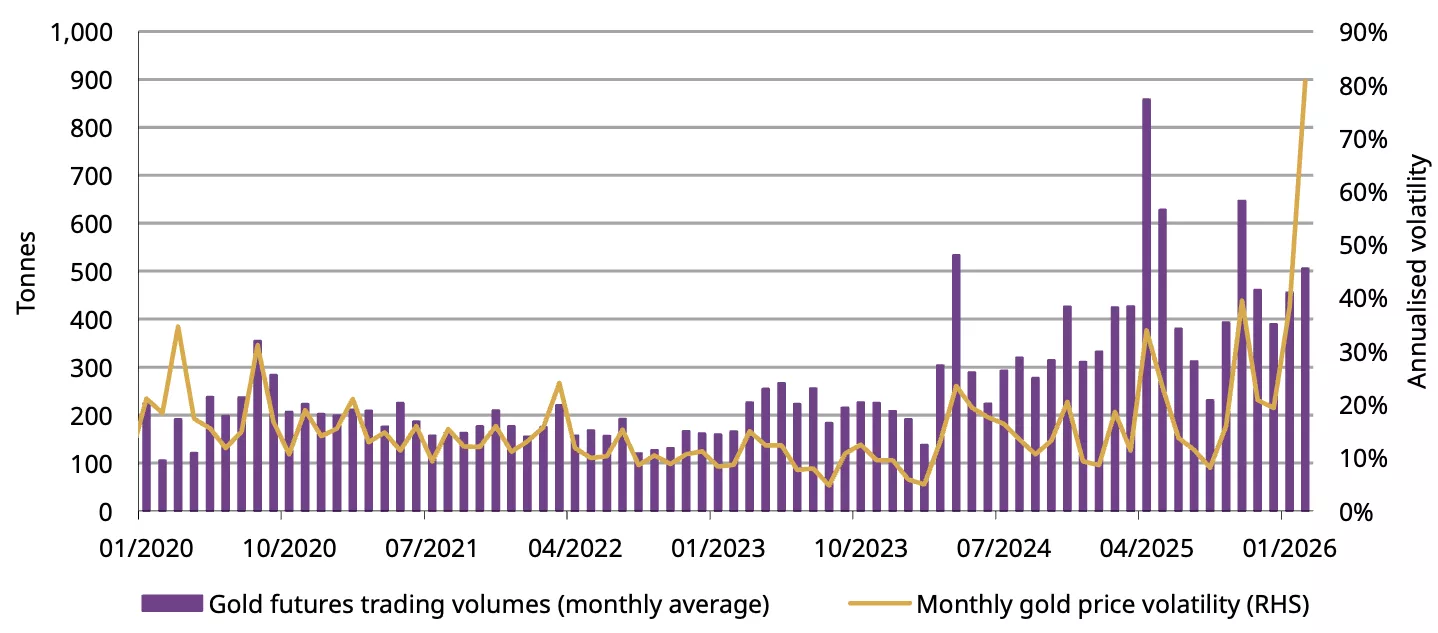
*As of 27 February 2026.
Source: Shanghai Futures Exchange, World Gold Council
China’s official gold holdings kept rising
The PBoC reported another 1t addition to gold holdings in February, pushing the total to 2,309t (Chart 5). This now represents 10% of foreign exchange reserves, which rose 0.9% m/m to US$3.9tn. China’s gold reserves have risen consecutively for 16 months, sending an important message: in today’s world, gold’s role as an effective portfolio diversifier and uncertainty cushion is highly relevant.
Chart 5: Another addition to China’s gold reserves in February
The PBoC’s reported gold purchases and gold’s share of total foreign exchange reserves*
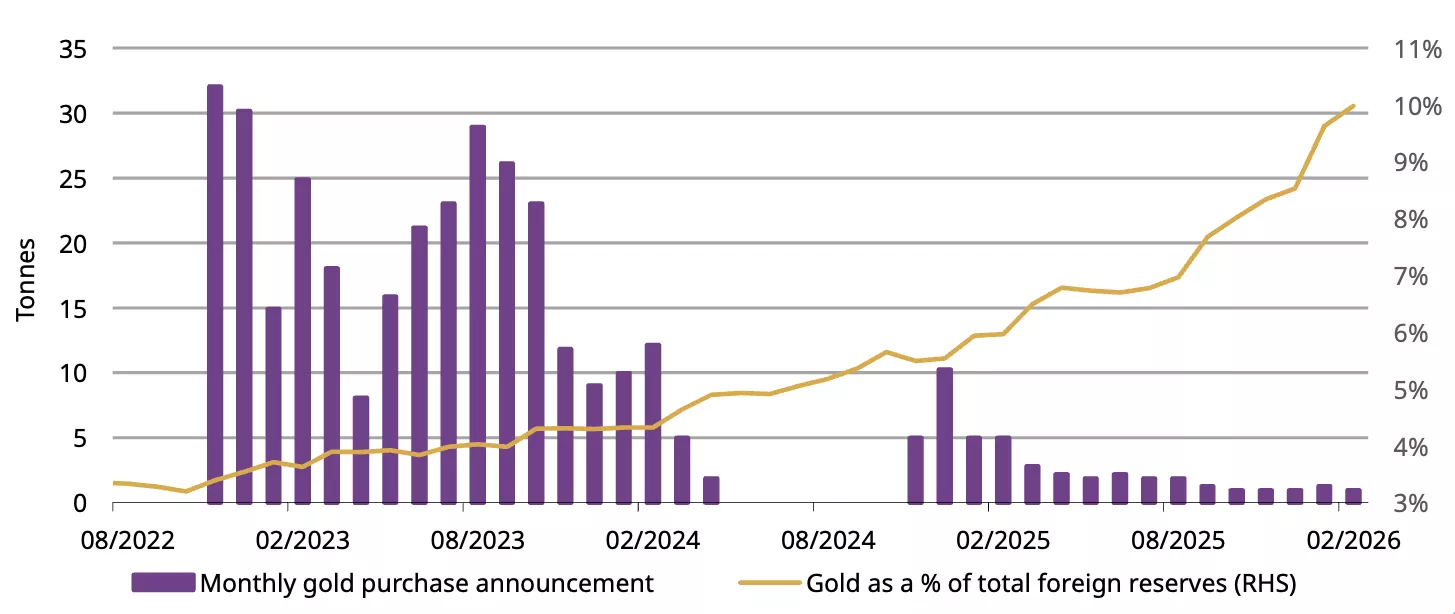
*Data to February 2026.
Source: State Administration of Foreign Exchanges, World Gold Council
Footnotes
1The Chinese New Years holiday occurred between 15 and 23 February 2026.
Disclaimer
Important information and disclaimers
© 2026 World Gold Council. All rights reserved. World Gold Council and the Circle device are trademarks of the World Gold Council or its affiliates.
All references to LBMA Gold Price are used with the permission of ICE Benchmark Administration Limited and have been provided for informational purposes only. ICE Benchmark Administration Limited accepts no liability or responsibility for the accuracy of the prices or the underlying product to which the prices may be referenced. Other content is the intellectual property of the respective third party and all rights are reserved to them.
Reproduction or redistribution of any of this information is expressly prohibited without the prior written consent of World Gold Council or the appropriate copyright owners, except as specifically provided below. Information and statistics are copyright © and/or other intellectual property of the World Gold Council or its affiliates or third-party providers identified herein. All rights of the respective owners are reserved.
The use of the statistics in this information is permitted for the purposes of review and commentary (including media commentary) in line with fair industry practice, subject to the following two pre-conditions: (i) only limited extracts of data or analysis be used; and (ii) any and all use of these statistics is accompanied by a citation to World Gold Council and, where appropriate, to Metals Focus or other identified copyright owners as their source. World Gold Council is affiliated with Metals Focus.
The World Gold Council and its affiliates do not guarantee the accuracy or completeness of any information nor accept responsibility for any losses or damages arising directly or indirectly from the use of this information.
This information is for educational purposes only and by receiving this information, you agree with its intended purpose. Nothing contained herein is intended to constitute a recommendation, investment advice, or offer for the purchase or sale of gold, any gold-related products or services or any other products, services, securities or financial instruments (collectively, “Services”). This information does not take into account any investment objectives, financial situation or particular needs of any particular person.
Diversification does not guarantee any investment returns and does not eliminate the risk of loss. Past performance is not necessarily indicative of future results. The resulting performance of any investment outcomes that can be generated through allocation to gold are hypothetical in nature, may not reflect actual investment results and are not guarantees of future results. The World Gold Council and its affiliates do not guarantee or warranty any calculations and models used in any hypothetical portfolios or any outcomes resulting from any such use. Investors should discuss their individual circumstances with their appropriate investment professionals before making any decision regarding any Services or investments.
This information may contain forward-looking statements, such as statements which use the words “believes”, “expects”, “may”, or “suggests”, or similar terminology, which are based on current expectations and are subject to change. Forward-looking statements involve a number of risks and uncertainties. There can be no assurance that any forward-looking statements will be achieved. World Gold Council and its affiliates assume no responsibility for updating any forward-looking statements.
Information regarding the LBMA Gold Price
The LBMA Gold Price is used by the World Gold Council with permission under license by ICE Benchmark Administration Limited and is subject to the restrictions set forth here (www.gold.org/terms-and-conditions).
Information regarding QaurumSM and the Gold Valuation Framework
Note that the resulting performance of various investment outcomes that can be generated through use of Qaurum, the Gold Valuation Framework and other information are hypothetical in nature, may not reflect actual investment results and are not guarantees of future results. Neither World Gold Council (including its affiliates) nor Oxford Economics provides any warranty or guarantee regarding the functionality of the tool, including without limitation any projections, estimates or calculations.
Information from ICRA Analytics Limited
All information obtained from ICRA Analytics Limited contained in this document is subject to the disclaimer set forth here (www.icraanalytics.com/terms-of-use/disclaimer).
