In one of the most dramatic starts to any year, gold soared to record highs in January, crossing above US$5,500/oz intraday before dipping below US$4,000/oz in late June. Down roughly 7% year-to-date, gold nonetheless ranks among the top performers over the past year, as other assets play catch-up. The first half of 2026 showed that gold remains sensitive to heightened geopolitical concerns and abrupt shifts in investor sentiment. It also showcased the growing relevance of Asian markets in gold price discovery.
At current levels, gold’s price is broadly in line with a global backdrop of moderate growth, cooling but still elevated inflation, and expectations of further – but limited – central bank tightening. Under these conditions, gold will likely stay relatively rangebound (±5%). But the stage is set for a possible breakout. On the upside, clear catalysts – a worsening economy or renewed geopolitical shock, a shift towards lower interest-rate expectations, or a wave of dip buying – could reignite gold’s momentum and lift it back towards US$4,500/oz or above. If the signals are strong, gold could push even higher. Conversely, an environment of resilient growth, rising yields, and calmer markets could see gold slip further – though a fall of more than 10% from current levels may be tempered by bargain-hunting demand.
Meanwhile, enduring central bank demand and policy shifts in key markets like India are additional wildcards that could subtly influence gold’s path in the second half.
Chart 1: Gold’s current price is in line with macro consensus expectations but deviations from this environment can resume gold’s upward trend or bring price consolidation
H2 2026 implied gold performance based on hypothetical macroeconomic scenarios*
*Historical data based on the LBMA Gold Price PM in USD as of 26 June 2026. Ranges are not price forecasts but hypothetical illustrations of the potential scenario outcomes based on our Gold Valuation Framework. ‘Macro consensus’ implies a range between -5% and 5%; ‘Uptrend’ implies 5% to 20% upside; ‘Price consolidation’ implies 5% to 15% downside. The reference point is the average LBMA Gold Price for the week ending 26 June 2026. For more details, see Table 3.
A rollercoaster ride
Gold is currently down 7% y-t-d,1 but this modest drop masks a dramatic rollercoaster ride. Building on last year’s positive price momentum, gold set 12 all-time highs, surpassing US$5,500/oz intraday in late January 2026 amid heightened geopolitical risks and elevated options activity, before falling towards – and briefly dipping below – US$4,000/oz in late June.2
Spot gold (XAU) 30-day realised and implied volatility*
Mid-year Outlook 2026: Chart 2
Sources:
Bloomberg,
World Gold Council; Disclaimer
*Data as of 26 June 2026. Computed using XAU 1-month at-the-money implied volatility (1M ATM IVOL) and 30-day realised volatility (30D RVOL) based on daily returns. Averages are based on 30D RVOL.
Despite this recent price pullback, gold is still one of the best-performing assets of the last 12 months, with other assets playing catch-up (Chart 3).
Chart 3: Gold is down in 2026 but remains one of the best-performing assets over the past year
Return for gold and key asset classes in USD*
Mid-year Outlook 2026: Chart 3
Sources:
Bloomberg,
World Gold Council; Disclaimer
*Data as of 26 June 2026. Indices used: Bloomberg Barclays Global Treasury ex US, Bloomberg Barclays US Bond Aggregate, ICE BofA US 3-Month Treasury Bills, New Frontier Global Institutional Portfolio Index, MSCI World ex US Total Return Index, Bloomberg Commodity Total Return Index, MSCI EM Total Return Index, LBMA Gold Price PM USD, MSCI US Total Return Index.
Risk and momentum have driven performance
At a high level, gold responds to the interaction of four main drivers:
Risk and uncertainty: increases demand for gold as a hedge and a portfolio diversifier
Opportunity cost: makes gold more attractive as bond yields fall or currencies – especially the US dollar – depreciate, and vice versa
Momentum: captures the impact of short-term investment flows that amplify trends or induce mean reversion after controlling for fundamental drivers.
Our Gold Return Attribution Model (GRAM) indicates that the high-risk environment and changes in risk sentiment have been important contributors to gold’s performance y-t-d (Chart 4 and Table 1). Elevated geopolitical risk and market volatility explain a significant portion of the movement in price.
Momentum has also played a sizable role through investor positioning, trend following and profit taking.
Opportunity cost had a mixed effect, as markets constantly repriced expectations about bond yields and the direction of the US dollar.4
Chart 4: Risk, FX and momentum played an important role in gold’s H1 performance
Key drivers of gold’s return by month via GRAM*
Mid-year Outlook 2026: Chart 4
Sources:
Bloomberg,
World Gold Council; Disclaimer
*Data as of 26 June 2026. Our Gold Return Attribution Model (GRAM) is a multiple regression model of monthly gold price returns, which we group into four key thematic driver categories of gold’s performance: economic expansion, risk & uncertainty, opportunity cost, and momentum. Results based on analysis covering a five-year estimation period using monthly data. For more, visit: Goldhub.com.
Table 1: Much of gold’s variability in H1 can be explained by risk, FX and momentum
Contribution to price variability from key gold drivers for performance (%)*
Category
Metric
H1 variability
Economic expansion
12%
Risk & uncertainty
17%
Opportunity cost
FX
14%
Rates
3%
Momentum
24%
Total above
70%
Other factors**
30%
Total variability
100%
*Data as of 26 June 2026. Numbers may not add up to total due to rounding. Figures represent the percentage contribution of each driver to gold’s variability during H1 computed as the absolute value of a driver’s contribution to monthly performance compared to the absolute value of the total return. For more information on GRAM, please see Chart 4. **Other factors not included in the model are due to data availability (such as central bank purchases), transient effects, or analysis limitations. Source: World Gold Council
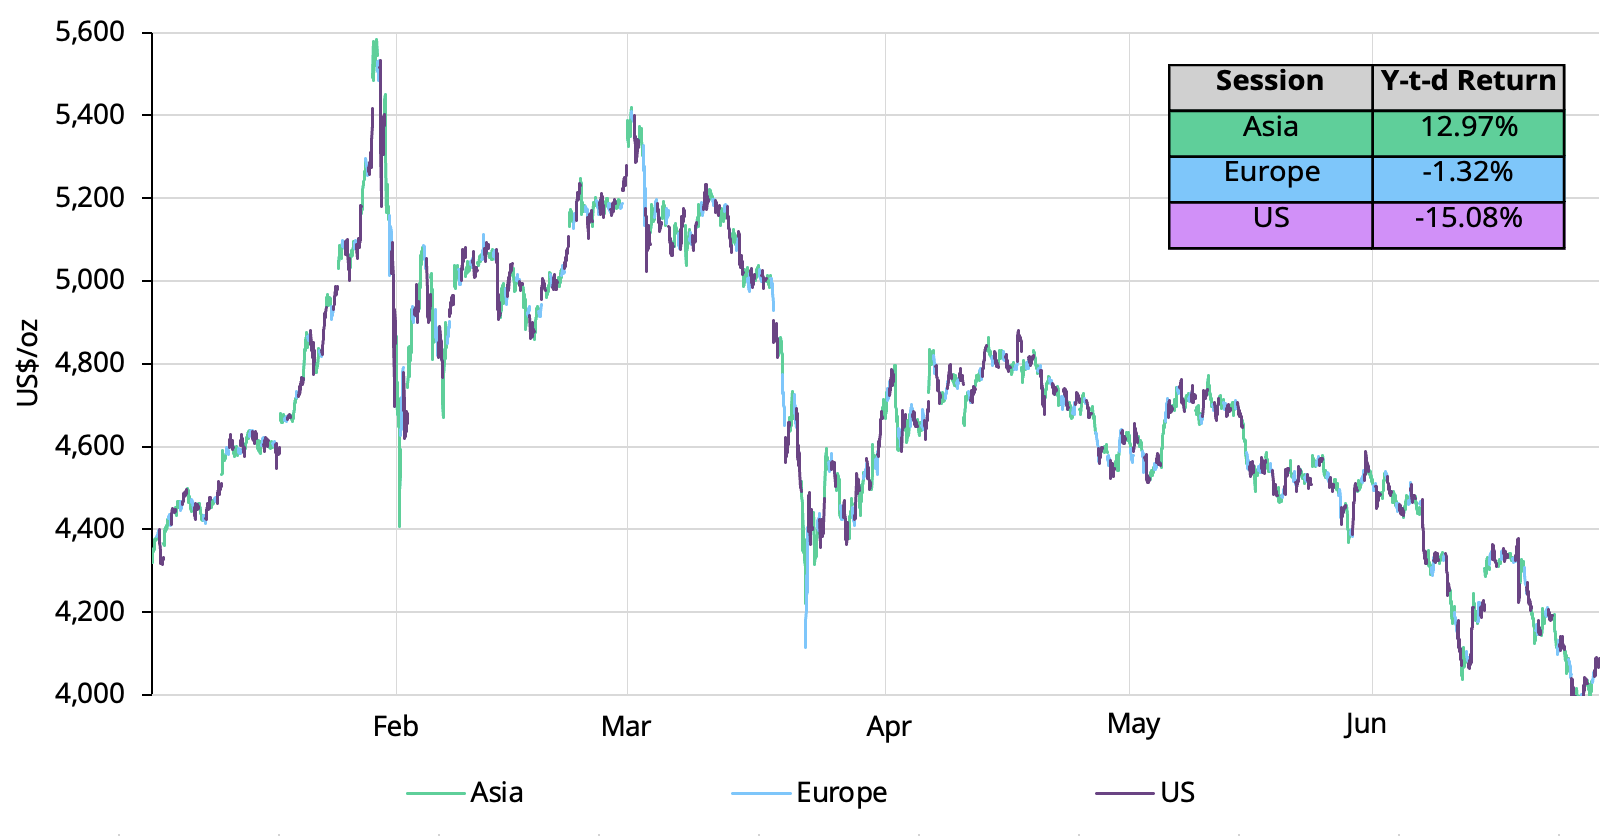
Interestingly, intraday analysis suggests that the bulk of gold’s movements have been linked to activity during Asian and US trading hours. Many of the pullbacks occurred during US hours and, conversely, gold’s rebounds generally occurred during Asian hours. This further highlights the increasingly relevant role that Asian investors (and consumers) play in price discovery and direction (Chart 5).
Chart 5: Asia has been the engine of price support
H1 gold performance by trading session*
Sources: Bloomberg, ICE Benchmark Administration, World Gold Council *Data as of 26 June 2026 based on spot gold (XAU) price US$/oz and using 20-min tick data. Sessions shown in New York time; UTC equivalents are Asia 22:00–07:00, Europe 07:00–12:00, and US 12:00–21:00.
H2: Point break
Looking to the future, investors are asking two main questions:
What factors would push gold up or down from these levels and by how much?
The gold price as a barometer of global market dynamics
At the time of writing, bond markets and consensus expectations suggest that:6
Before year-end, the Fed, Bank of England, Bank of Japan, and European Central Bank will likely increase their policy rates, with the Fed hike by October
The global economy is expected to grow by 2.9% y/y in 2026, with the US forecast at 2.1% y/y, in line with its average since 2000
US inflation is expected to peak near 3.9% in Q2 before cooling slightly with global inflation averaging 4.3% for the year
Although the US dollar held up during the US–Iran conflict and has reacted positively to signs of its resolution, expectations for the second half vary widely as counterbalancing factors could push its performance either way.
Our Gold Valuation Framework, which links drivers of performance to demand and supply, suggests that the gold price is fairly aligned with macro consensus.
Importantly, as gold is a global asset that is bought and sold by consumers and investors around the world, its price also reflects an international perspective. So, while factors such as the direction of US rates and the dollar remain important, they are not the sole determinants of the direction the gold price takes.
Overall, the gold price today broadly reflects these dynamics. This implies, based on our analysis, that if current conditions do not materially change, gold may trade ±5% around US$4,100/oz during the second half of the year.
Can gold resume its upward trend?
The short answer is yes; but it requires a clear catalyst. This could come from three primary sources:
Worsening economic or geopolitical conditions
A reversal in interest-rate expectations
Long-term investor participation.
In this context, our macro-based scenario analysis suggests that gold could resume its upward trend around US$4,500/oz, but only a strong, clear signal may push it sustainably towards US$5,000/oz.
Geoeconomics
So far, the US economy has been moving at pace. The stock market, supported by the tech sector and AI boom, has generally shrugged off the effects of the US–Iran conflict. But valuations continue to draw scrutiny as market participants try to disentangle the tangible gains from the hype.7 In addition, rate hike expectations have partly tempered the stock market momentum.
Focus 1: US midterm elections
The market has also been focusing on the potential implications of the November 2026 US midterm elections, which are shaping up to be closely contested.
Democrats are positioned to regain control of the House while the Senate may remain in Republican hands (Chart 6).
However, this midterm cycle could have tangible implications for the balance of power, potentially increasing policy uncertainty and supporting demand for gold as a hedge.
*Data for House ratings as of 11 June 2026 and for the Senate as of 23 April 2026.
Private credit markets are also creating a source of concern. Spillover effects from strangled energy supplies or from new, yet unforeseen, geopolitical tensions could trigger flight-to-quality flows, putting pressure on illiquid assets.8
And while gold did not react positively to the Middle East turmoil, it was not the only asset class defying expectations.9 We believe that a combination of idiosyncratic factors made this event’s impact on gold the exception rather than the rule.
While the market expects the Fed to increase rates at least once before the end of the year,10 official projections remain split. The Fed’s latest dot-plot median is slightly hawkish11, but half the entries – notably without Chairman Warsh’s participation – remain at or below current levels for 2026.12 A shift back to more dovish expectations would likely benefit gold.
Further, the Trump administration has been consistently vocal about the direction in which it wants to see interest rates move – namely, down.13
The market remains generally confident in Chairman Warsh and was reassured by his first press conference, in which he focused on price stability.14 However, it’s worth noting that questions about Fed independence shook markets in early January and were one of the factors behind gold’s rise, particularly as such issues not only affect Treasury yields, but also have the potential to weaken the US dollar’s role in the global monetary system.
Sticky flows
The gold market has benefited from various structural shifts over the past two decades, including growth in emerging markets, the advent of gold ETFs, an increase in tail risk events, and central bank demand.
More recently, sovereign wealth funds, pension funds, and endowments, and other long-term asset owners have also been increasing their participation. Last year, a pilot programme in China enabled some of the top insurance companies to invest in gold.
The contribution from these types of buy-and-hold investors could also provide further support for gold in the second half.
What can push gold lower?
In recent months, gold has been more susceptible to downside risks. Following its exceptionally strong 2025 performance, many investors have looked to take profits or rebalance holdings. The volatility increase has not helped either, as risk managers have reviewed their exposure to gold.
Factors that could bring further headwinds for gold include:
US dollar strength and rates rising beyond current expectations
Investor risk-on sentiment
Technical factors.
Overall, our macro-based scenario analysis suggests that if gold were to decline by 10%–15% from current levels, further downside would likely be limited as, historically, lower prices trigger buying from various sectors.
Goldilocks
Positive US and global economic growth, especially if combined with a reduction in geoeconomic risk, could push investors to increase their risk asset exposure at the expense of allocations to gold.
A significant portion of gold’s performance since 2025 has been linked to geopolitical risk. A sustained reduction may curtail gold’s risk premia.
Stronger growth may also create a positive environment for the US dollar, justifying a rise in rates beyond that required solely to contain a temporary shock.
And while a rate hike is not necessarily bad for gold, the context in which it occurs matters. What matters more than the policy rate itself is how markets interpret the implications of tightening for growth, inflation credibility, financial stability and the US dollar. If a hiking cycle materially improves the market's assessment of Fed credibility, gold could face additional pressure.
Further, convergence of global interest rates to higher levels would also raise the opportunity costs of gold in different regions, creating further headwinds.
Technicals
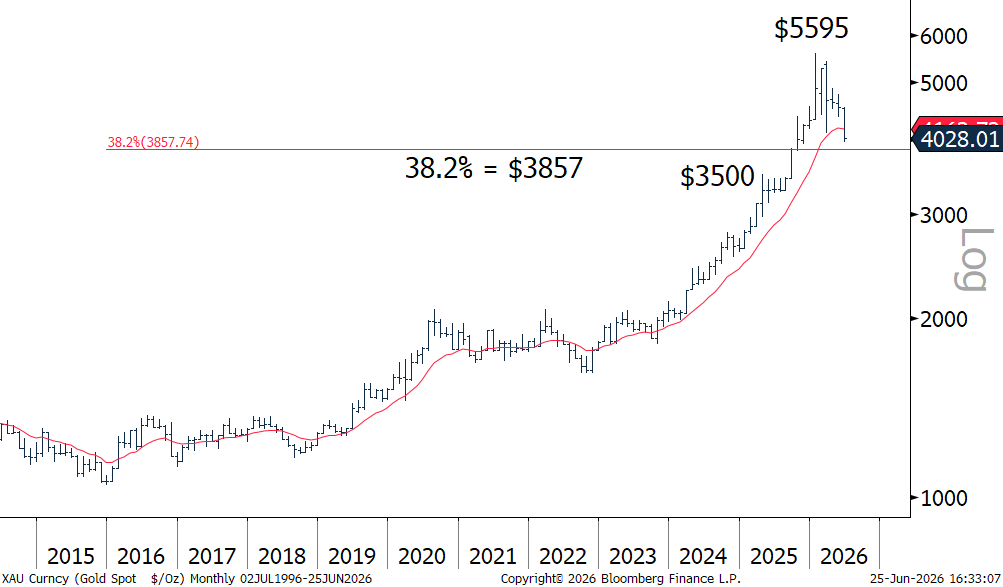
In addition, gold is still well above its two-year average,15 having moved up rapidly once it surpassed US$3,500/oz. Some investors use technical indicators of relative strength and positioning as a guide to express short-term views. In this context, “psychological” and other technical levels can act as trigger points for gold. For example, if gold were to trade below ~US$3,860/oz it could experience an additional leg down (Chart 8).
Chart 8: Gold is approaching its next technical support level
Spot gold (XAU) monthly technical analysis*
*Data as of 25 June 2026. Source: Bloomberg, World Gold Council
In addition, organic demand – whether from consumers, longer-term investors or central banks – has historically supported gold after more sizable pullbacks.
Gold drawdowns below key thresholds have been relatively contained. For example, since 197116 there have been eight episodes in which gold has dropped by more than 20% after reaching a record high17, with an average drawdown of 36% and a median of 29% (Table 2).18 At present, the gold price is approx. 25% below its record high.19
Table 2: Gold drawdowns tend to stabilise around 30% from a previous peak
Depth of historical gold price drawdowns*
Threshold
Number of occurrences
Average drawdown
Median drawdown
–5% or more
29
16%
8%
–10% or more
11
30%
28%
–20% or more
8
36%
29%
*Data from 1 January 1971 to 26 June 2026: Drawdowns are measured from gold’s prior running peak. Threshold episodes begin when gold falls to or below a specified drawdown level and end when prices recover above that threshold. Duration is measured in trading days. Historical patterns do not preclude larger or more prolonged corrections. The current drawdown starting 29 January 2026 is excluded from the analysis above. Source: Bloomberg, World Gold Council
Beyond macro
Two market segments can influence gold’s performance beyond the macroeconomic and geopolitical scenarios we’ve outlined:
In the first quarter of this year various central banks tactically sold (or swapped) gold. Despite this, initial estimates suggest that banks will continue to be consistent net buyers this year, but questions have been raised about the pace of their purchases.
Our recent Central Bank Gold Reserves Survey indicates that appetite from the official sector will continue. An increasing proportion of reserve managers noted that they expect their own gold reserves to rise over the next twelve months. But an increase in the number of central banks entering the market does not necessarily signal the magnitude of their purchases.
Our analysis suggests that, all else equal, an additional 20t–30t increase in reserves above the long-term average of around 600t per year should translate into approximately a 1% increase in the gold price.20 This effect comes not only from the central bank purchases themselves but also from the positive signal it sends to investors. For example, gold tends to exhibit strong returns in periods when the combined contribution from central banks and investment to total demand exceeds 30% (Chart 9).
A marked deceleration in central bank buying would, of course, create headwinds for gold.
Chart 9: There’s a strong link between gold returns and buying from investors and central banks
Gold returns vs investment and central bank demand share*
Mid-year Outlook 2026: Chart 9
Sources:
Metals Focus,
World Gold Council; Disclaimer
*Data from Q1 2000 to Q4 2025. Combined bar and coin, gold ETF and central bank quarterly demand and quarterly spot gold price return in US$/oz.
The Indian market juggernaut
India is gold’s second largest market with net demand of 800t per year.21 But unlike China, whose gold market appears to be responding as expected to current conditions, India needs to import all its gold – a factor that regularly weighs on its current account deficit.
As the US–Iran conflict affected India’s oil supply and energy prices, the government was forced to intervene to conserve foreign exchange reserves amid mounting pressure on the INR. Since early April, it has adopted a series of measures aimed at moderating gold imports, including a sharp duty increase – from 6% to 15% – and consumer-directed messaging aimed at curtailing gold purchases.
We believe the impact from the increased duty should already be reflected in the gold price. But further economic deceleration could impact Indian gold demand through the well-established income effect, deterring Indian consumers and investors from taking advantage of pullbacks to enter the market. Furthermore, defaults on collateralised gold loans – which have been gaining traction over the past few years – could increase, thus boosting gold supply (see Gold Outlook 2026).
In sum
Gold’s performance in the first half of 2026 underscores its sensitivity to shifting macroeconomic conditions, geopolitical risk, and investor sentiment, while highlighting the growing influence of global, particularly Asian, demand. Looking ahead, gold is likely to remain rangebound under current expectations but retains clear upside potential if risks intensify or policy expectations shift (Tables 3 and 4).
At the same time, structural support from central banks and long-term investors may help limit downside, reinforcing gold’s role as a strategic and resilient asset in an uncertain global environment.
Table 3: Hypothetical macroeconomic scenarios and their impact on gold for H2 2026*
Scenario
Sentiment
Range
Uptrend
Bullish
+5% to +20%
Macro consensus
Rangebound
–5% to +5%
Price consolidation
Bearish
–5% to –15%
Table 4: Gold price sensitivity to key variables all else equal*
Variable
Relationship
Gold price sensitivity
Central banks
Directly proportional
20t—30t equates to a 1% increase/decrease
Indian import duty
Inversely proportional
10% increase in duty implies a 2% decrease
Interest rates
Inversely proportional
25bp decrease in the US 10y yield equates to a 1.75% increase
Inflation
Directly proportional
1% increase in CPI implies a 0.5% increase
Geopolitical risk
Directly proportional
100pt increase in GPR per month is equivalent to a 2.5% increase
*As of 26 June 2026. Hypothetical scenarios and price impact based on our Gold Valuation Framework using quarterly data from Q1 2000 to Q1 2026. Source: Bloomberg, Oxford Economics, World Gold Council
Footnotes
1Based on the LBMA Gold Price PM as of 26 June 2026.
2The LBMA Gold Price reached a high of US$5,405.00 on 29 January and a low of US$4,001.80 on 25 June. Spot gold (XAU) reached an intraday high of US$5,595.47 on 29 January and an intraday low of US$3,959.33 on 24 June.
3Based on 30-day realised volatility for daily returns on spot gold (XAU).
4Despite recent strength, the US dollar has experienced periods of weakness during H1 2026, most notably in January and then again in April, which provided partial support for gold.
5We have addressed the question on valuation at a more fundamental level with our Gold Long-Term Expected Return model. An equivalent and perhaps more relevant question at present is whether gold’s fundamentals justify the current price, which we address in the following section.
6Based on implied probabilities derived from bond market futures and Bloomberg median forecasts of economic data as of 26 June 2026.
15As of 26 June 2026, the LBMA Gold Price PM 2-year avg. is ~US$3,520/oz.
16We use 1971 as a starting point, as it is the year when the Gold Standard ended and the Bretton Woods system collapsed.
17The S&P 500 has had seven such periods over the same time horizon with a similar average pullback.
18Gold’s largest pullback was in 1980 when it dropped by more than 65%, but we believe that the conditions for such drop would be unlikely to occur given the current structure of the gold market.
19Calculated using the LBMA Gold Price PM of US$5,405/oz on 29 January to US$4,072.05/oz on 26 June.
20The long-term average is based on quarterly data between Q1 2010 and Q4 2025. The elasticity between demand and price is based on quarterly modelling through our Gold Valuation Framework.
21Based on a 5-year average as of 2025. Net demand defined as (jewellery + technology – recycling) + (bar and coin) + gold ETFs. See Goldhub.com
Diversification does not guarantee any investment returns and does not eliminate the risk of loss. Past performance is not necessarily indicative of future results. The resulting performance of any investment outcomes that can be generated through allocation to gold are hypothetical in nature, may not reflect actual investment results and are not guarantees of future results. The World Gold Council and its affiliates do not guarantee or warranty any calculations and models used in any hypothetical portfolios or any outcomes resulting from any such use. Investors should discuss their individual circumstances with their appropriate investment professionals before making any decision regarding any Services or investments. This information may contain forward-looking statements, such as statements which use the words “believes”, “expects”, “may”, or “suggests”, or similar terminology, which are based on current expectations and are subject to change. Forward-looking statements involve a number of risks and uncertainties. There can be no assurance that any forward-looking statements will be achieved. World Gold Council and its affiliates assume no responsibility for updating any forward-looking statements.
Information regarding QaurumSM and the Gold Valuation Framework
Note that the resulting performance of various investment outcomes that can be generated through use of Qaurum, the Gold Valuation Framework and other information are hypothetical in nature, may not reflect actual investment results and are not guarantees of future results. Neither World Gold Council (including its affiliates) nor Oxford Economics provides any warranty or guarantee regarding the functionality of the tool, including without limitation any projections, estimates or calculations.