You asked, we answered: Has gold's performance structurally changed?
16 April, 2026
Highlights
- Gold’s volatility has markedly increased in 2026; however, similar episodes have occurred in periods of risk with volatility usually normalising within a few months
- Bid-ask spreads have also notably risen since 2024; however, barring unusually high spikes in off market hours, the gold market still offers sizable liquidity through record trading volumes and two-way market activity
- Amid a visible increase in the bond-equity correlation, gold remains a valuable strategic asset and portfolio diversifier even when accounting for its higher volatility environment.
Has gold’s volatility persistently increased?
Key drivers behind gold’s rising volatility
Gold’s volatility has picked up in 2026 (Chart 1). It breached its historical upper quartile, rising to the top fifth percentile of the data series since 1971. The drivers of such large swings in the gold price are discussed in our Gold Market Commentary from January, February and March, and include:
- Cooling Fed rate cut expectations and upticks in bond yields sparked by various triggers such as the announcement of Kevin Warsh as Fed Chair nominee in late January and the Middle East conflict that pushed up inflationary concerns in late February
- A strengthening of the USD, reversing a three-month declining trend
- Investor unwinding of long positions in futures, options and gold ETFs following the final exponential surge in gold’s rally, which took it from US$5,000/oz to US$5,500/oz in just three days
- Stop-loss orders, which amplified gold’s moves when it breached down through key thresholds.
Chart 1: Gold’s volatility has picked up in the beginning of 2026, akin to the spikes seen in previous periods of risk
Gold’s monthly realised volatility since 1971*
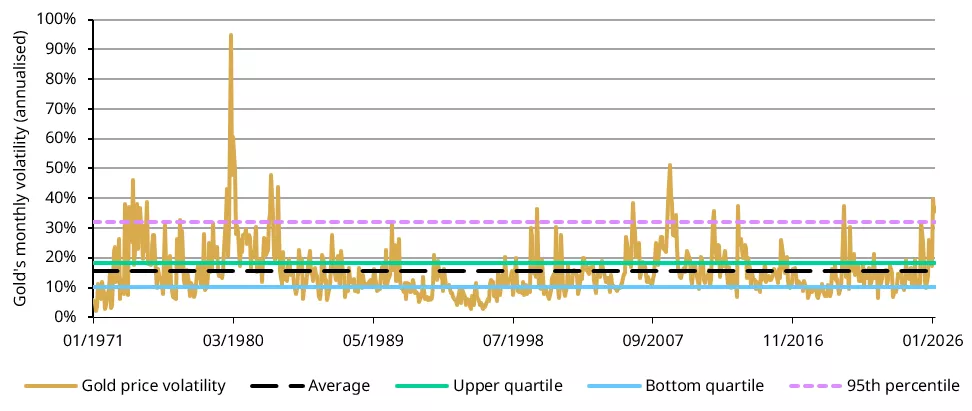
*Based on daily returns of the LBMA Gold Price PM in USD from 1 January 1971 to 31 March 2026.The long-term average is based on monthly volatility data between January 1971 and March 2026
Source: ICE Benchmark Administration, World Gold Council
And while the gold market rebounded a couple of times, continued geopolitical risk increased liquidity needs during market stress adding further pressure, especially as the war in the Middle East affected important trading and demand hubs such as Dubai.
It is important to note that gold is not the only asset whose volatility has increased in 2026 (Chart 2). Volatilities of equities and bonds have increased sizably in March. And such episodes have happened before. For instance, during the Global Financial Crisis (GFC), investors sold gold, given its ample liquidity conditions and prior robust performance, to meet other margin calls or liquidity needs. Similar actions were seen when the COVID-19 pandemic took its toll on global financial markets. In most of these incidents, gold has done well and helped investors accumulate “emergency funding sources”. And gold also delivered robust returns when liquidity crunches were over. This is one of the key edges shaping gold’s strategic status in investors’ portfolios: the liquidity source during market stress.
Chart 2: Gold’s historical volatility surges were not isolated
Annualised cross asset monthly volatility *
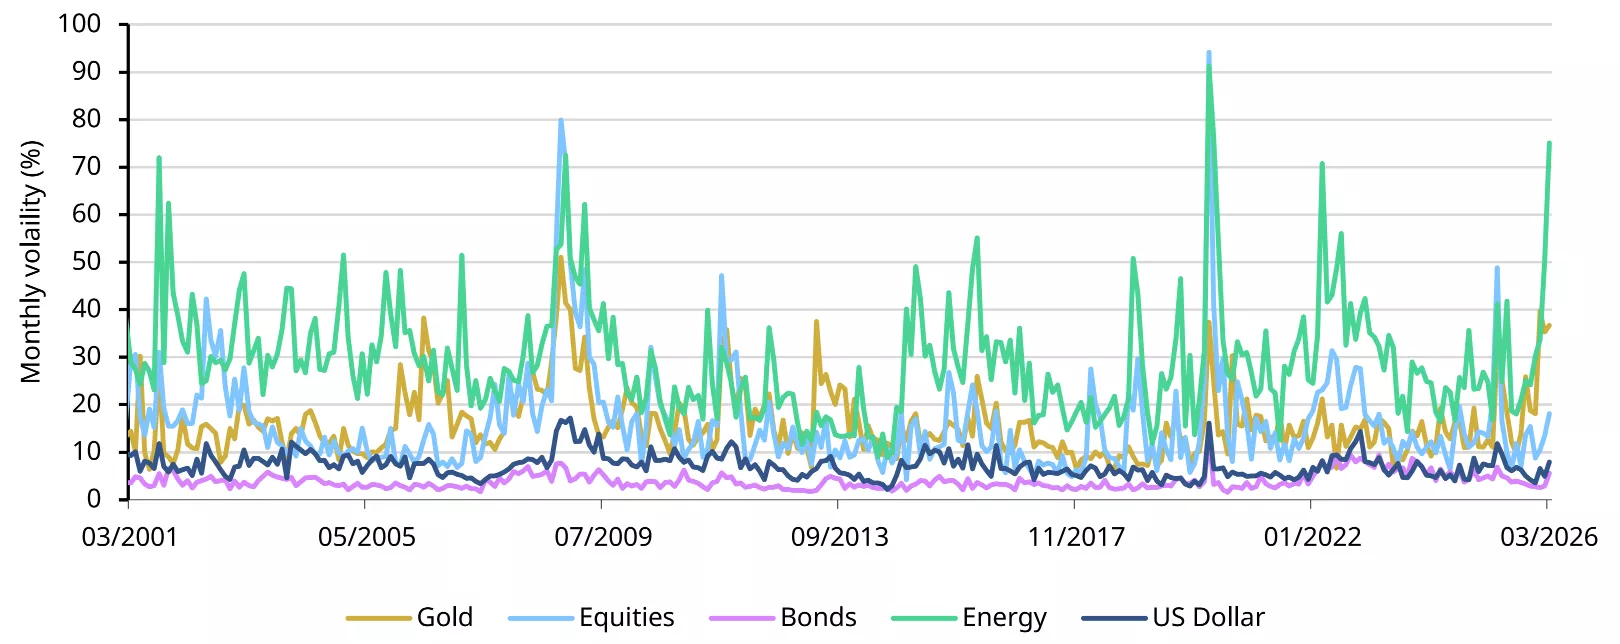
*Annualised monthly volatility based on daily returns of LBMA Gold Price PM, the S&P 500 Total Return Index, the Bloomberg US Agg Total Return Index, Bloomberg Energy Total Return Subindex, and the US Dollar Index.
Source: Bloomberg, ICE Benchmark Administration, World Gold Council
Will gold’s heightened volatility ease?
Our analysis shows that gold’s volatility is mean reverting (Chart 3). As shown in Chart 1, gold’s annualised volatility has generally remained between 10% and 18% during most days. Furthermore, historical data suggests a volatility ‘half-life’ (the time it takes for a volatility shock event’s impact to halve) of around 1.6 months, similar to that of equities. The implication is clear: while gold volatility can surge to levels unseen for years, it has historically reverted towards its long‑run norm.
Chart 3: Historical data suggests gold volatility shocks halve after 1.6 months
Left: Decay of a shock’s impact on gold’s volatility; Right: Historical patterns following a volatility shock*
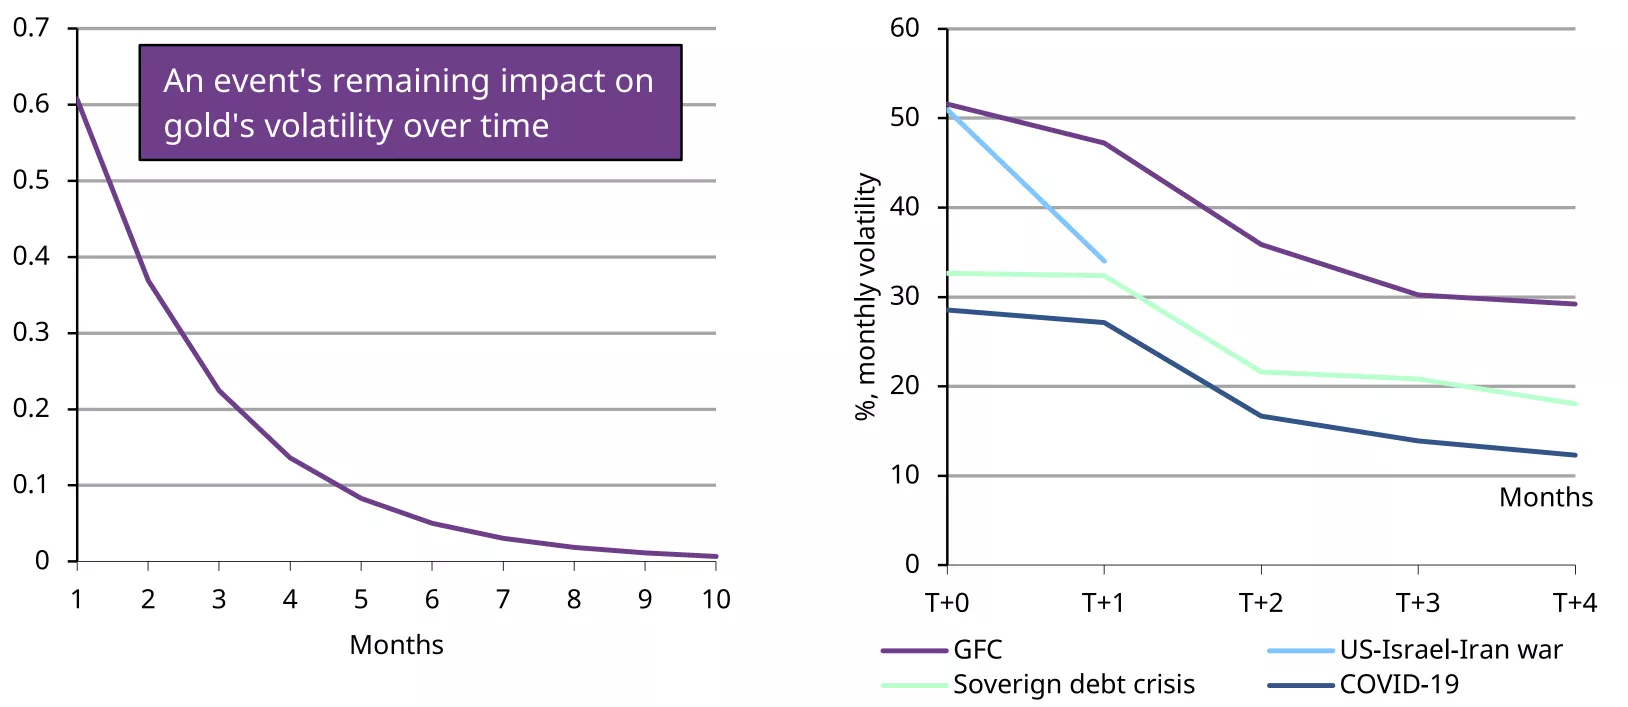
*Auto Regression of order 1 based on log monthly volatilities shows ρ=0.65 and statistically significant at 99% confidence. The half-life is computed by: log(2)/( -log( ρ )). Monthly volatilities are based on daily returns of LBMA Gold Price PM in dollars between January 1971 and March 2026. Historical volatility dates used: GFC: October 2008; US-Israel-Iran war: February 2026; Sovereign debt crisis: September 2011; COVID-19: March 2020.
Source: Bloomberg, World Gold Council
Was gold market liquidity impacted by sell-offs?
Gold trading activity surged sharply during recent market sell-offs, underscoring its deep liquidity in periods of stress (Chart 4). During the last week of January, as the gold price pulled back, average daily gold trading volumes across major venues reached US$965bn/day, or 5,805t/day – the highest level on record. Over-the-counter (OTC) activity, driven largely by LBMA members, averaged US$395bn/day, up 41% w/w. Volumes on major exchanges jumped 45% to US$520bn/day, led by strong increases on COMEX and the Shanghai Futures Exchange (SHFE), while gold ETF trading surged 137% w/w to US$49bn/day.
A similar pattern emerged in March. As gold prices corrected, average daily trading volumes rose to US$525bn/day, up 11% m/m and 46% above the 2025 average of US$361bn/day, with LBMA OTC and COMEX activity particularly strong. This mirrored activity seen in March 2020 when the COVID‑19 pandemic hit global markets and triggered selloffs, global gold trading volumes spiked, reinforcing gold’s role in providing deep liquidity during periods of broad financial stress.
Chart 4: Gold market liquidity ample during recent pullbacks
Gold market trading volumes across different segments*
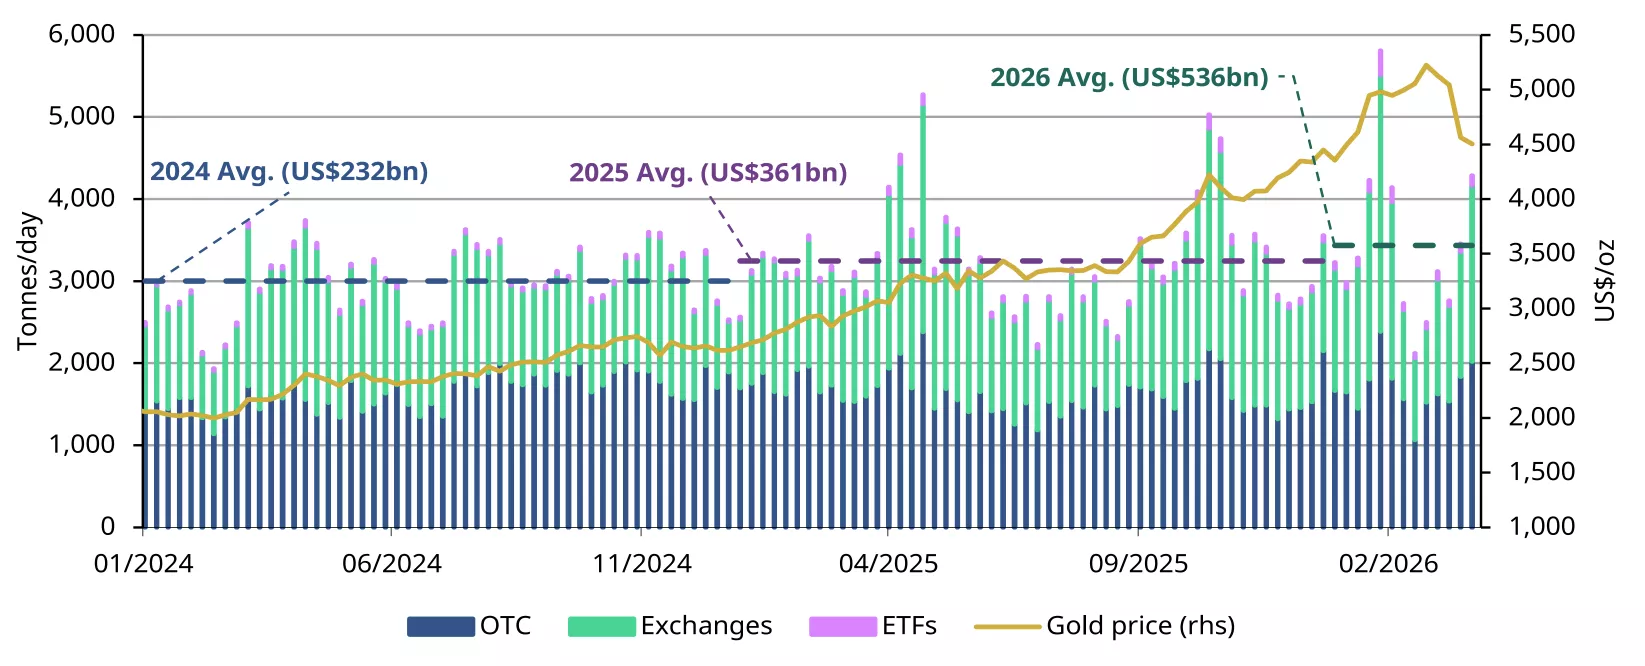
*Weekly data as of 27 March 2026. For more, see: Gold Trading Volume | Gold Daily Volume | World Gold Council.
Source: Bloomberg, Nasdaq, COMEX, ICE Benchmark Administration, Shanghai Gold Exchange, Shanghai Futures Exchange, ETF providers, Multi Commodity Exchange of India, Dubai Gold & Commodities Exchange, Japan Exchange Group, Thailand Futures Exchange, Borsa Istanbul, Bursa Malaysia, Korea Exchange, World Gold Council
Meanwhile, the intraday bid-ask spread offers a clearer gauge of market depth. Gold has been hit by several episodic shocks in recent months, but the striking feature is how short-lived these bouts of spread widening have been (Chart 5). Notably, the four largest spikes occurred either on Sunday night into Monday morning or late Thursday night into Friday, when prices gapped higher or lower into the Asia open amid thinner liquidity, before quickly normalising.
Chart 5: Spread widening has been episodic, short lived, and mostly outside standard trading hours
Time weighted average bid ask spread in bps*
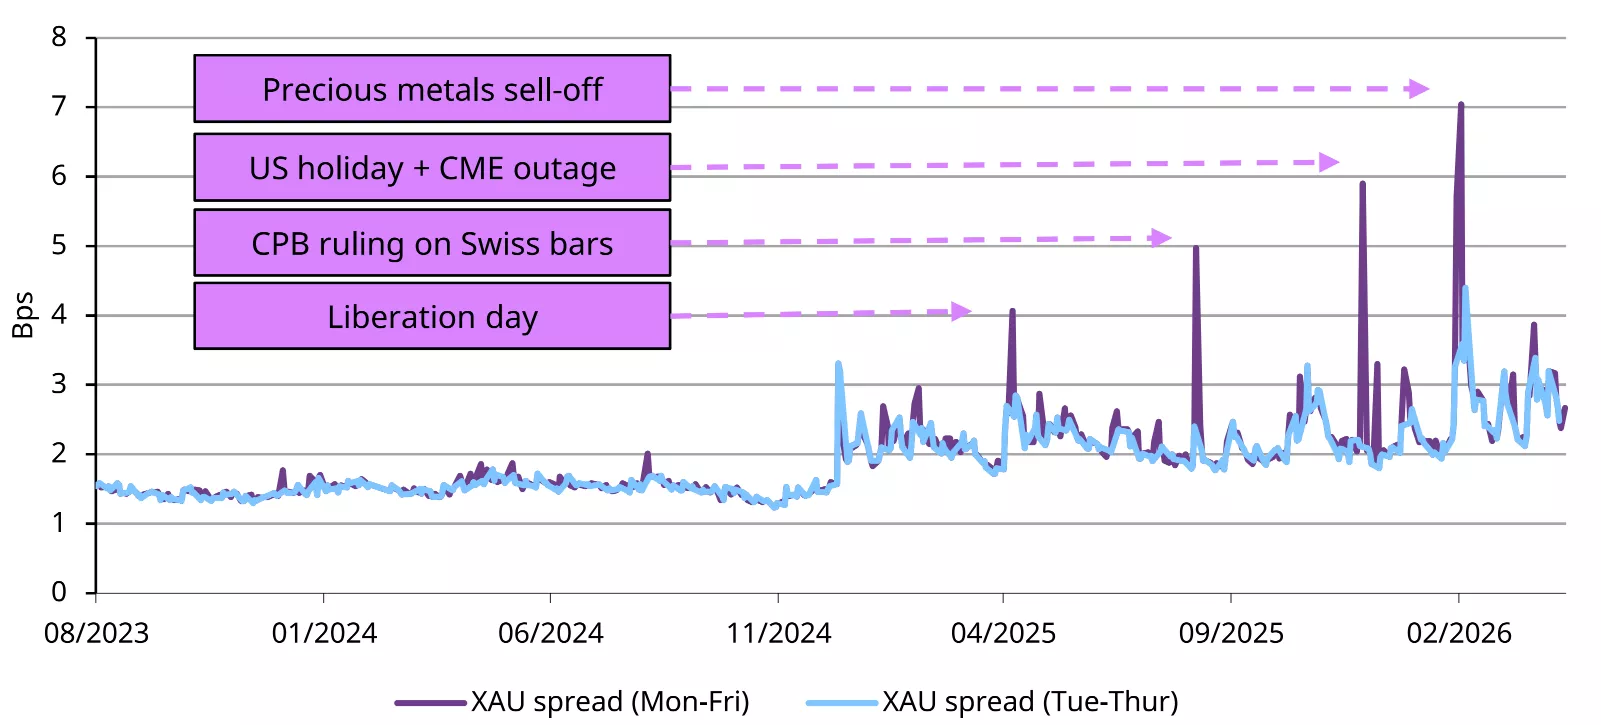
*Data as of 13 April 2026. The purple line shows XAU’s time‑weighted average bid‑ask spread across all trading days (Monday–Friday), while the blue line includes only Tuesday–Thursday, excluding periods more prone to thin liquidity and price gaps.
Source: Bloomberg, World Gold Council
We also examined an alternative measure of liquidity by looking at bid-ask spreads relative to realised volatility. Although spot gold saw wider spreads during episodes of market stress over the past two years, this appears to have been driven largely by higher volatility rather than a sustained deterioration in liquidity. On a volatility-adjusted basis, spreads have remained broadly within their historical range and have already eased from prior peaks (Chart 6). This suggests that the widening in spreads was episodic rather than structural and should continue to normalise as volatility recedes.
Chart 6: Gold bid-ask spreads per unit of volatility have fallen from prior stress peaks
Time weighted average bid-ask spread relative to 30-day realised volatility*
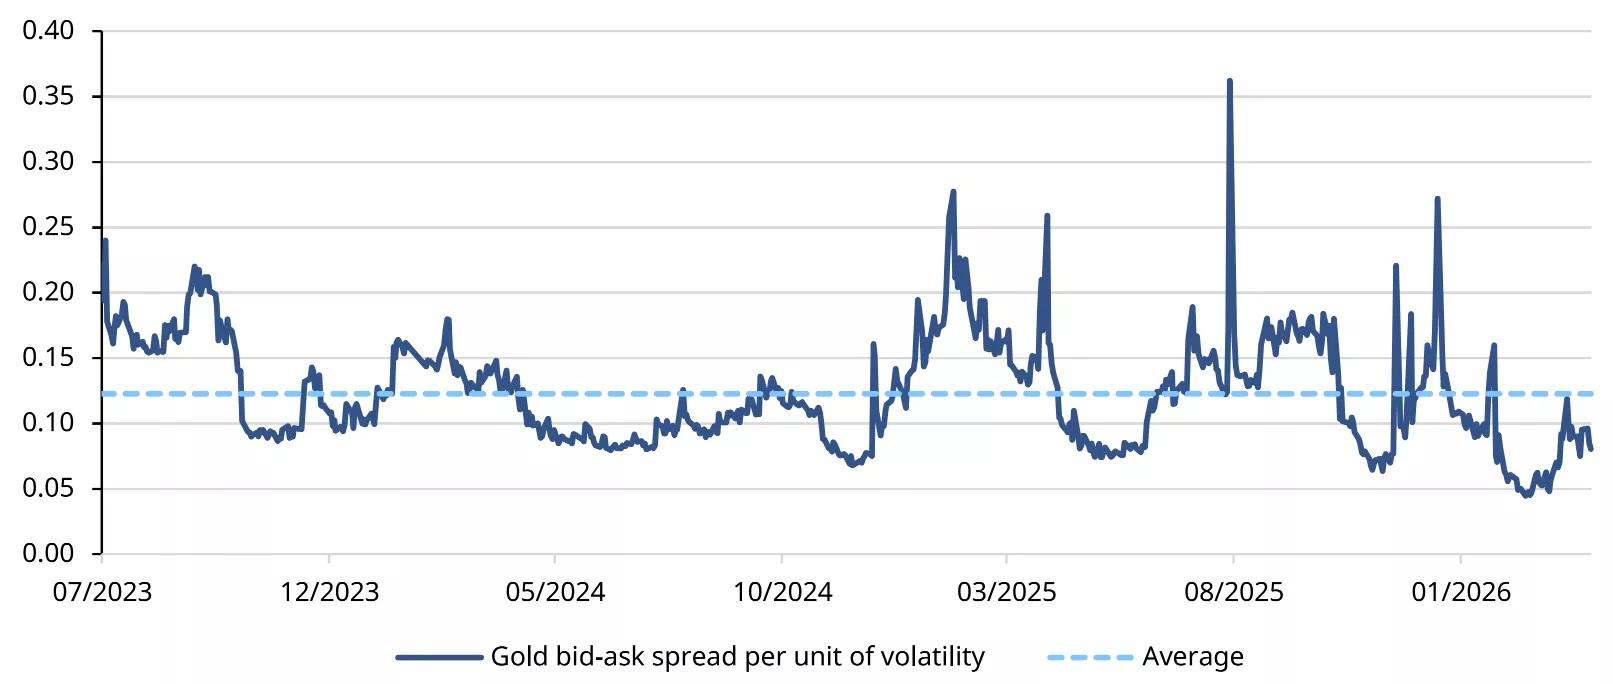
*Data as of 8 April 2026. Ratio calculated as time-weighted average bid-ask spread divided by 30-day realized volatility for spot gold (XAU US$/oz)
Source: Bloomberg, World Gold Council
Is gold still the strategic asset for portfolios?
Despite recent volatility spikes, gold remains a strategic asset in investors’ portfolios. Inflation shocks typically lead to positive bond-equity correlations due to their adverse effects on both asset classes. And the recent spike in oil prices linked to the Iran conflict will likely reinforce inflation-related volatility. Meanwhile, gold maintains its low-negative correlation with risk assets, offering investors a safe-haven (Chart 7).
Chart 7: Gold’s correlation with equities has been consistently low
Left: bond-equity correlation; Right: gold-equity correlation*
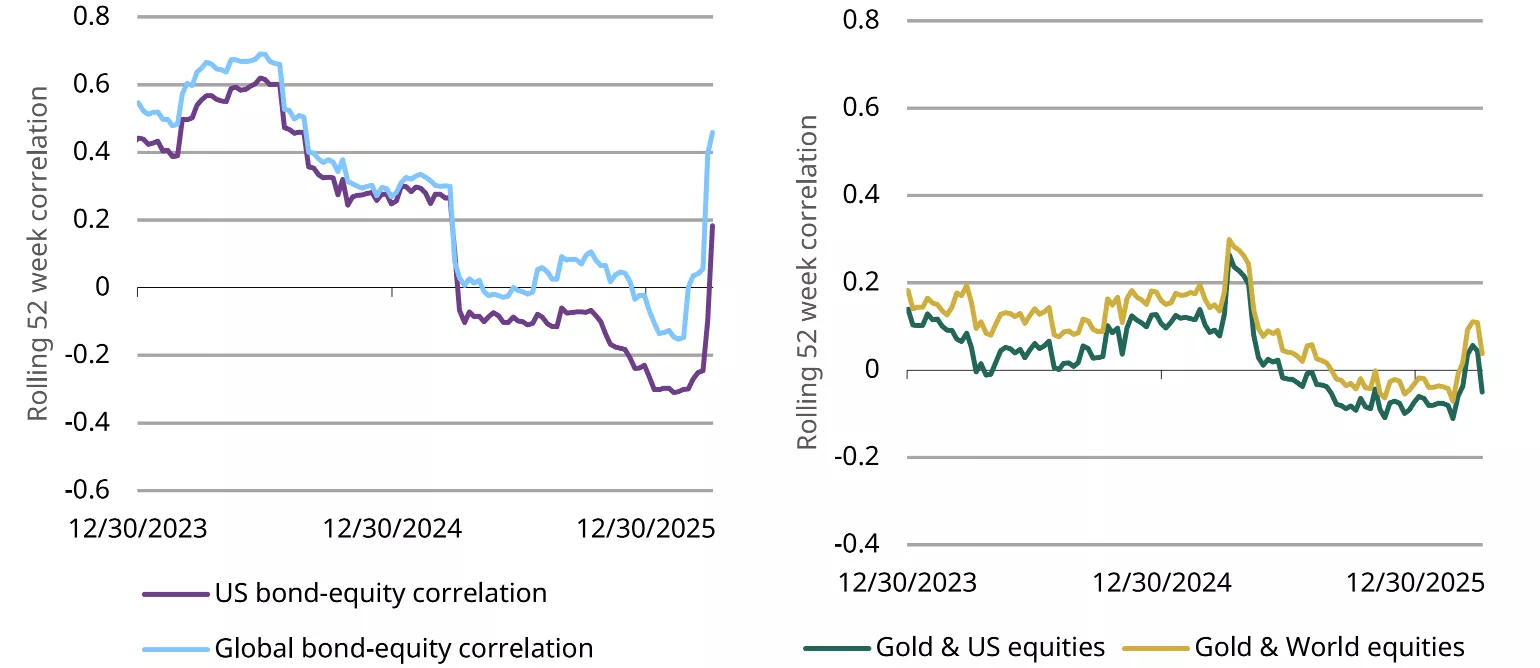
*Weekly data from December 2023 to March 2026. Based on MSCI US Index, MSCI World Index, Bloomberg US Bond Index, Bloomberg Global Bond Index and LBMA Gold Price PM.
Source: Bloomberg, World Gold Council
As such, adding gold to a diversified portfolio continues to help reduce overall risk due to its correlation profile with both bonds and equities, even during recent episodes when gold’s volatility has risen. Our analysis of a hypothetical portfolio of global stocks and bonds confirms this (Chart 8). Furthermore, it is common for gold to retract initially during periods of risk as it is used as a source of liquidity, but to recover and outperform other asset classes when heightened uncertainty persists. As such, the addition of gold has a very a low contribution to portfolio risk while visibly reducing its overall volatility.
Chart 8: Adding gold can reduce overall portfolio volatility without significantly increasing the risk budget due to its low correlation to equities and bonds
A typical 60/40 global portfolio without gold and with 5% gold between January 2025 and April 2026*
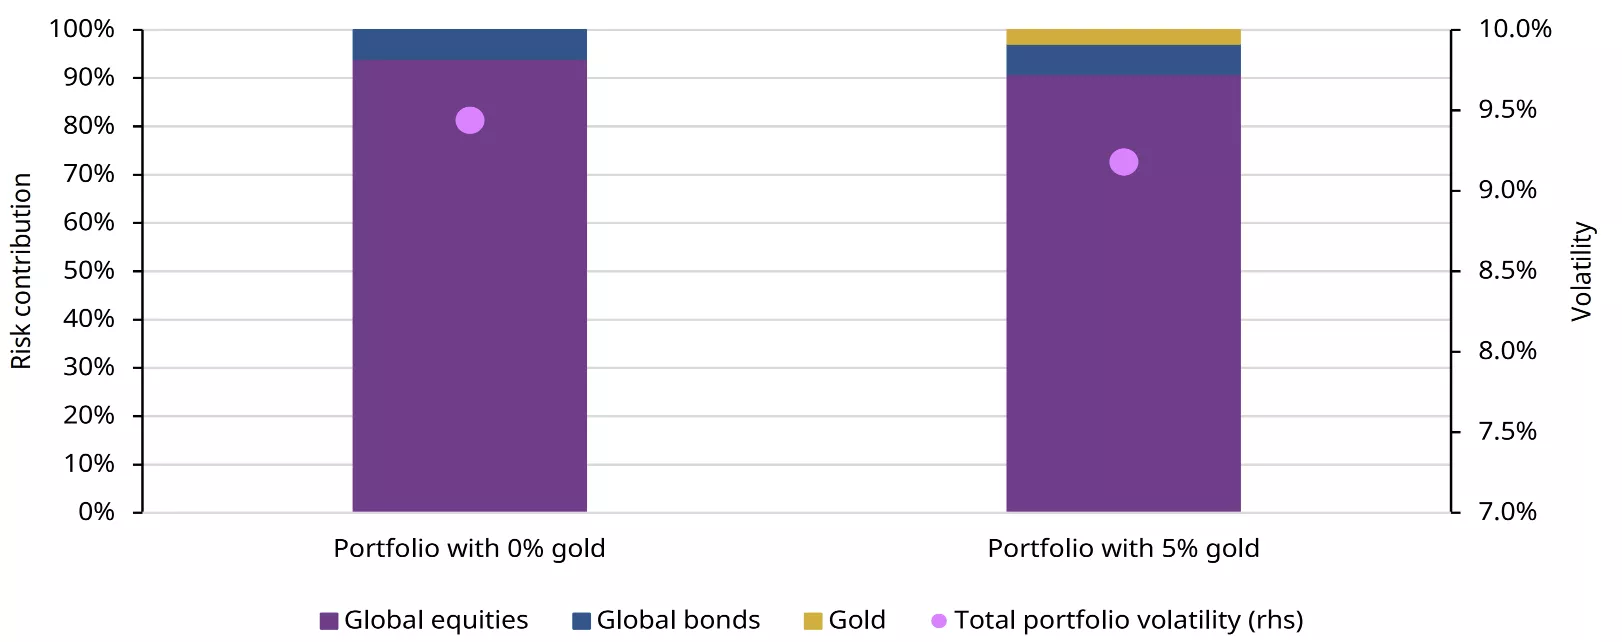
*Weekly data from 1 January 2025 to 10 April 2026. Portfolio (without/with gold): Global equities: MSCI World Index (60%/57.5%), Global Aggregate bonds: Bloomberg Global Bonds Agg Index (40%/37.5%). Risk contribution is calculated by multiplying each asset class weight by its weighted covariance with other assets, then dividing by the portfolio variance. Portfolio risk represents the volatility of the entire portfolio over the predefined periods shown on the chart.
Source: Bloomberg, World Gold Council
Disclaimer
Important information and disclaimers
© 2026 World Gold Council. All rights reserved. World Gold Council and the Circle device are trademarks of the World Gold Council or its affiliates.
All references to LBMA Gold Price are used with the permission of ICE Benchmark Administration Limited and have been provided for informational purposes only. ICE Benchmark Administration Limited accepts no liability or responsibility for the accuracy of the prices or the underlying product to which the prices may be referenced. Other content is the intellectual property of the respective third party and all rights are reserved to them.
Reproduction or redistribution of any of this information is expressly prohibited without the prior written consent of World Gold Council or the appropriate copyright owners, except as specifically provided below. Information and statistics are copyright © and/or other intellectual property of the World Gold Council or its affiliates or third-party providers identified herein. All rights of the respective owners are reserved.
The use of the statistics in this information is permitted for the purposes of review and commentary (including media commentary) in line with fair industry practice, subject to the following two pre-conditions: (i) only limited extracts of data or analysis be used; and (ii) any and all use of these statistics is accompanied by a citation to World Gold Council and, where appropriate, to Metals Focus or other identified copyright owners as their source. World Gold Council is affiliated with Metals Focus.
The World Gold Council and its affiliates do not guarantee the accuracy or completeness of any information nor accept responsibility for any losses or damages arising directly or indirectly from the use of this information.
This information is for educational purposes only and by receiving this information, you agree with its intended purpose. Nothing contained herein is intended to constitute a recommendation, investment advice, or offer for the purchase or sale of gold, any gold-related products or services or any other products, services, securities or financial instruments (collectively, “Services”). This information does not take into account any investment objectives, financial situation or particular needs of any particular person.
Diversification does not guarantee any investment returns and does not eliminate the risk of loss. Past performance is not necessarily indicative of future results. The resulting performance of any investment outcomes that can be generated through allocation to gold are hypothetical in nature, may not reflect actual investment results and are not guarantees of future results. The World Gold Council and its affiliates do not guarantee or warranty any calculations and models used in any hypothetical portfolios or any outcomes resulting from any such use. Investors should discuss their individual circumstances with their appropriate investment professionals before making any decision regarding any Services or investments.
This information may contain forward-looking statements, such as statements which use the words “believes”, “expects”, “may”, or “suggests”, or similar terminology, which are based on current expectations and are subject to change. Forward-looking statements involve a number of risks and uncertainties. There can be no assurance that any forward-looking statements will be achieved. World Gold Council and its affiliates assume no responsibility for updating any forward-looking statements.
Information regarding the LBMA Gold Price
The LBMA Gold Price is used by the World Gold Council with permission under license by ICE Benchmark Administration Limited and is subject to the restrictions set forth here (www.gold.org/terms-and-conditions).
Information regarding QaurumSM and the Gold Valuation Framework
Note that the resulting performance of various investment outcomes that can be generated through use of Qaurum, the Gold Valuation Framework and other information are hypothetical in nature, may not reflect actual investment results and are not guarantees of future results. Neither World Gold Council (including its affiliates) nor Oxford Economics provides any warranty or guarantee regarding the functionality of the tool, including without limitation any projections, estimates or calculations.
Information from ICRA Analytics Limited
All information obtained from ICRA Analytics Limited contained in this document is subject to the disclaimer set forth here (www.icraanalytics.com/terms-of-use/disclaimer).
