India gold market update: Import tightening
22 May, 2026
Highlights
- Gold import duty was raised sharply by 9%– from 6% to 15%, the steepest increase on record – alongside broader regulatory tightening
- Domestic gold prices have not yet fully reflected the duty hike amid weak demand and ample supply; local markets are currently in deep discount from the landed price1
- Past trends indicate that higher duty increases unofficial inflows, although official imports remain relatively resilient
- Gold demand is expected to moderate in 2026, with jewellery and bar and coin demand projected to decline by 50–60t (~10% y/y) on account of the import duty hike.
Policy actions on gold imports
Since early April the government has adopted a series of measures aimed at moderating gold imports. These have been part of a broader push to conserve foreign exchange reserves amid geopolitical uncertainty and mounting pressure on the INR, which has depreciated by more than 7% y-t-d. These measures include price-based actions, administrative and regulatory tightening, and consumer-directed messaging. While noteworthy, they are not unprecedented; gold is among the top five imports for India, accounting for 8% of the country’s merchandise imports in 2025, and similar measures have been utilised in the past.
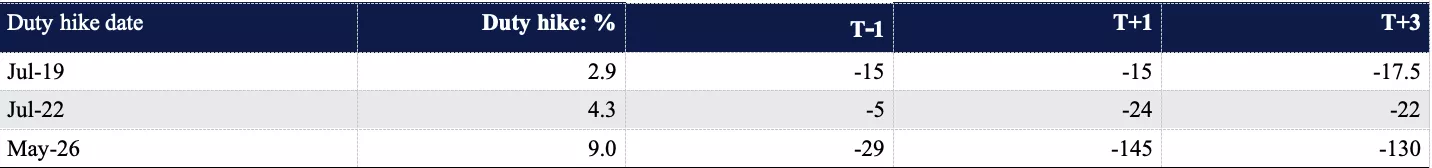
On the price front, the gold import duty was raised sharply from 6% to 15%, making it the single largest increase on record and fully reversing the duty cut of July 2024 (Chart 1). Rules were also tightened for gold imports linked to exports (under the advance authorisation scheme)2 and the Prime Minister has directly appealed to consumers, urging them to avoid buying gold for a year.3
Chart 1: Import duty reverses course
Customs duty on gold (%)*
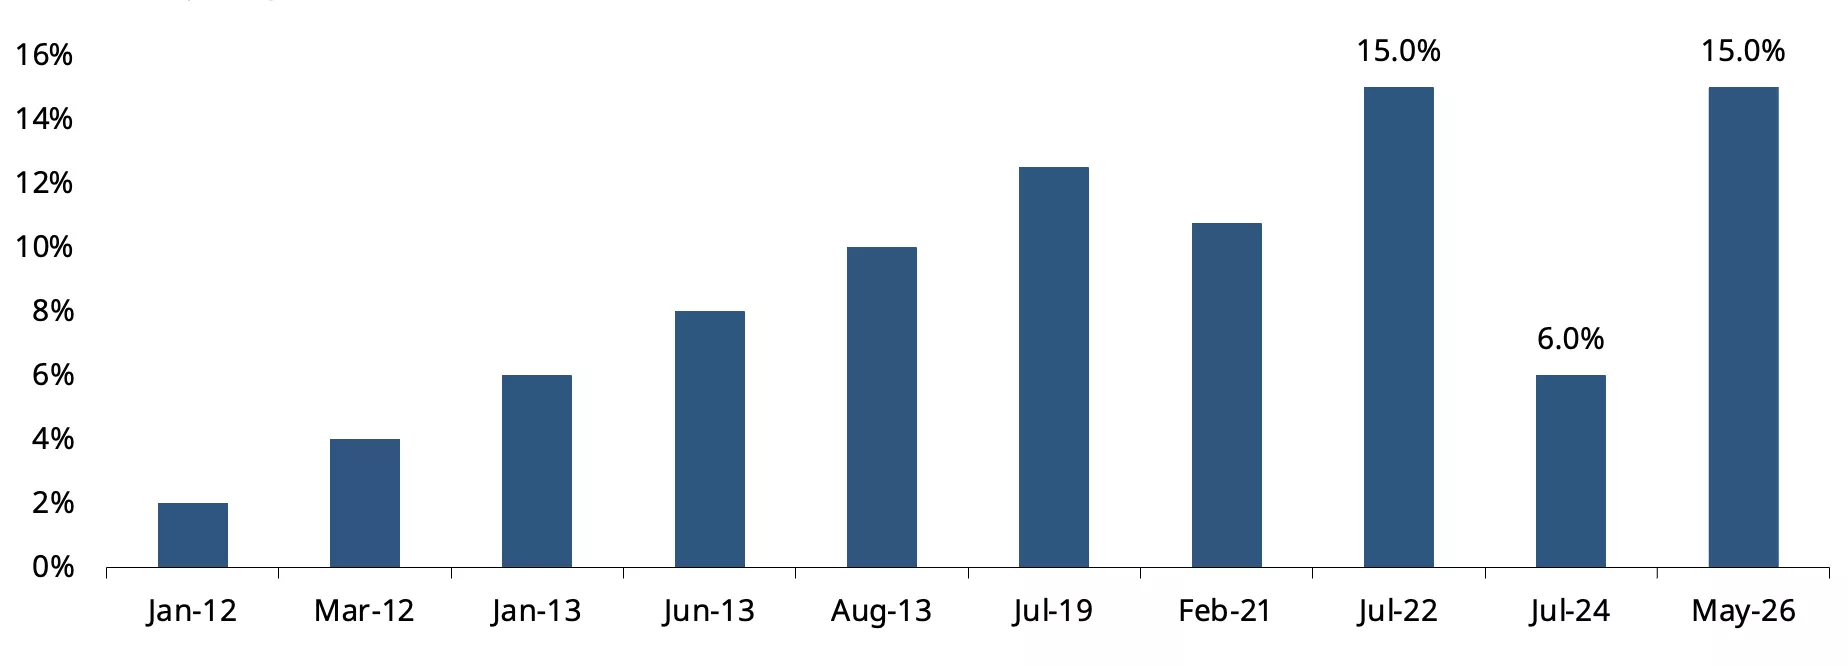
*As of 13 May 2026
Source: CBIC, World Gold Council.
These measures followed a series of policy actions that were seen as efforts to slow the import of gold, including the delay in issuing annual licenses for bullion imports to banks,4 restrictions on the import of all forms of gold, silver and platinum jewellery and platinum alloys;5 and continued delay in issuance of notification exempting banks from the Integrated Goods and Service Tax (IGST),6 which led to the banks pausing bullion imports for over a month.7
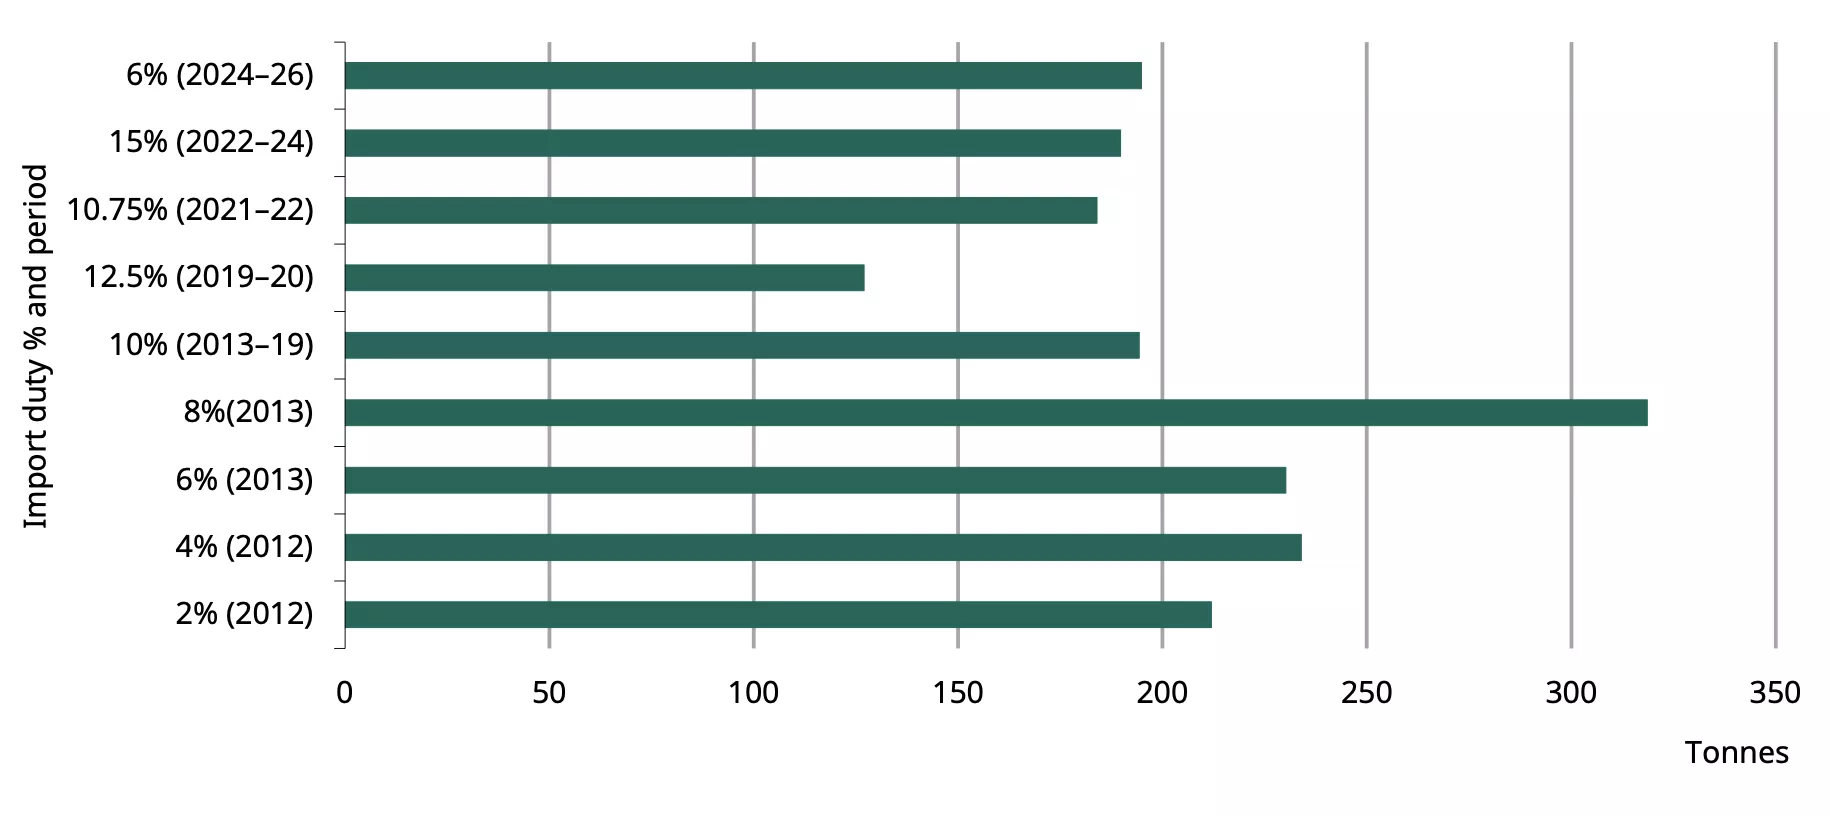
The pattern of gold import duty revisions
To date, India’s gold import duty revisions have been infrequent, with long periods of stability between policy revisions. Gold imports were subject to a flat duty (a fixed rupee amount per 10g) prior to 2012, but this was subsequently replaced by a value-based duty structure. Between 2012 and 2013 duties were raised repeatedly through a series of 2% hikes, up to 10%. This was followed by a prolonged gap of nearly six years before a further 2.5% hike in July 2019. Since then, revisions have become larger and more frequent, including duty cuts in 2021 and 2024 and sharp hikes in 2022 and 2026, reflecting a more active use of import duties to manage trade dynamics.
Table 1: India’s gold import duty cycle
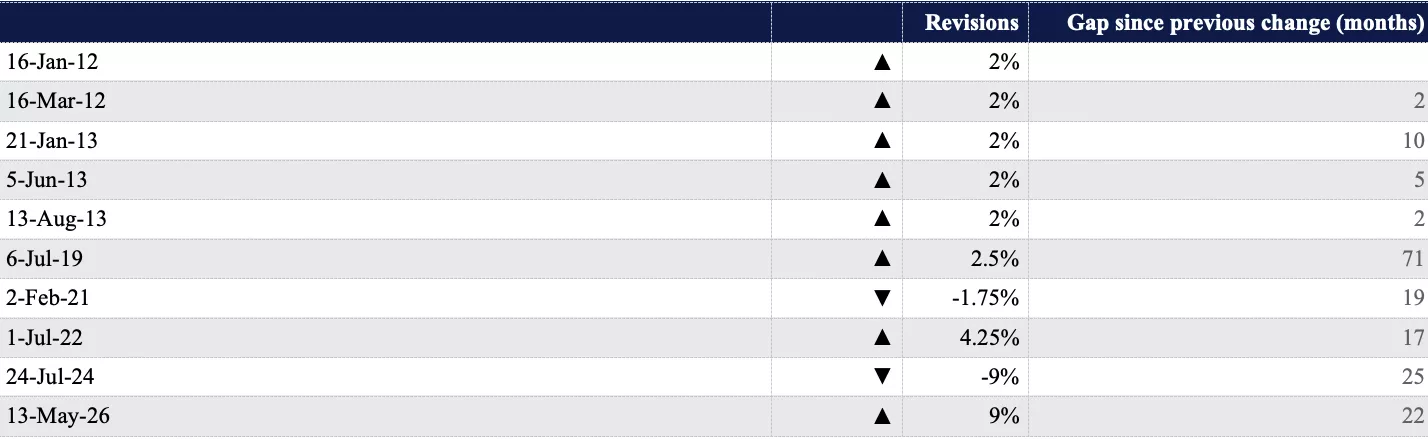
Source: CBIC, World Gold Council
Price adjustment – the tariff lag effect
As expected, the import duty hike led to an immediate increase in domestic gold prices. However, the rise in prices was lower than the 9% increase in duty. Physical market prices, proxied by the MCX spot gold price, have risen in the range of 4% to 6% since the change in duty.
While the duty hike mechanically raises the official domestic or landed price,8 physical market prices do not fully or immediately mirror the increase in duty – rather they adjust to it with a lag, particularly when the change is as steep as the current 9%. Moreover, the increase came at a time of seasonally weak demand – summer wedding purchases are largely over, and the period from mid-May to mid-June is considered inauspicious for buying gold – thus limiting the full pass-through of the duty hike. Market feedback indicates that there is ample supply from the exchange of old gold jewellery for new, and the likely front-loading of imports, further limiting the rise in price.
Chart 2: Prices have risen less than the duty hike
Landed price and MCX spot gold price in USD per ounce*
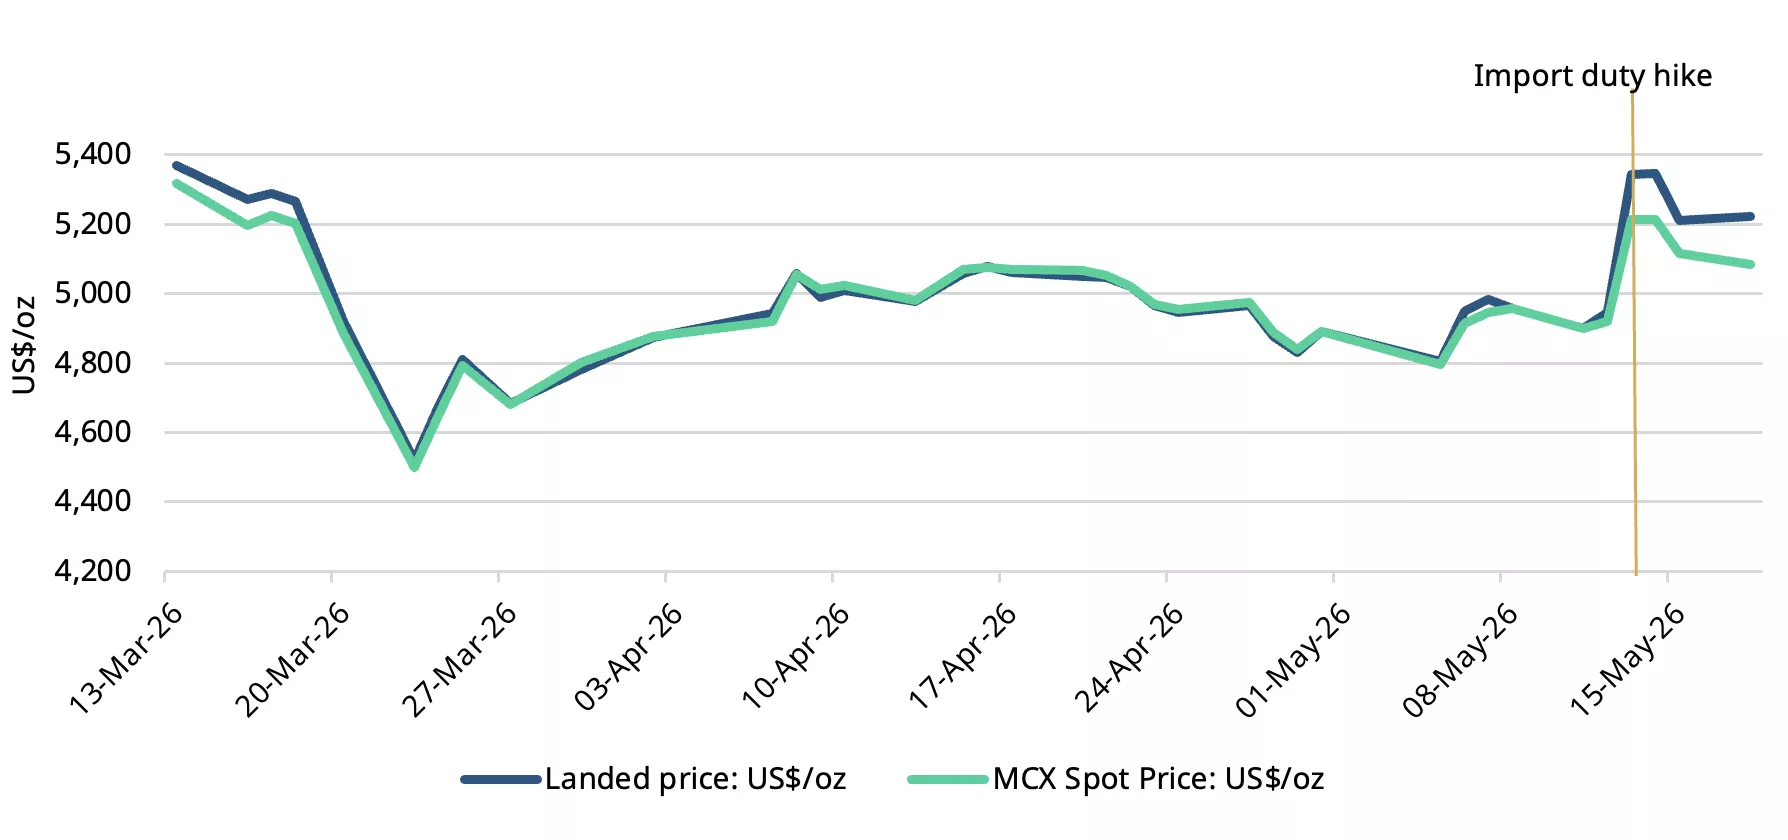
*As of 18 May 2026. Landed price is the international prices (LBMA Gold Price AM) adjusted for import taxes.
Source: Bloomberg, CBIC World Gold Council.
Domestic gold prices trade at a deep discount post duty revision
In the immediate aftermath of the import duty hike, domestic gold prices traded at a steep discount to official prices,9 widening from an average of US$14/oz the week prior to the duty hike to nearly US$150/oz (Chart 3). The rise in domestic prices post the duty hike triggered profit-taking by investors, boosting supply even as physical buying weakened, and bullion dealers likely offloaded inventory imported at lower duty rates, adding to market supply.
Chart 3: Discounts widened sharply
NCDEX gold premium/discount relative to the official domestic price*
*As of 15 May 2026.
Source: NCDEX, World Gold Council.
Previous import duty hikes in 2019 and 2022 also resulted in discounts in the domestic market, but this episode has been significantly more pronounced due to the scale of the increase (Table 2).
Table 2: Post-duty hike movement in domestic gold price discounts (US$/oz)
Source: NCDEX, World Gold Council
Market and trade reaction and expectations
Share prices of listed jewellers fell by ~2%–17% following the duty hike, reflecting expectations of weaker discretionary demand. Market feedback and trade interactions suggest a varied impact across segments, with many retailers indicating a likely pause in procurement. Large chain stores saw a brief period of panic buying after the announcement, driven by expectations of further measures, and while they expect a slowdown in sales, they remain relatively resilient given inventory buffers and continued support from bridal demand.
Mid-sized and regional players continue to see buying from affluent customers but are expecting to rely more on exchange programmes and tighter inventory cycles going forward.
Smaller retailers appear the most vulnerable: already stretched by persistently high prices, they now face added pressure from sales volumes and profit margins.
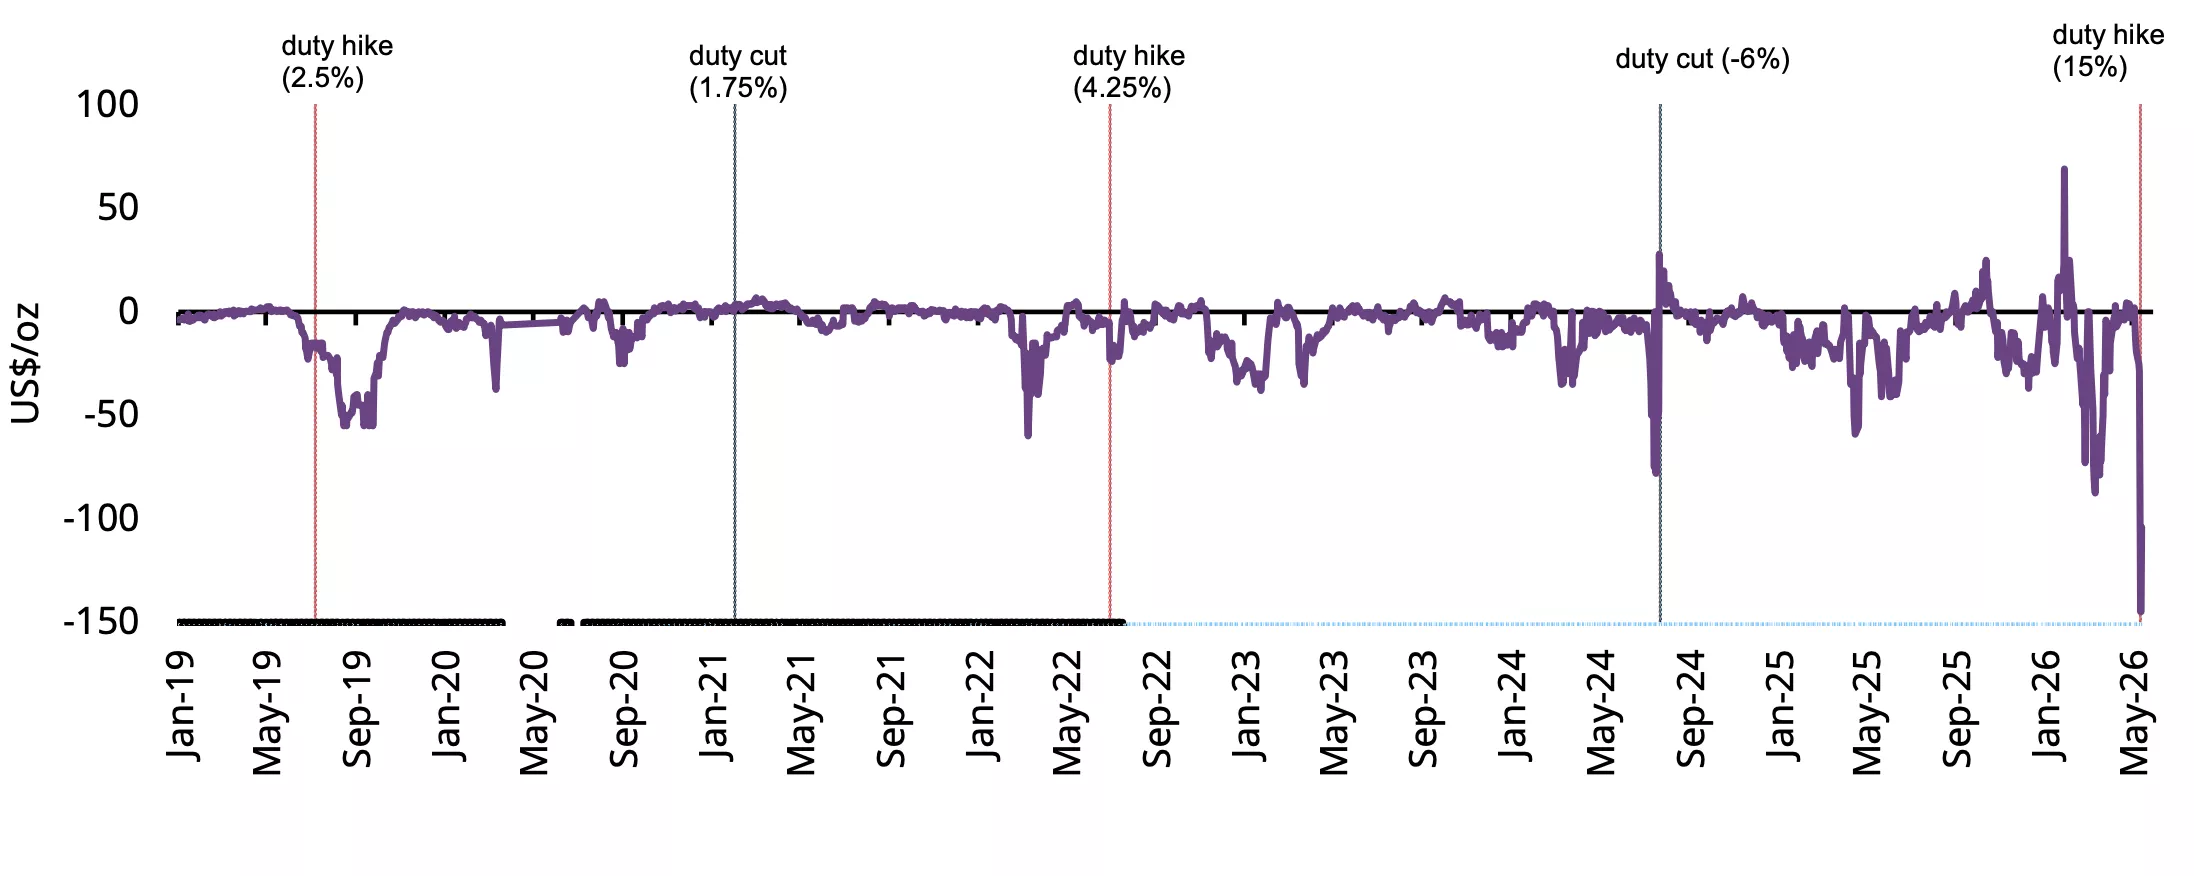
Import duties and smuggling
Import data points to a consistent relationship between higher import duties and the inflow of unofficial gold. Between 2013 and 2026 increases in import duty were mostly followed by higher levels of unofficial or smuggled gold, while duty reductions coincided with sharp declines in such inflows. Excluding the COVID years of 2020–21, the correlation between import duty and unofficial imports is positive at 0.52, indicating a meaningful link between higher duties and smuggling activity.
Following the 4% duty hike in 2013, unofficial imports increased sharply from around 10t in Q1 of that year to 70t by Q1 2014, a seven-fold increase in under a year. Even when duties were steady at 10% through the second half of 2013 until Q2 2019 unofficial inflows remained elevated, averaging 34t per quarter. This suggests that once smuggling networks are established they are difficult to unravel.
A similar pattern was observed after duty was hiked from 10.75% to 15% in July 2022. Unofficial imports rose from 17t in Q2 2022 to nearly 50t by late that year and stayed elevated through much of 2023. In contrast, after duty was cut to 6% in July 2024, unofficial imports fell almost immediately to near zero.
There was a temporary drop in unofficial imports during 2020–21, which can be attributed to COVID-related disruptions.
The evidence suggests that higher import duties widen the domestic–international price gap and increase the incentive for smuggling, while lower duties reduce its attractiveness.
Chart 4: Import duty driven shifts
Source: Metal Focus, World Gold Council.
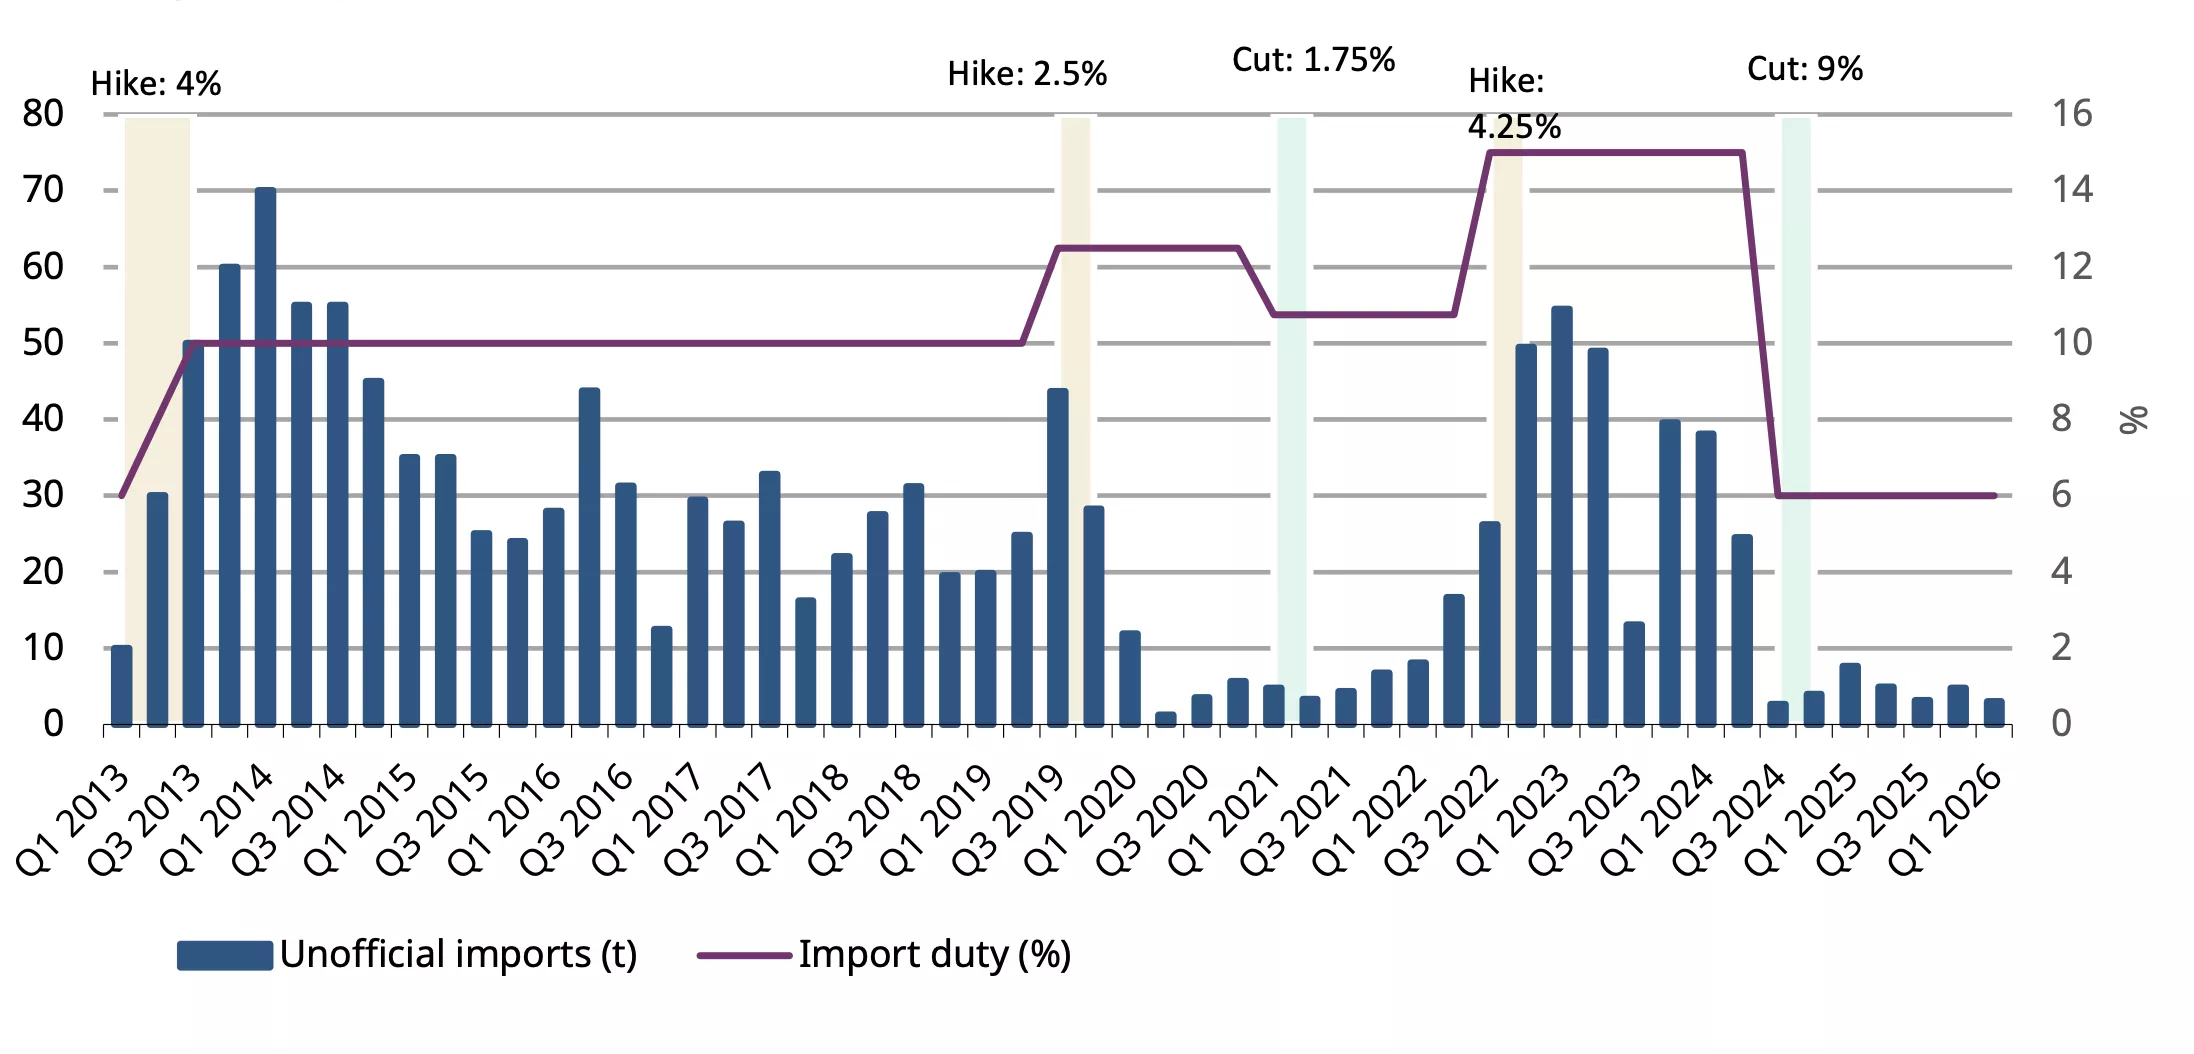
Limited duty sensitivity of imports
Our analysis suggests that import duty changes have had a limited influence on official import volumes over the past 13 years.10 Across duty regimes ranging from 6% to 15% official imports remained relatively resilient, between 175t and 236t per quarter in most periods, excluding the COVID period in 2020. The highest quarterly imports were recorded under the 10.75% duty regime (236.2t), while imports also remained stable at the higher 15% duty rate (174.5t). Statistically, the overall correlation between duty rates and official imports is negative 0.17, indicating a weak relationship between the two. This suggests that duty changes are not a key driver of imports; rather, broader demand conditions play a greater role.
Chart 5: Steady imports through duty cycles
Average quarterly official imports at various import duty levels*
*As of 18 May 2026.
Source: DGCIS, CBIC, World Gold Council
Recent data also highlights import resilience: April imports rose to US$5.6bn, up more than 80% on an annual as well as a sequential basis. This was despite banks pausing gold imports as they awaited the renewal notification that exempt them from the integrated goods and services tax (IGST). This suggests that the imports were likely driven by refiners, who increased their intake of gold doré around the key demand period of Akshaya Tritiya (19-20 April) further supported by gold price moderation. At the same time, some degree of front loading of imports – in anticipation of curbs amid the prolonged Iran-US conflict, elevated oil prices, and the INR vulnerability to a high import bill – cannot be ruled out based on anecdotal evidence. In volume terms, we estimate imports in April were in the range of 48-55t.
Chart 6: Imports rise despite disruptions
Monthly gold imports in tonnes and US$bn*
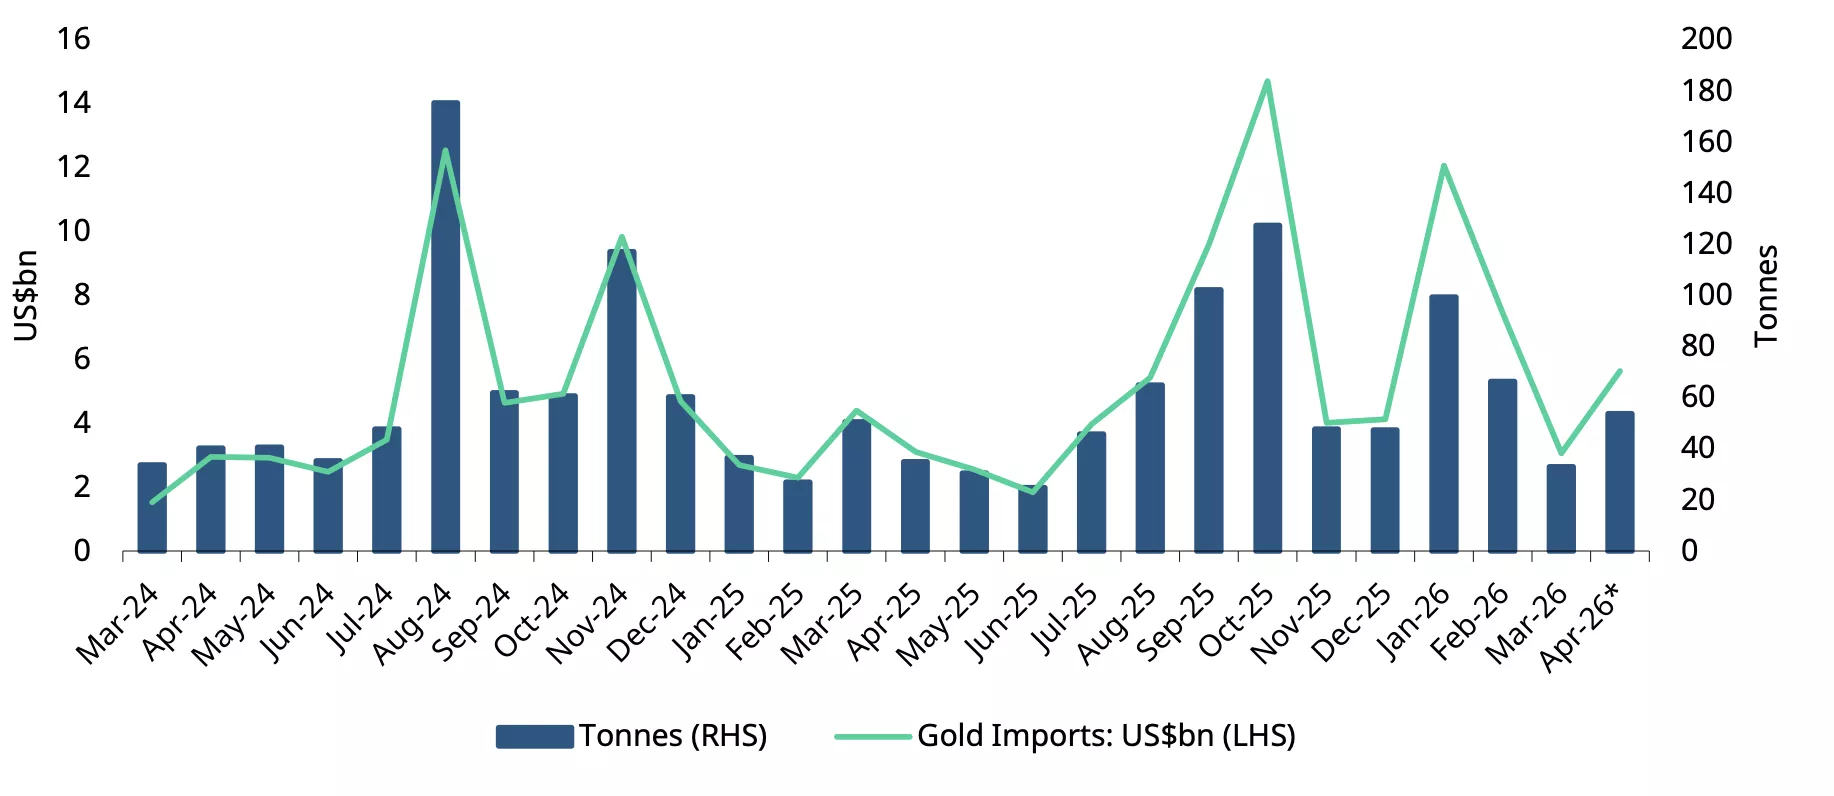
*Includes World Gold Council estimates.
Source: Ministry of Commerce and Industry, CMIE, World Gold Council
Gold ETFs: flows slow
Indian gold ETFs continued to attract inflows in April 2026, marking the 12th consecutive month of positive flows. Net inflows stood at INR30.4bn (US$325mn), broadly in line with our estimates.11 While inflows were modestly higher sequentially (up 3% m/m), they remained well below January’s peak, at about 13% of the INR240bn (US$2.6bn) recorded at that time, signalling a moderation in demand after a very strong start to the year. Redemptions stayed elevated in April at INR20.5bn (US$220mn), reflecting ongoing profit-taking, a trend seen since February.
Cumulative holdings rose by 1.1t to 116.7t, while AUM stood at INR1,781bn (US$19bn), a modest 3% decline from January, largely due to softer gold prices (down ~9% in INR terms). Investor participation remained healthy, with folios (or accounts) reaching 12.5mn, although growth slowed in April, with folio additions of 77,413 – the lowest since September 2024.
Gold ETFs experienced outflows following the import duty hike, with redemptions from 13-18 May largely reversing earlier gains. On a month-to-day basis, however, demand remains marginally positive at around INR1bn (~US$12mn).
Chart 7: Gold ETF momentum softens
Gold ETF flows in INRbn, and total holdings in tonnes*
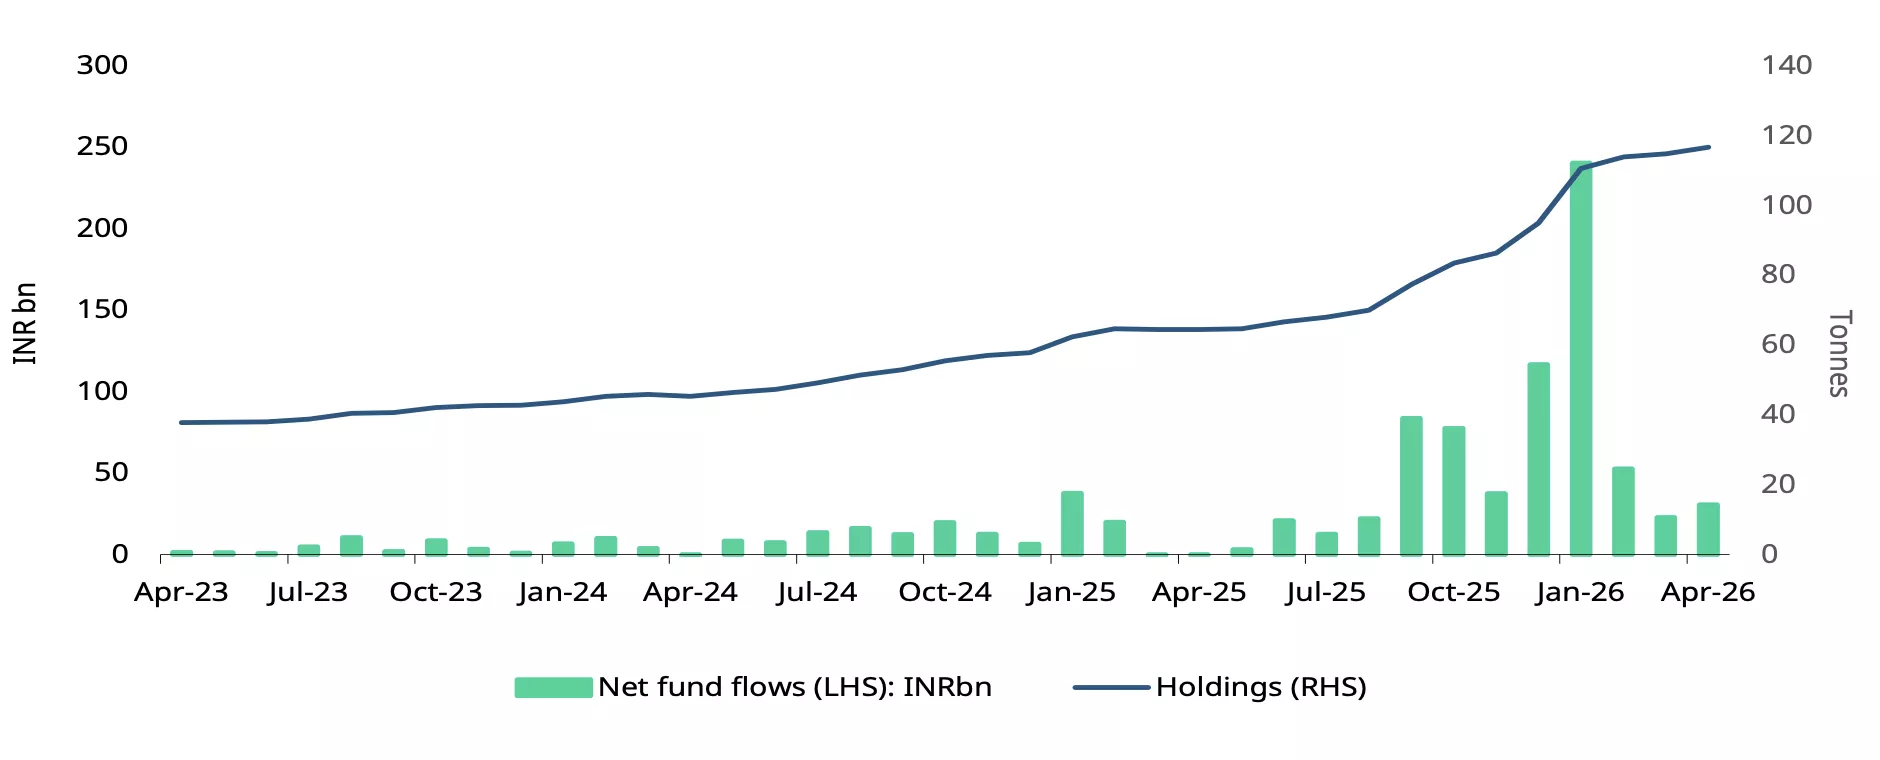
*As of end April 2026.
Source: AMFI, ICRA Analytics, CMIE, World Gold Council
Demand moderation
Gold demand trends across different duty regimes indicates that while import duties influence consumption, other key factors such as gold prices, income growth and inflation, simultaneously impact demand. Periods of high import duties have generally coincided with a moderation in demand, particularly for bars and coins.
Average quarterly demand remained relatively subdued during the extended 10% duty period of 2013-19 (Chart 8) as well as during the period of 12.5% duty (2019-20), although the latter was also affected by COVID.
Chart 8: Tariffs temper demand
Average jewellery and bar and coin demand at various import duty levels*
Source: Source: Metal Focus, CBIC, World Gold Council
Our econometric models12 suggest that changes in import duties tend to impact gold demand in both the short and long term, although the impact differs across jewellery and investment products such as bars and coins. Investment demand appears more sensitive to duty changes, while jewellery demand has shown greater resilience.
Jewellery consumption is influenced more by prices and inflation and import duties have less of an impact. This is likely because jewellery purchases often tend to be a requirement, particularly for weddings and social occasions. Investment demand on the other hand is linked to income levels and import duties, with higher duties and restrictions tending to weigh on demand. In the short term, factors such as inflation and rainfall also influence investment demand alongside taxes.
Looking at 2026 as a whole, we estimate that combined jewellery and bar and coin demand could decline by around 50-60t, around 10% lower than the previous year due to the impact of the import duty hike. Other factors, such as the gold price, changes to income levels, inflation, or effects from the monsoon would further influence annual demand.
Footnotes
1Landed price is the international price (LBMA Gold Price AA) adjusted for import taxes. Prices as of 18 May 2026.
2Centre further tightens gold import rules, caps advance authorization at 100 kg, The Tribune, 20 May 2026.
3Why PM Modi asked Indian families not to buy gold for a year, India Today, 11 May 2026.
4After delay, DGFT authorises 17 banks to import bullion for 3 years, Indian Express,17 April 2026
5India imposes immediate restrictions on gold, silver and platinum jewellery imports to curb FTA misuse, NDTV Profit, 1 April 2026.
6IGST is a tax on the supply of goods and services between states in India.
7India's gold import crisis: Why banks halted shipments for a month and what it took to start again, Money Control, 12 May 2026.
8Landed price is the international price (LBMA Gold Price AM) adjusted for import taxes.
9Official domestic price is the landed prices which is the international price adjusted for import taxes.
10Q3 2013 to Q1 2026.
11Based on partial information
12Reference page 128-132.
Disclaimer
Important information and disclaimers
© 2026 World Gold Council. All rights reserved. World Gold Council and the Circle device are trademarks of the World Gold Council or its affiliates.
All references to LBMA Gold Price are used with the permission of ICE Benchmark Administration Limited and have been provided for informational purposes only. ICE Benchmark Administration Limited accepts no liability or responsibility for the accuracy of the prices or the underlying product to which the prices may be referenced. Other content is the intellectual property of the respective third party and all rights are reserved to them.
Reproduction or redistribution of any of this information is expressly prohibited without the prior written consent of World Gold Council or the appropriate copyright owners, except as specifically provided below. Information and statistics are copyright © and/or other intellectual property of the World Gold Council or its affiliates or third-party providers identified herein. All rights of the respective owners are reserved.
The use of the statistics in this information is permitted for the purposes of review and commentary (including media commentary) in line with fair industry practice, subject to the following two pre-conditions: (i) only limited extracts of data or analysis be used; and (ii) any and all use of these statistics is accompanied by a citation to World Gold Council and, where appropriate, to Metals Focus or other identified copyright owners as their source. World Gold Council is affiliated with Metals Focus.
The World Gold Council and its affiliates do not guarantee the accuracy or completeness of any information nor accept responsibility for any losses or damages arising directly or indirectly from the use of this information.
This information is for educational purposes only and by receiving this information, you agree with its intended purpose. Nothing contained herein is intended to constitute a recommendation, investment advice, or offer for the purchase or sale of gold, any gold-related products or services or any other products, services, securities or financial instruments (collectively, “Services”). This information does not take into account any investment objectives, financial situation or particular needs of any particular person.
Diversification does not guarantee any investment returns and does not eliminate the risk of loss. Past performance is not necessarily indicative of future results. The resulting performance of any investment outcomes that can be generated through allocation to gold are hypothetical in nature, may not reflect actual investment results and are not guarantees of future results. The World Gold Council and its affiliates do not guarantee or warranty any calculations and models used in any hypothetical portfolios or any outcomes resulting from any such use. Investors should discuss their individual circumstances with their appropriate investment professionals before making any decision regarding any Services or investments.
This information may contain forward-looking statements, such as statements which use the words “believes”, “expects”, “may”, or “suggests”, or similar terminology, which are based on current expectations and are subject to change. Forward-looking statements involve a number of risks and uncertainties. There can be no assurance that any forward-looking statements will be achieved. World Gold Council and its affiliates assume no responsibility for updating any forward-looking statements.
Information regarding the LBMA Gold Price
The LBMA Gold Price is used by the World Gold Council with permission under license by ICE Benchmark Administration Limited and is subject to the restrictions set forth here (www.gold.org/terms-and-conditions).
Information regarding QaurumSM and the Gold Valuation Framework
Note that the resulting performance of various investment outcomes that can be generated through use of Qaurum, the Gold Valuation Framework and other information are hypothetical in nature, may not reflect actual investment results and are not guarantees of future results. Neither World Gold Council (including its affiliates) nor Oxford Economics provides any warranty or guarantee regarding the functionality of the tool, including without limitation any projections, estimates or calculations.
Information from ICRA Analytics Limited
All information obtained from ICRA Analytics Limited contained in this document is subject to the disclaimer set forth here (www.icraanalytics.com/terms-of-use/disclaimer).
