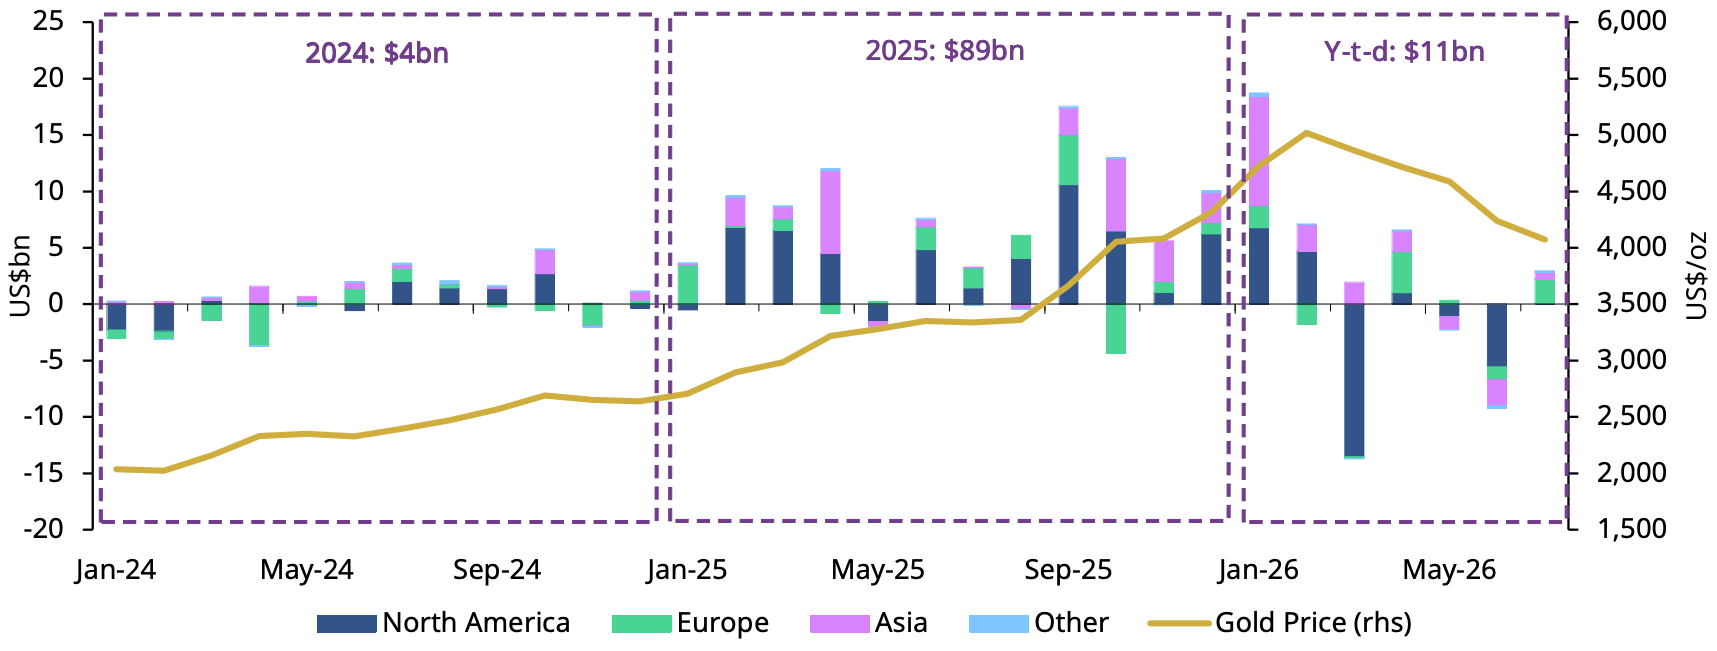
Volumes trending lower
Global gold market liquidity2 averaged US$356bn per day in July, down 3.5% m/m. Over-the-counter (OTC) trading activity fell 3.4% m/m to US$205bn per day. However, despite the decline, both LBMA volumes and Shanghai trading activity remained above their 2025 averages. Trading volumes on exchanges also trended lower, falling 2.6% m/m to US$146bn per day, possibly reflecting normalising gold price volatility. Volumes in gold ETFs likewise pulled back, averaging US$5bn per day in July, a 29.1% m/m decrease.
Positioning data showed a modest reduction in total COMEX net longs, which declined 4.4% over the month to 542t.3 Managed money showed early signs of rebuilding its position, adding 11 tonnes, but this was more than offset by selling among other reportables,4 whose net longs fell by 36 tonnes during the month. Overall, positioning remains near neutral as gold continues to be weighed down by the effects of the war in the Middle East, which has reinforced inflation risks and supported the dollar and yields, adding to the opportunity-cost headwind facing gold.
Chart 2: Trading volumes have trended lower over the past two months
Average daily trading volumes by segment*
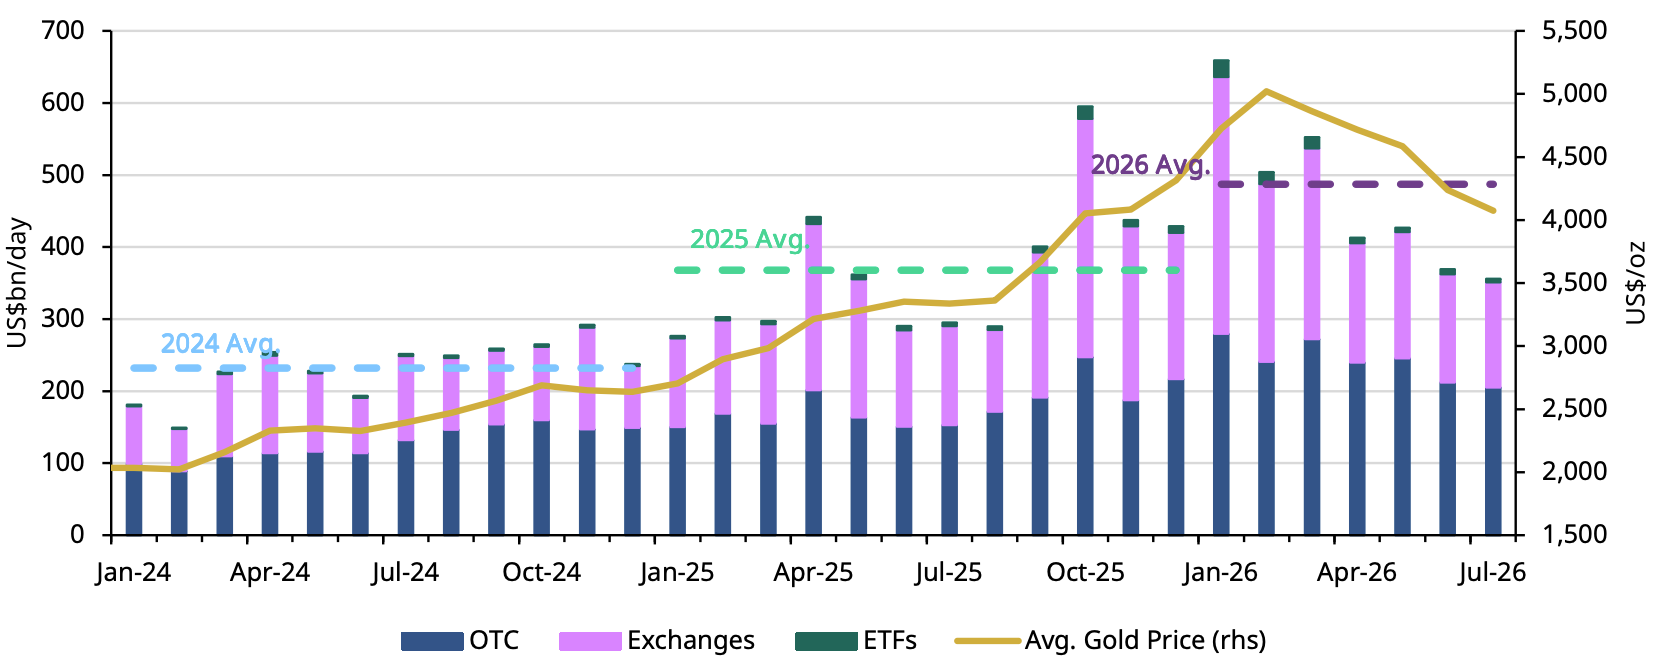
*Data as of 31 July 2026. Gold price based on the monthly average LBMA Gold Price PM USD.
For more information on trading volumes please visit our Trading Volumes page on Goldhub: Gold Trading Volume | Gold Daily Volume | World Gold Council.
Source: Bloomberg, Nasdaq, COMEX, ICE Benchmark Administration, Shanghai Gold Exchange, Shanghai Futures Exchange, ETF providers, Multi Commodity Exchange of India, Dubai Gold & Commodities Exchange, Japan Exchange Group, Thailand Futures Exchange, Borsa Istanbul, Bursa Malaysia, Korea Exchange, World Gold Council
