Record gold prices outpace rising mining costs in Q1’26
24 August, 2026
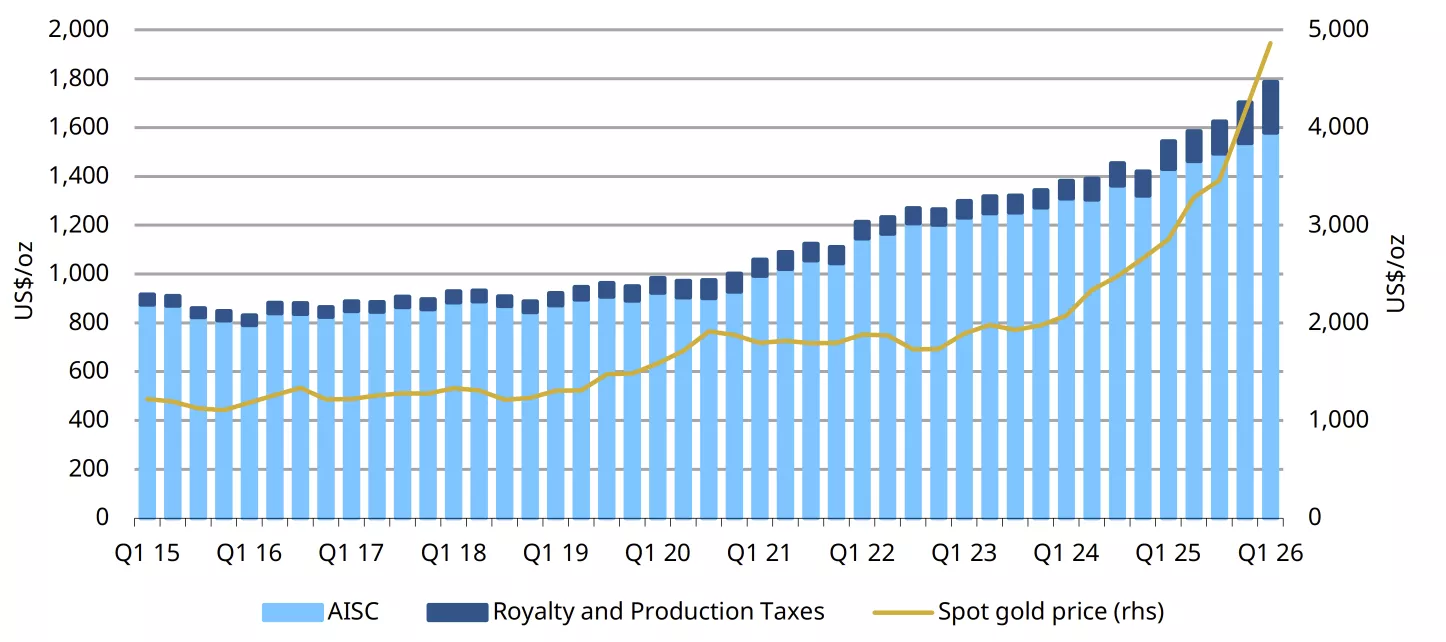
2026 started in dramatic fashion, as record gold prices and cash flows for miners were accompanied by the outbreak of war in Iran and the broader disruption across the Middle East. Against this backdrop, global average gold producer All-In Sustaining Costs (AISC) rose by 5% q/q and 16% y/y to US$1,785/oz in Q1’26. Rising costs have become a persistent feature of the industry, with the quarter marking the 28th consecutive year-on-year increase in AISC.
Numerous cost drivers contributed to the increase, but royalties were the most significant. Spot gold prices reached unprecedented new highs, momentarily hitting US$5,595/oz in January, while Q1’26 recorded by far the highest quarterly average nominal price on record. As revenues increased, royalty payments rose sharply, climbing by 24% q/q and 85% y/y. When compared with five years previous, the growing importance of royalties is clear. In Q1’21, royalties accounted for approximately 6% of AISC. By Q1’26, this share had doubled to 12% of the average operation’s cost base.
However, the effect was not uniform across the industry. Differences in fiscal regimes, combined with rising resource nationalism, accentuated the impact in some jurisdictions. Ghana introduced a new sliding scale royalty system in March, replacing the long-standing flat rate of 5%. The scale is linked to the gold price and can reach rates of 12% when prices exceed US$4,500/oz.1 In 2025, Burkina Faso introduced a new sliding royalty rate system, with rates of 10% for gold prices between US$4,000-4,500/oz. Mali implemented its new sliding scale in 2024, with higher royalty rates of 9.5% at a gold price of US$4,100/oz. 2 These higher royalty rates result in higher royalty costs for mines. For example, at IAMGOLD’s Essakane mine in Burkina Faso, royalty costs surged by 220% y/y, accounting for 35% of cash costs.3 Resolute Mining also identified higher royalties as a key factor pushing costs at Syama above guidance.4
Chart 1: AISC, of which royalty and production taxes, and quarterly average gold price US$/oz
Source: Bloomberg, Metals Focus Gold Mine Cost Service
The Cost of Conflict
While royalties were a major driver of higher AISC, attention has also been on the Iran conflict and the resulting disruption. The closure of the Strait of Hormuz and damage to resources and energy infrastructure in the region have disrupted global supply chains, contributing to higher fuel, power, freight, shipping, and consumable costs.
Fuel and power were among the largest concerns for gold miners as global energy prices spiked and diesel shortages became a risk in some jurisdictions. However, the scale of the impact varied considerably according to local supply chains. The average diesel price in the US ended the quarter 54% higher q/q, while wholesale diesel prices in Perth, Australia increased by 96% over the quarter.5 Western Australian miners came under particularly significant pressure, with some smaller operations reportedly suspending activity because of fuel constraints. The disruption also highlighted the differing levels of protection across the industry, as larger companies generally fared better than their junior counterparts.
Major and intermediate producers were mostly insulated from the March price volatility through fuel inventories, hedging, power purchase agreements and long-term procurement arrangements. For example, Evolution Mining noted in its Q1’26 release that its existing fuel contracts had prevented any disruption to operations.6 Newmont were also unaffected by fuel shortages, as they were able to leverage their scale and ensure that strong relations with suppliers mitigated exposure.7 OceanaGold, whose diesel costs make up around 6% of AISC, similarly reported that around 80% of annual consumption was hedged;8 and as a result, changes in oil prices had only a limited immediate effect on the company’s costs. Nevertheless, OceanaGold, Newmont and several other producers cautioned that a prolonged period of elevated fuel prices could have a greater impact in future quarters.9
Broader Supply-Chain Pressures
Higher fuel prices also had knock-on effects across global freight markets. Bunker fuel costs doubled in early March, while war risk insurance premiums increased.10 These costs were fed through to miners via the import of consumables, and spare parts. In their Q1’26 report, Gold Fields recorded a 40% rise in freight and consumables costs since the start of the Iran war.11
Disruption to natural gas and ammonia markets drove up prices for explosives and sodium cyanide and rising aluminium prices increased the cost of maintenance materials, fabricated components and replacement parts, adding to broader inflationary pressures across mining operations.
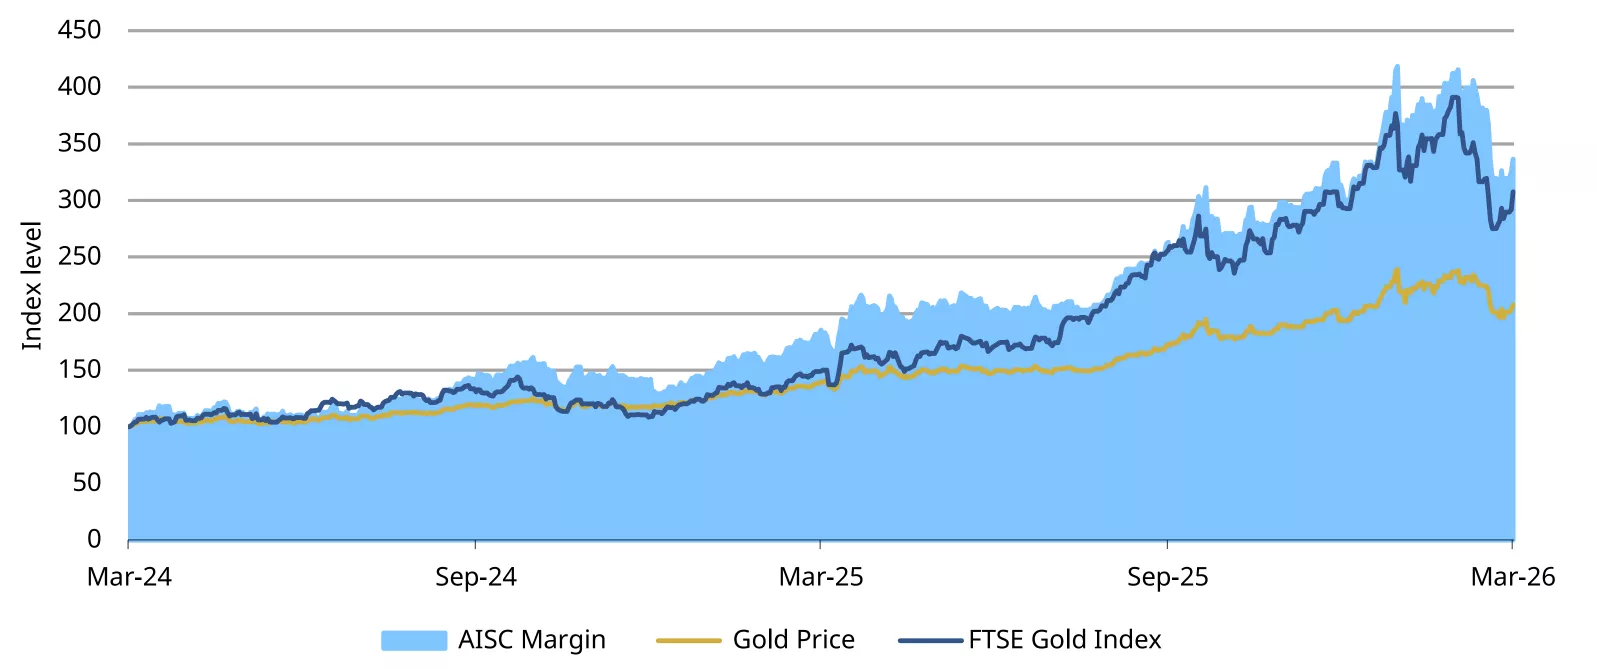
Chart 2: Gold miner margins surge ahead of the gold price
Note: Index: 31 March 2024 = 100.
Source: Bloomberg, Metals Focus
Record Margins and Cash Generation
Despite this cost inflation, the quarter remained exceptionally profitable for the gold mining industry. The surge in the average gold price far exceeded the increase in costs, with the yellow metal up by 17% q/q and 70% y/y. Consequently, average AISC margins rose by 25% q/q and 134% y/y to a record US$3,076/oz. Producers at the 90th percentile of the cost curve experienced particularly strong growth, with their AISC margins increasing by 32% q/q to US$2,363/oz.
In contrast to previous booms, gold miners have maintained relatively strict capital and cost discipline and so a host of producers now find themselves in net cash positions. A significant proportion of the cash generated is being returned to investors through dividends and share-buyback programmes. For example, Newmont returned US$2.7bn to shareholders after generating its highest ever quarterly free cash flow (FCF) of US$3.1bn and has approved an additional US$6.0bn share buyback programme.12 AngloGold Ashanti also generated record FCF of US$1.2bn and moved from a net debt position into net cash. The company raised its interim dividend to US$1.14/share, up from US$0.125/share in Q1’25.13
Outlook
Overall, Q1’26 was an exceptional quarter for gold miners. Record gold prices generated unprecedented margins and cash flows, despite the conflict in the Middle East contributing to mounting cost pressures. Looking ahead, the industry’s resilience may be tested following the pullback in gold prices from their January peak. In Q2’26, average prices were 7.2% lower q/q, but remained well supported above US$4,000/oz. At the same time, costs are expected to rise further, as the Iran conflict and associated supply chain disruptions persist. Given that much of the escalation occurred late in Q1’26, the full impact on fuel, freight and consumable costs is likely to become more apparent during Q2’26, placing additional pressure on margins.
Disclaimer
Important information and disclaimers
© 2026 World Gold Council. All rights reserved. World Gold Council and the Circle device are trademarks of the World Gold Council or its affiliates.
All references to LBMA Gold Price are used with the permission of ICE Benchmark Administration Limited and have been provided for informational purposes only. ICE Benchmark Administration Limited accepts no liability or responsibility for the accuracy of the prices or the underlying product to which the prices may be referenced. Other content is the intellectual property of the respective third party and all rights are reserved to them.
Reproduction or redistribution of any of this information is expressly prohibited without the prior written consent of World Gold Council or the appropriate copyright owners, except as specifically provided below. Information and statistics are copyright © and/or other intellectual property of the World Gold Council or its affiliates or third-party providers identified herein. All rights of the respective owners are reserved.
The use of the statistics in this information is permitted for the purposes of review and commentary (including media commentary) in line with fair industry practice, subject to the following two pre-conditions: (i) only limited extracts of data or analysis be used; and (ii) any and all use of these statistics is accompanied by a citation to World Gold Council and, where appropriate, to Metals Focus or other identified copyright owners as their source. World Gold Council is affiliated with Metals Focus.
The World Gold Council and its affiliates do not guarantee the accuracy or completeness of any information nor accept responsibility for any losses or damages arising directly or indirectly from the use of this information.
This information is for educational purposes only and by receiving this information, you agree with its intended purpose. Nothing contained herein is intended to constitute a recommendation, investment advice, or offer for the purchase or sale of gold, any gold-related products or services or any other products, services, securities or financial instruments (collectively, “Services”). This information does not take into account any investment objectives, financial situation or particular needs of any particular person.
Diversification does not guarantee any investment returns and does not eliminate the risk of loss. Past performance is not necessarily indicative of future results. The resulting performance of any investment outcomes that can be generated through allocation to gold are hypothetical in nature, may not reflect actual investment results and are not guarantees of future results. The World Gold Council and its affiliates do not guarantee or warranty any calculations and models used in any hypothetical portfolios or any outcomes resulting from any such use. Investors should discuss their individual circumstances with their appropriate investment professionals before making any decision regarding any Services or investments.
This information may contain forward-looking statements, such as statements which use the words “believes”, “expects”, “may”, or “suggests”, or similar terminology, which are based on current expectations and are subject to change. Forward-looking statements involve a number of risks and uncertainties. There can be no assurance that any forward-looking statements will be achieved. World Gold Council and its affiliates assume no responsibility for updating any forward-looking statements.
Information regarding the LBMA Gold Price
The LBMA Gold Price is used by the World Gold Council with permission under license by ICE Benchmark Administration Limited and is subject to the restrictions set forth here (www.gold.org/terms-and-conditions).
Information regarding QaurumSM and the Gold Valuation Framework
Note that the resulting performance of various investment outcomes that can be generated through use of Qaurum, the Gold Valuation Framework and other information are hypothetical in nature, may not reflect actual investment results and are not guarantees of future results. Neither World Gold Council (including its affiliates) nor Oxford Economics provides any warranty or guarantee regarding the functionality of the tool, including without limitation any projections, estimates or calculations.
Information from ICRA Analytics Limited
All information obtained from ICRA Analytics Limited contained in this document is subject to the disclaimer set forth here (www.icraanalytics.com/terms-of-use/disclaimer).
Footnotes
1Décret no2025-0331 /PRES/PM/MEMC/MEF portant fixation des taxes et redevance miniéres
2Décret no2024-0396/PT-RM du 09 juillet 2024
3IAMGOLD Q1 2026 Financial Report
4Resolute Mining Q1 2026 Activities Report
5Bloomberg.
6Evolution Mining Quarterly Report | March 2026
7NEM Q1 2026 Earnings Call Transcript, NEM Q1 2026 10-Q, NEM Q1 2026 Earnings Presentation
9OceanaGold MDA 2026 Q1, NEM Q1 2026 10-Q, Agnico Eagle Q1 2026 Results, GoldFields Operational Update Q1 2026
10Indonesian Institute for Foreign Affairs
11GoldFields Operational Update Q1 2026
