Ever upwards for AISC, but distinct regional variations are emerging
Sarah Tomlinson
Director of Mine Supply Metals FocusWhen considering the factors driving up gold miners’ all-in sustaining costs (AISC), Q3’24 was a busy period.
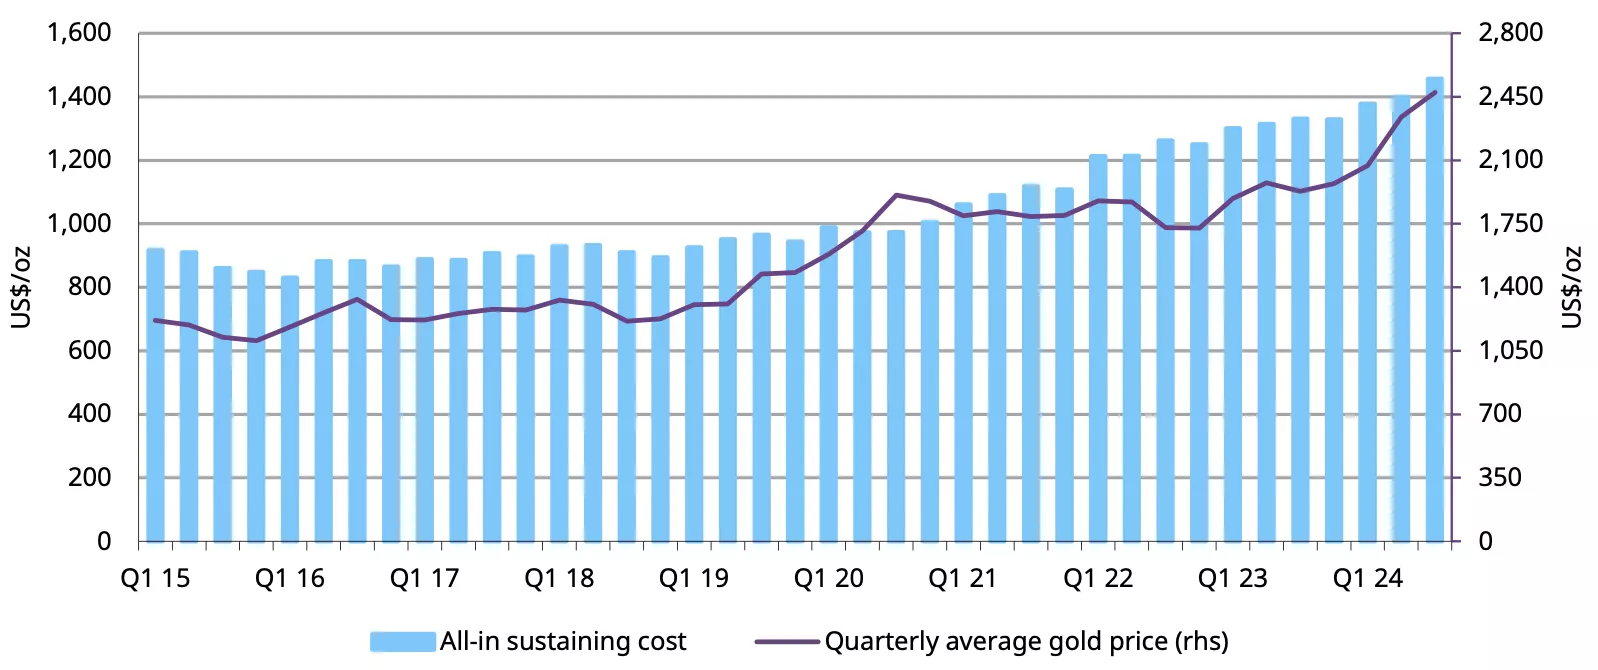
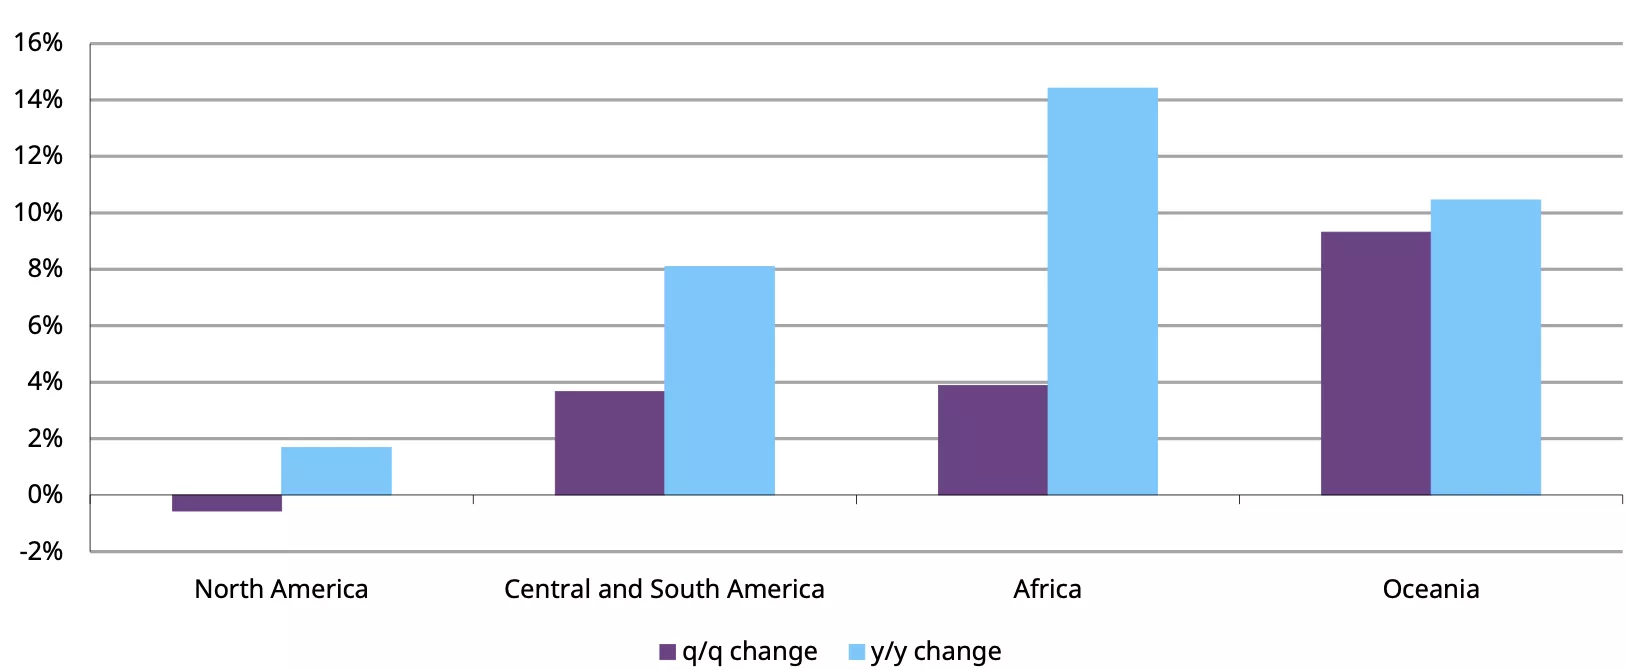
The gold price climbed steadily upwards, trading above US$2,600/oz by quarter end. AISC also continued to rise, up 4% q/q and 9% y/y, to US$1,456/oz, the highest point in our data series back to Q1’10. Lower production, compounded by higher royalty payments and increased sustaining capital expenditures, all helped to drive up AISC. On a regional basis, some differences began to emerge. Africa, Oceania and South America realised the most notable increases, but in North America the rate of growth was much lower, highlighting a mixed scenario for the quarter.
Chart 1: AISC continues to rise as the gold price climbs higher
Quarterly gold price vs. AISC*
*Data as of September 2024.
Source: Bloomberg, ICE Benchmark Administration, Metals Focus Gold Mines Cost Service
In recent decades, as the gold price has strengthened, so too has gold producers’ AISC. Rising prices means marginal, lower grade ore becomes economic. They also lead to higher royalties and mining tax payments as revenues and profits increase. Improving producer margins provide the financial headroom for companies to invest in the recapitalisation of assets and progress mine developments, which can lead to higher sustaining capital expenditure. This occurred in Q3’24 as the global average royalties and mining tax unit cost rose to US$90/oz, up 5% q/q and a significant 31% y/y. The estimated global sustaining capital expenditure unit cost also increased, albeit more modestly, by 3% q/q to US$303/oz. However, on a year-on-year basis, the increase was a substantial 50%.
The regional average AISC for Africa in Q3’24 was US$1,532/oz, up 4% q/q and 14% y/y. The key driver was lower production as numerous operations faced challenges or processed lower grade ore during the quarter. In Mali, Allied Gold’s Sadiola operation was suspended early in Q3’24 while the company awaited permits for the Korali-Sud orebody. In Ghana, at AngloGold Ashanti’s Iduapriem, output dropped as recovered grades fell due to delays in drilling and flooding in the C1 pit. In contrast, Newmont reported higher mill throughput and grade at Ahafo in Ghana and production resumed at Sibanye-Stillwaters’ Beatrix operation in South Africa following back-break incidents in H1’24.
In Oceania, the regional average AISC rose 10% q/q and 15% y/y to US$1,464/oz, affected by higher sustaining capital expenditure and lower production at some operations. In Papua New Guinea, both Barrick’s Porgera and Newmont’s Lihir mines reported an increase in AISC. At Porgera, the ramp-up to commercial production is ongoing while at Lihir, the Phase 14A expansion and associated wall construction continues. In Australia, some operations recorded lower production. Northern Star reported lower supply from its flagship KCGM operation as the East Wall remediation was prioritised and planned maintenance was undertaken at the processing plant.
Chart 2: Distinct regional variations in AISC are evident
Percentage change in AISC*
*Data as of September 2024.
Source: Metals Focus Gold Mines Cost Service
The Q3’24 regional average AISC for South America increased by 6% q/q and 14% y/y to US$1,197/oz. Production was lower at some mines, affected by ongoing project work and the weather. For example, access to high grade areas was restricted at AngloGold Ashanti’s Serra Grande mine in Brazil due to the ongoing reclamation of the decline and at Pan American Silver’s Minera Florida mine in Chile as a result of heavy rainfall. In contrast, in Peru, injection leaching at Newmont’s Yanacocha improved gold production lowering costs by 8% q/q.
Over in North America, Q3’24 heralded mixed fortunes for operations. The regional average AISC remained virtually flat quarter-on-quarter at US$1,508/oz and rose by a minimal 2% y/y. Overall, production for the region increased, but it was varied. In Canada, Agnico Eagle reported record throughput at Meliadine following the commissioning of the Phase 2 mill expansion, but, in contrast, at Detour Lake, higher throughput, lower grades and increased royalty payments increased production costs. Meanwhile, in the US, at Cortez, part of the Nevada Gold Mines complex, the joint venture between Barrick and Newmont, lower underground grades, in addition to a higher refractory ore content increased processing costs and subsequently the AISC.
With the Q4’24 reporting period in full swing initial indications are that these variations have continued. A quick glance at the top three producers shows that on a quarterly basis Barrick and Newmont have reported lower AISC, but Agnico Eagle’s is higher. All three companies have reported a year-on-year rise in their full year AISC.
While the continual rise in AISC may be of concern, it is important to note that 97% of primary gold production in Q3’24 was profitable. Furthermore, rising costs at a time of near record gold prices is not unusual. The mixed reporting observed in Q3’24 is, perhaps, an indication that the tide is beginning to turn.
Disclaimer
Important information and disclaimers
© 2025 World Gold Council. All rights reserved. World Gold Council and the Circle device are trademarks of the World Gold Council or its affiliates.
All references to LBMA Gold Price are used with the permission of ICE Benchmark Administration Limited and have been provided for informational purposes only. ICE Benchmark Administration Limited accepts no liability or responsibility for the accuracy of the prices or the underlying product to which the prices may be referenced. Other content is the intellectual property of the respective third party and all rights are reserved to them.
Reproduction or redistribution of any of this information is expressly prohibited without the prior written consent of World Gold Council or the appropriate copyright owners, except as specifically provided below. Information and statistics are copyright © and/or other intellectual property of the World Gold Council or its affiliates or third-party providers identified herein. All rights of the respective owners are reserved.
The use of the statistics in this information is permitted for the purposes of review and commentary (including media commentary) in line with fair industry practice, subject to the following two pre-conditions: (i) only limited extracts of data or analysis be used; and (ii) any and all use of these statistics is accompanied by a citation to World Gold Council and, where appropriate, to Metals Focus or other identified copyright owners as their source. World Gold Council is affiliated with Metals Focus.
The World Gold Council and its affiliates do not guarantee the accuracy or completeness of any information nor accept responsibility for any losses or damages arising directly or indirectly from the use of this information.
This information is for educational purposes only and by receiving this information, you agree with its intended purpose. Nothing contained herein is intended to constitute a recommendation, investment advice, or offer for the purchase or sale of gold, any gold-related products or services or any other products, services, securities or financial instruments (collectively, “Services”). This information does not take into account any investment objectives, financial situation or particular needs of any particular person.
Diversification does not guarantee any investment returns and does not eliminate the risk of loss. Past performance is not necessarily indicative of future results. The resulting performance of any investment outcomes that can be generated through allocation to gold are hypothetical in nature, may not reflect actual investment results and are not guarantees of future results. The World Gold Council and its affiliates do not guarantee or warranty any calculations and models used in any hypothetical portfolios or any outcomes resulting from any such use. Investors should discuss their individual circumstances with their appropriate investment professionals before making any decision regarding any Services or investments.
This information may contain forward-looking statements, such as statements which use the words “believes”, “expects”, “may”, or “suggests”, or similar terminology, which are based on current expectations and are subject to change. Forward-looking statements involve a number of risks and uncertainties. There can be no assurance that any forward-looking statements will be achieved. World Gold Council and its affiliates assume no responsibility for updating any forward-looking statements.
Information regarding QaurumSM and the Gold Valuation Framework
Note that the resulting performance of various investment outcomes that can be generated through use of Qaurum, the Gold Valuation Framework and other information are hypothetical in nature, may not reflect actual investment results and are not guarantees of future results. Neither World Gold Council (including its affiliates) nor Oxford Economics provides any warranty or guarantee regarding the functionality of the tool, including without limitation any projections, estimates or calculations.
China’s gold market update: Investment robust in February
Ray Jia
Head of Research (Asia Pacific, ex-India) and Deputy Head of Trade Engagement (China) World Gold CouncilHighlights
- Gold’s strength sustained: during the period from 27 January to 28 February 2025 – taking account of the Chinese New Year’s (CNY) holiday1 – the LBMA Gold Price PM was up by 3.4% and the Shanghai Benchmark Gold Price PM (SHAUPM) rose by 4.3%2
- The local gold price spread dipped in February as wholesale gold demand fell seasonally: gold withdrawals from the Shanghai Gold Exchange (SGE) dropped 27% m/m to 90t. And the y/y weakness continued as tepid gold jewellery sales, in tonnage terms, overshadowed robust investment
- Chinese gold ETFs witnessed their strongest monthly inflow on record, adding RMB14bn (US$1.9bn) in February and lifting the total assets under management (AUM) to RMB89bn (US$12bn). Holdings surged by 21t to 131t and both the AUM and holdings reached month-end peaks
- The People’s Bank of China (PBoC) continued to announce gold purchases in the month, adding 5t to its gold holdings. Four consecutive monthly purchases have pushed China’s gold reserves to 2,290t, 5.9% of total.
Looking ahead
- In the near future we believe that investment demand for gold will likely stay robust – despite potential fluctuations as the gold price changes – and gold jewellery consumption may start to stabilise should the local gold price remain steady and the economic picture continue to improve.
Chart 1: The RMB gold price held strong in February
Annual returns of the SHAUPM in RMB and the LBMA Gold Price PM in USD*
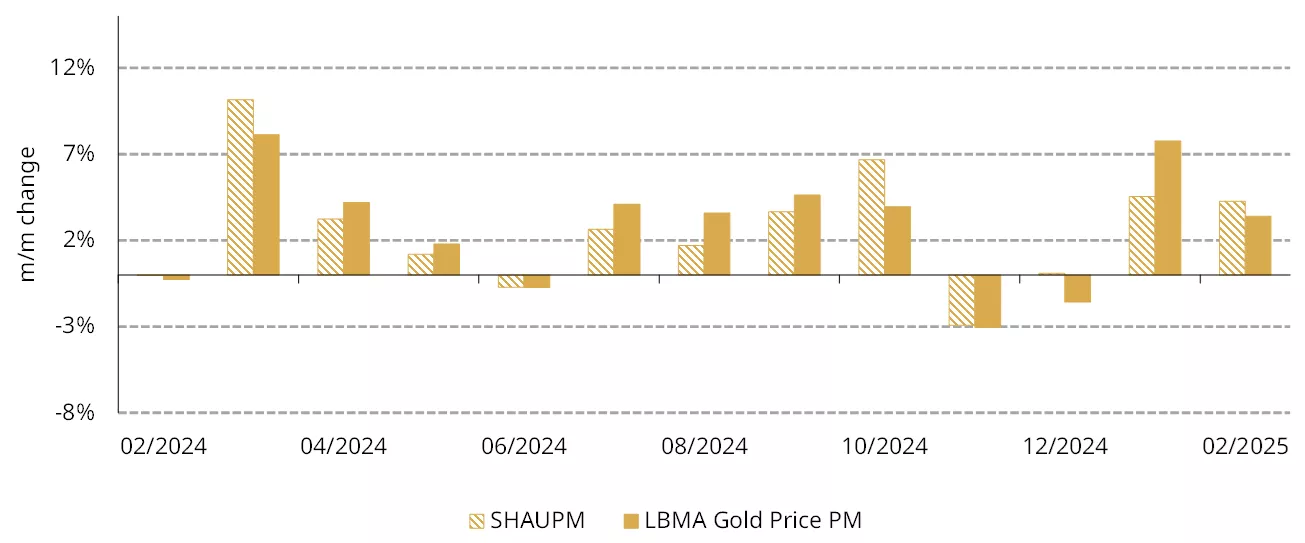
*February return based on prices between 27 January – the last trading day before the CNY holiday – and 28 February 2025.
Source: Bloomberg, World Gold Council
Gold price strength extends
Gold prices rose further. Both the SHAUPM in RMB and the LBMA Gold Price PM in USD climbed higher between 27 January and 28 February as noted above (Chart 1). The relative outperformance of the gold price in RMB, compared to its USD peer, was mainly driven by a 0.5% depreciation in the local currency during the period.
Although gold prices adjusted lower in the latter half of February, they continued to refresh records during the period, both in USD (on 11 occasions) and RMB (on six occasions). Our analysis shows that market momentum, generally lowering yields and a weaker dollar drove gold higher.
Wholesale demand falls seasonally
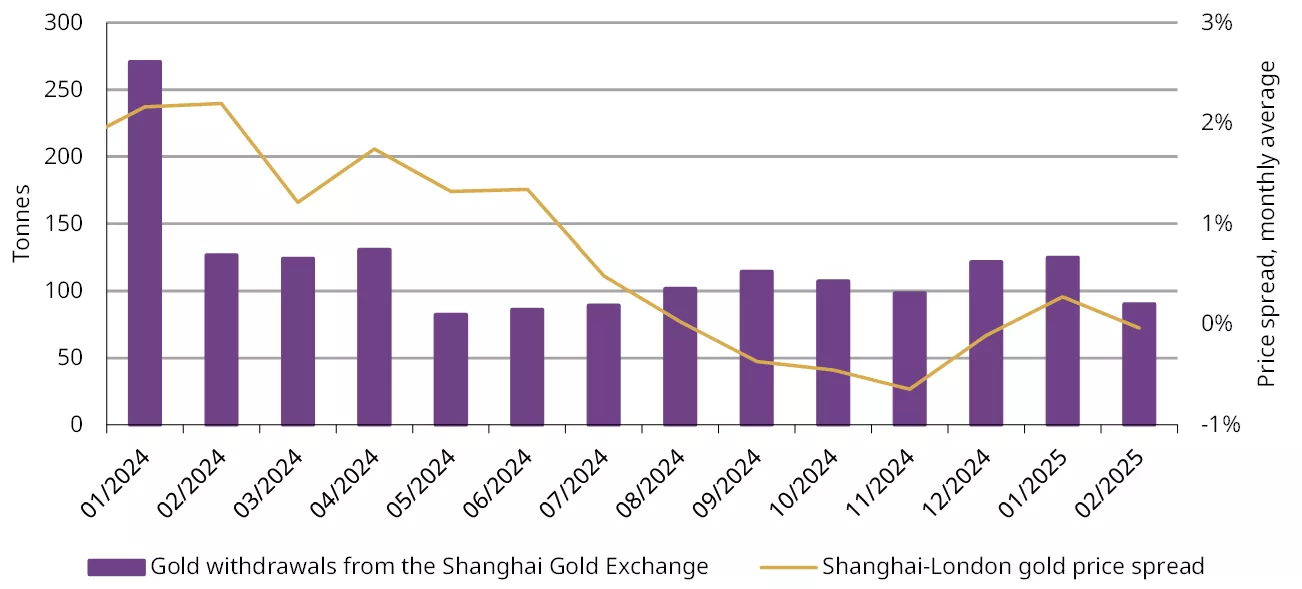
Gold withdrawals from the SGE declined in February, totalling 90t, a 28% m/m drop. This weakness is mainly seasonal – wholesalers and manufacturers typically buy less gold after the CNY holiday due to active replenishment prior. In fact, every February on record – except 2023 when pent-up demand from COVID restrictions pushed up demand – has seen a m/m decline, averaging 41% over the past ten years. Lower demand during the month led to a fall in the Shanghai–London gold price spread (Chart 2).
Chart 2: Wholesale demand fell seasonally in February
Gold withdrawals from the SGE and the Shanghai-London gold price spread*
*As of 28 February 2025.
Source: Shanghai Gold Exchange, World Gold Council
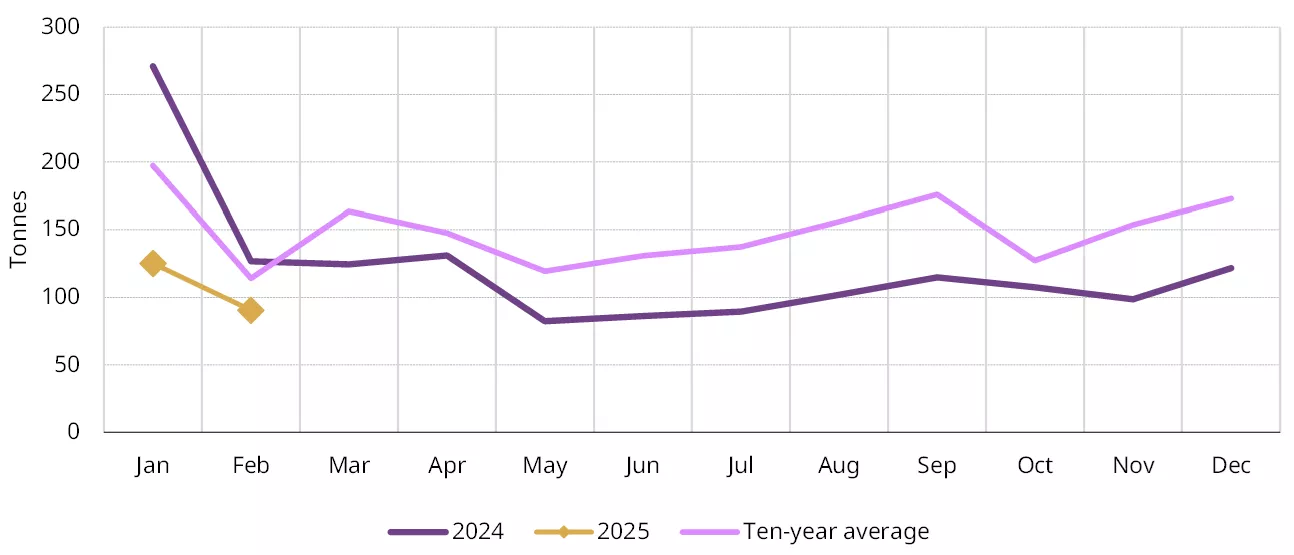
But the y/y picture remains weak. As previously noted, the soaring local gold price continues to supress local gold jewellery demand in tonnage terms, leading to weaker stocking activities among jewellery manufacturers, who account for the lion’s share of SGE withdrawals. In contrast, investment demand for gold has been robust as the soaring gold price attracts investors. But it was not enough to offset the jewellery sector weakness, resulting in a 29% y/y fall in February’s total withdrawals (Chart 3).
Chart 3: February wholesale demand remained weak compared to previous years
Gold withdrawals from the SGE and the 10-year average*
*The 10-year average is based on data between 2015 and 2024.
Source: Shanghai Gold Exchange, World Gold Council
Chinese gold ETFs see record-level inflows
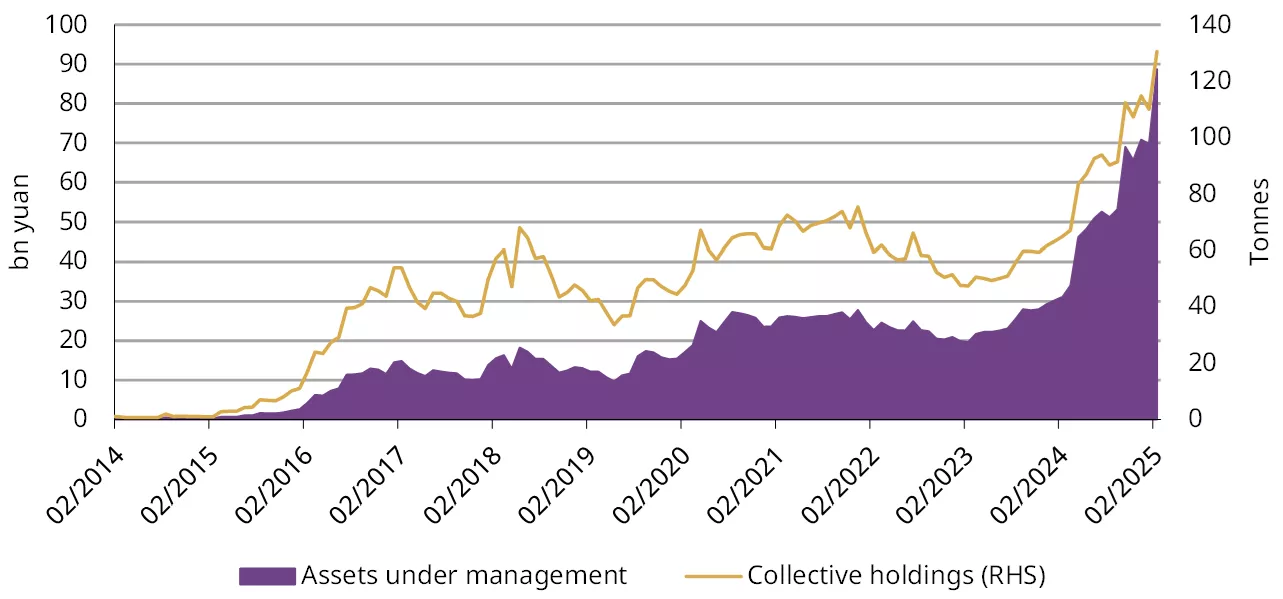
Chinese gold ETFs added RMB14bn (US$1.9bn) in February, the largest ever monthly inflow. Sizable inflows and a rising gold price pushed Chinese gold ETFs’ total AUM to RMB89bn (US$12bn), another month-end peak (Chart 4). Meanwhile, holdings rose 21t to 131t, also the highest on record. The strong local gold price performance in the month – especially the gapping up at opening on 5 February when investors came back from the CNY holiday – attracted attention. Meanwhile, concerns around the Trump administration’s trade policy may have sparked some safe-haven flows.
Chart 4: Both Chinese gold ETFs’ AUM and holdings reached record highs
Collective holdings and AUM of Chinese gold ETFs*
*As of 28 February 2025.
Source: Company filings, World Gold Council
Official gold holdings’ rising streak extends to four months
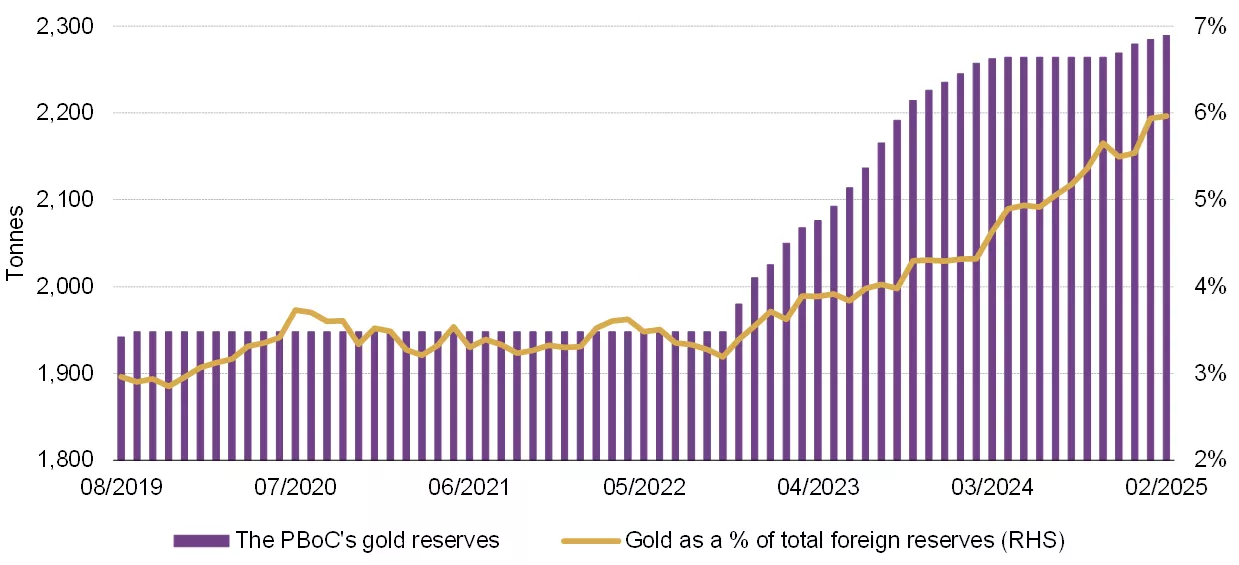
The PBoC reported another 5t gold purchase in February, the fourth consecutive month of gold reserve increases (Chart 5). At the end of February China’s official gold holdings stood at 2,290t, the highest on record, accounting for 5.9% of total foreign exchange reserves. During the first two months of 2025 Chinese gold reserves increased by 10t in total.
Chart 5: The PBoC adds gold four months in a row
Reported official gold holdings and gold as a percentage of total foreign exchange reserves*
*As of 28 February 2025.
Source: State Administration of Foreign Exchange, World Gold Council
Looking ahead
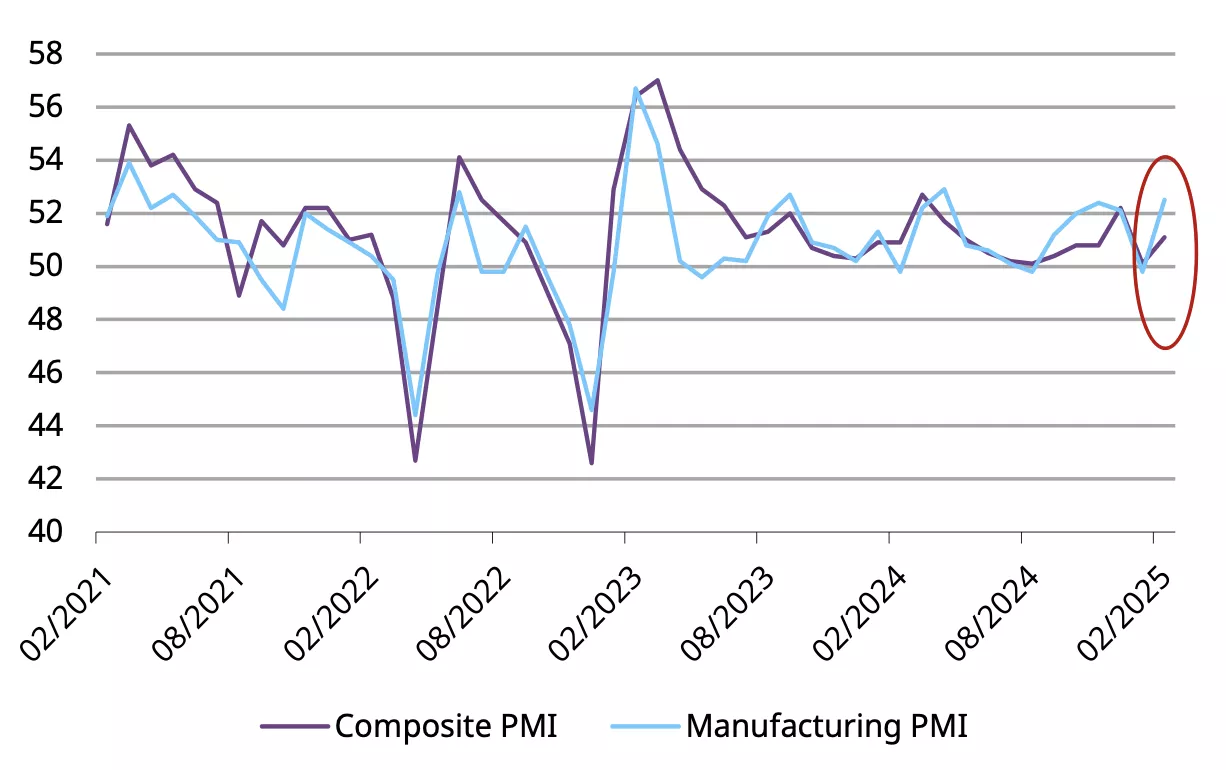
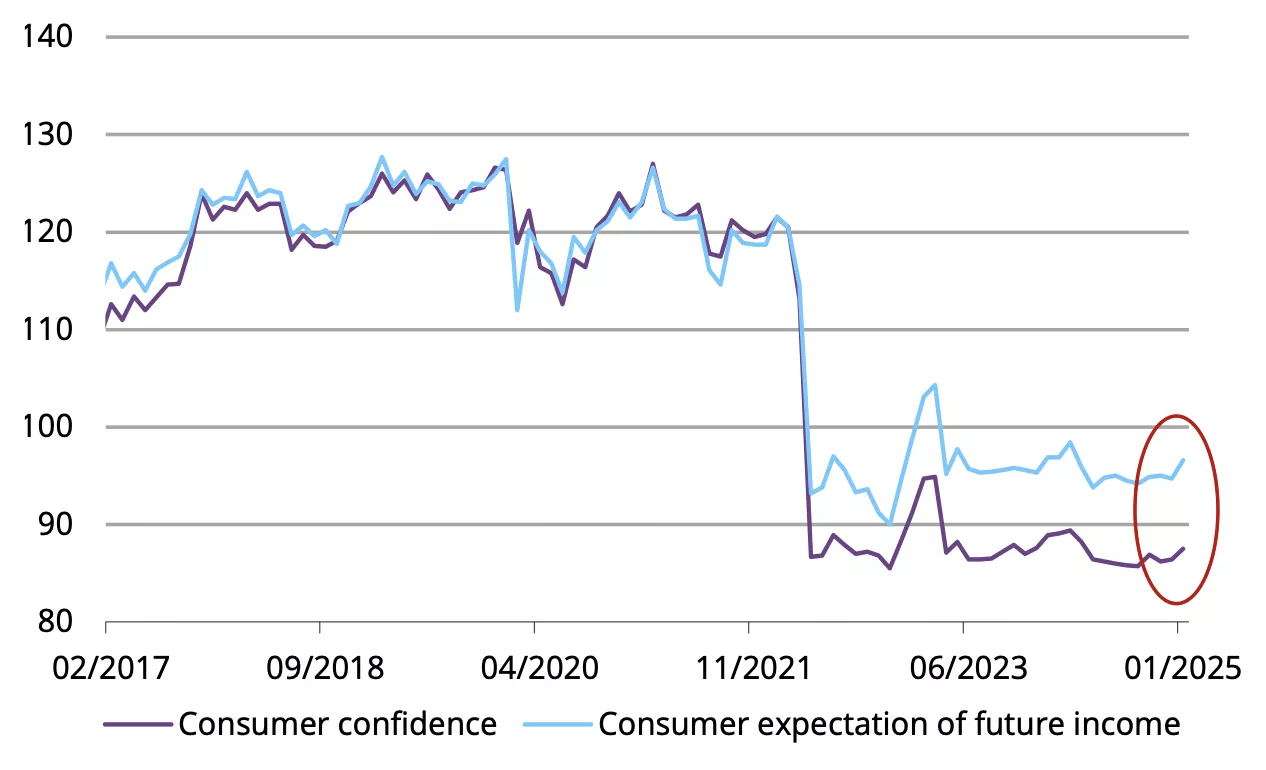
China’s economic growth is showing signs of improvement. Official manufacturing and composite PMIs both exceeded the market consensus, expanding in February. And new loans during January surged to a record high, far outpacing expectations – also reflecting policy stimulus to shore up credit and bank loans front-loading patterns. More importantly, January also saw a tick up in consumer confidence – although the sustainability of this improvement needs to be monitored closely (Chart 6). Meanwhile, the “two sessions” revealed an official growth target of 5% for 2025, together with stronger fiscal and monetary policy supports, including a higher deficit-to-GDP ratio of 4% and further interest rate cuts to achieve this goal.3
Chart 6: Economic activities improved after the CNY holiday and consumer confidence ticked up
The official PMIs (above)* and consumer confidence and expectation of future income (below)**
*As of February 2025.
**As of January 2025.
Source: Bloomberg, World Gold Council
Should the gold price continue to stabilise and economic prospects keep improving, stability should return to the gold jewellery sector. We continue to believe that investment demand for gold could also remain generally robust as investors anticipate further price gains and concerns of the US trade policy uncertainties push up safe-haven buying.
Footnotes
1The CNY holiday occurred between 28 January and 4 February 2025 and local markets were closed.
2We refer to the LBMA Gold Price PM here as this is the standard global gold price benchmark; we use LBMA Gold Price AM and SHAUPM to compute Shanghai-London gold price spread as they have a narrower trading window.
3For more, see: Targets set in 2025 government work report, 5 March 2025.
Disclaimer
Important information and disclaimers
© 2025 World Gold Council. All rights reserved. World Gold Council and the Circle device are trademarks of the World Gold Council or its affiliates.
All references to LBMA Gold Price are used with the permission of ICE Benchmark Administration Limited and have been provided for informational purposes only. ICE Benchmark Administration Limited accepts no liability or responsibility for the accuracy of the prices or the underlying product to which the prices may be referenced. Other content is the intellectual property of the respective third party and all rights are reserved to them.
Reproduction or redistribution of any of this information is expressly prohibited without the prior written consent of World Gold Council or the appropriate copyright owners, except as specifically provided below. Information and statistics are copyright © and/or other intellectual property of the World Gold Council or its affiliates or third-party providers identified herein. All rights of the respective owners are reserved.
The use of the statistics in this information is permitted for the purposes of review and commentary (including media commentary) in line with fair industry practice, subject to the following two pre-conditions: (i) only limited extracts of data or analysis be used; and (ii) any and all use of these statistics is accompanied by a citation to World Gold Council and, where appropriate, to Metals Focus or other identified copyright owners as their source. World Gold Council is affiliated with Metals Focus.
The World Gold Council and its affiliates do not guarantee the accuracy or completeness of any information nor accept responsibility for any losses or damages arising directly or indirectly from the use of this information.
This information is for educational purposes only and by receiving this information, you agree with its intended purpose. Nothing contained herein is intended to constitute a recommendation, investment advice, or offer for the purchase or sale of gold, any gold-related products or services or any other products, services, securities or financial instruments (collectively, “Services”). This information does not take into account any investment objectives, financial situation or particular needs of any particular person.
Diversification does not guarantee any investment returns and does not eliminate the risk of loss. Past performance is not necessarily indicative of future results. The resulting performance of any investment outcomes that can be generated through allocation to gold are hypothetical in nature, may not reflect actual investment results and are not guarantees of future results. The World Gold Council and its affiliates do not guarantee or warranty any calculations and models used in any hypothetical portfolios or any outcomes resulting from any such use. Investors should discuss their individual circumstances with their appropriate investment professionals before making any decision regarding any Services or investments.
This information may contain forward-looking statements, such as statements which use the words “believes”, “expects”, “may”, or “suggests”, or similar terminology, which are based on current expectations and are subject to change. Forward-looking statements involve a number of risks and uncertainties. There can be no assurance that any forward-looking statements will be achieved. World Gold Council and its affiliates assume no responsibility for updating any forward-looking statements.
Information regarding QaurumSM and the Gold Valuation Framework
Note that the resulting performance of various investment outcomes that can be generated through use of Qaurum, the Gold Valuation Framework and other information are hypothetical in nature, may not reflect actual investment results and are not guarantees of future results. Neither World Gold Council (including its affiliates) nor Oxford Economics provides any warranty or guarantee regarding the functionality of the tool, including without limitation any projections, estimates or calculations.
You asked, we answered: Gold hits $3,000 – What comes next?
Taylor Burnette
Research Lead, Americas World Gold CouncilKey highlights
- Gold’s new milestone: Gold recently crossed US$3,000/oz intraday – a headline-worthy event, but the true significance for gold lies in the broader economic trends driving its rise
- Price momentum: Gold surged from US$2,500/oz to US$3,000 in just 210 days, pushing it three standard deviations above its 200-day moving average
- Market fundamentals: While gold may face some consolidation due to the speed of its latest move, the combination of geopolitical and geoeconomic uncertainty, rising inflation, lower rates and a weaker US dollar continue to provide powerful tailwinds to investment demand.
Gold (briefly) breaks through another psychological level
Gold crossed US$3,000/oz in intra-day trading during the early hours of Friday 14 March and then again on Monday 17 March.1 While the LBMA Gold Price PM hasn’t officially crossed the mark, setting at US$2,996.50/oz on Monday, it has nonetheless grabbed the attention of investors and media outlets around the world, triggering a myriad of questions about its significance.
So, what does this milestone really mean? Depending on who you ask: a lot or not much at all. For us, there are interesting psychological and technical aspects about this triple-zero ending price that could influence gold’s short-term behaviour. But the more meaningful – and lasting – dynamics are the ones behind gold’s performance over the past several months.
What’s meaningful about gold’s move?
Gold reached more than 40 new all-time highs in 2024 and fourteen more so far this year.2 Its upward move has been no coincidence and, in our most recent Gold Market Commentary, we talked about a potential perfect storm forming for gold. The focus isn’t just the number itself but the pace at which gold has reached it. The jump from US$2,500/oz to US$3,000/oz took just 210 days – a notably faster move that underscores the momentum gold has built over the past two years (Chart 1). Compare that to the approximate 1,700 days that gold took, on average, to achieve previous US$500/oz increments, and the move stands out (Table 1).
Chart 1: Gold’s recent surge defied historical trends, reaching $3,000 in record time
Historical price data shows gold has averaged 1,708 days to climb $500 increments, yet the latest jump took just 210 days*
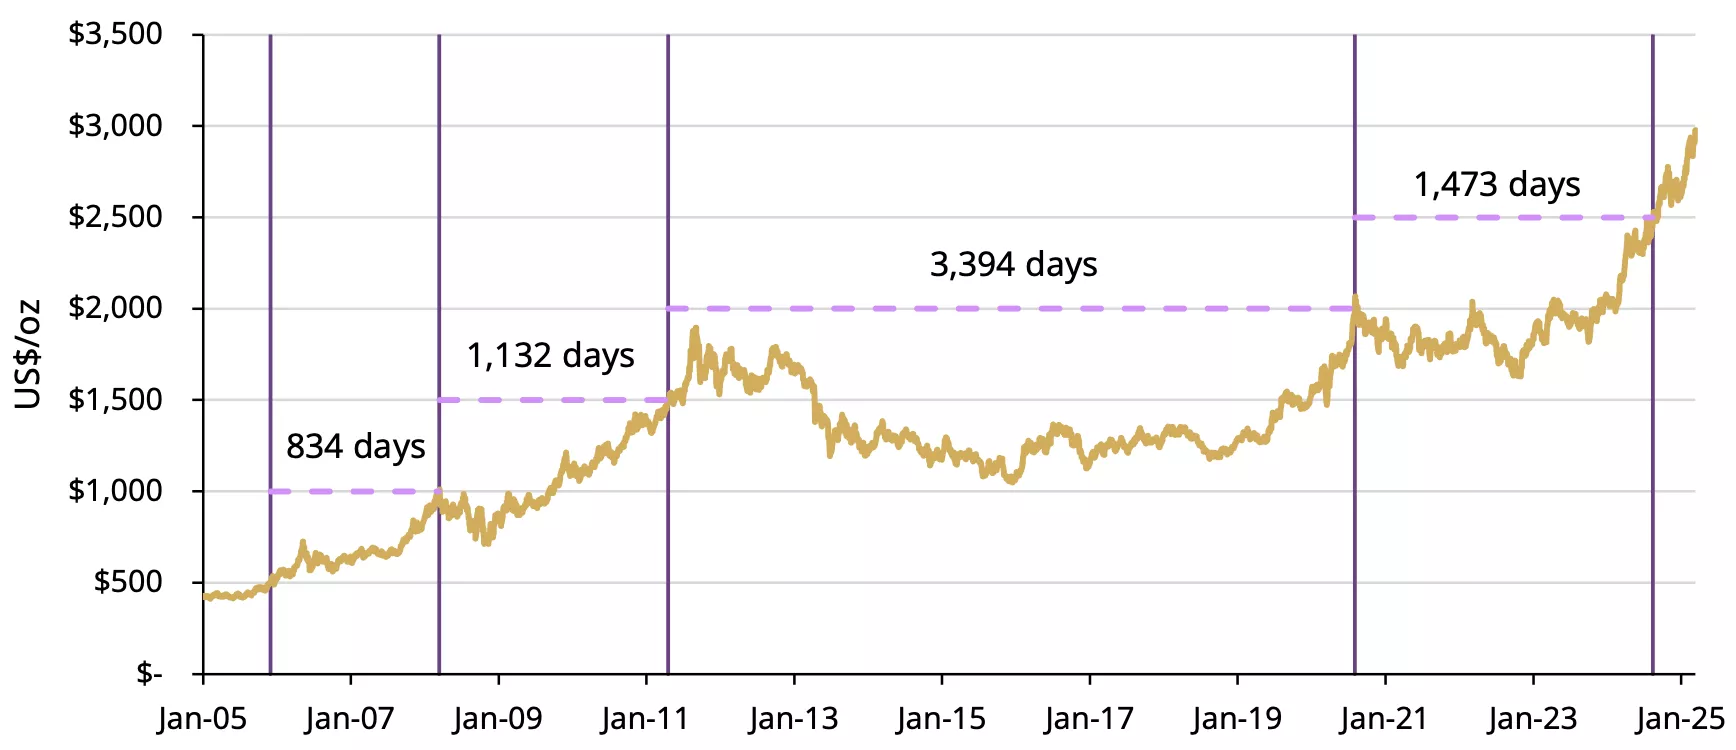
*Each vertical lines signifies the date when each initial $500 incremental level was breached starting with $500 (far left side) and the last line (furthest to the right) representing $2,500
Source: Bloomberg, World Gold Council
Table 1: Historical gold price support & resistance level overview
Historical gold price support and resistance level summary*
| Price Level ($/oz) | Breakout date | Days above | Initial pullback date | Recovery date | Round trip days | Days to next milestone | Years to next milestone |
| 500 | 12/01/2005 | 18 | 12/20/2005 | 12/22/2005 | 2 | 834 | 2 |
| 1,000 | 3/14/2008 | 3 | 3/18/2008 | 09/11/2009 | 542 | 1132 | 3 |
| 1,500 | 4/20/2011 | 14 | 05/05/2011 | 05/09/2011 | 4 | 3394 | 9 |
| 2,000 | 08/04/2020 | 6 | 08/11/2020 | 8/18/2020 | 7 | 1473 | 4 |
| 2,500 | 8/16/2024 | 5 | 8/22/2024 | 8/23/2024 | 1 | TBD | TBD |
| Average | 9 | 111 | 1708 | 4.7 | |||
| Median | 6 | 4 | 1303 | 3.6 |
*Based on the LBMA Gold Price PM as of 17 March 2025. Breakout date defined as first day gold broke through resistance. Pullback date defined as first date that gold fell through support level (resistance level it just broke). Recovery date is the date on which gold round tripped back through its prior support/resistance level and stayed above that.
Source: Bloomberg, World Gold Council
In fairness, gold had to double in price to go from US$500/oz to US$1,000/oz, while it only had to rise 20% to go from US$2,500/oz to US$3,000/oz. To provide additional context, gold has increased nearly sixfold since December 2005, when it first reached US$500/oz, equivalent to an annualised return of 9.7%. Over the same period, the S&P 500 spot index has increased at a rate of 8.2% per year.3
To take this relative movement into account, we look instead at how much gold has deviated from its 200-day moving average (200DMA). The recent rally has pushed gold’s price three standard deviations (3σ) above the long-term average spread of its 200DMA (Chart 2). Most recently, we saw this extreme divergence during the COVID-19 pandemic in 2020 when gold crossed US$2,000/oz and again around the time gold reached US$2,500/oz. Following these moves there was a period of consolidation before the upward trend eventually resumed.
Chart 2: Gold’s recent move to US$3,000/oz represents a 3σ divergence above its moving average
Difference (spread) between spot gold (XAU) and its 200DMA*
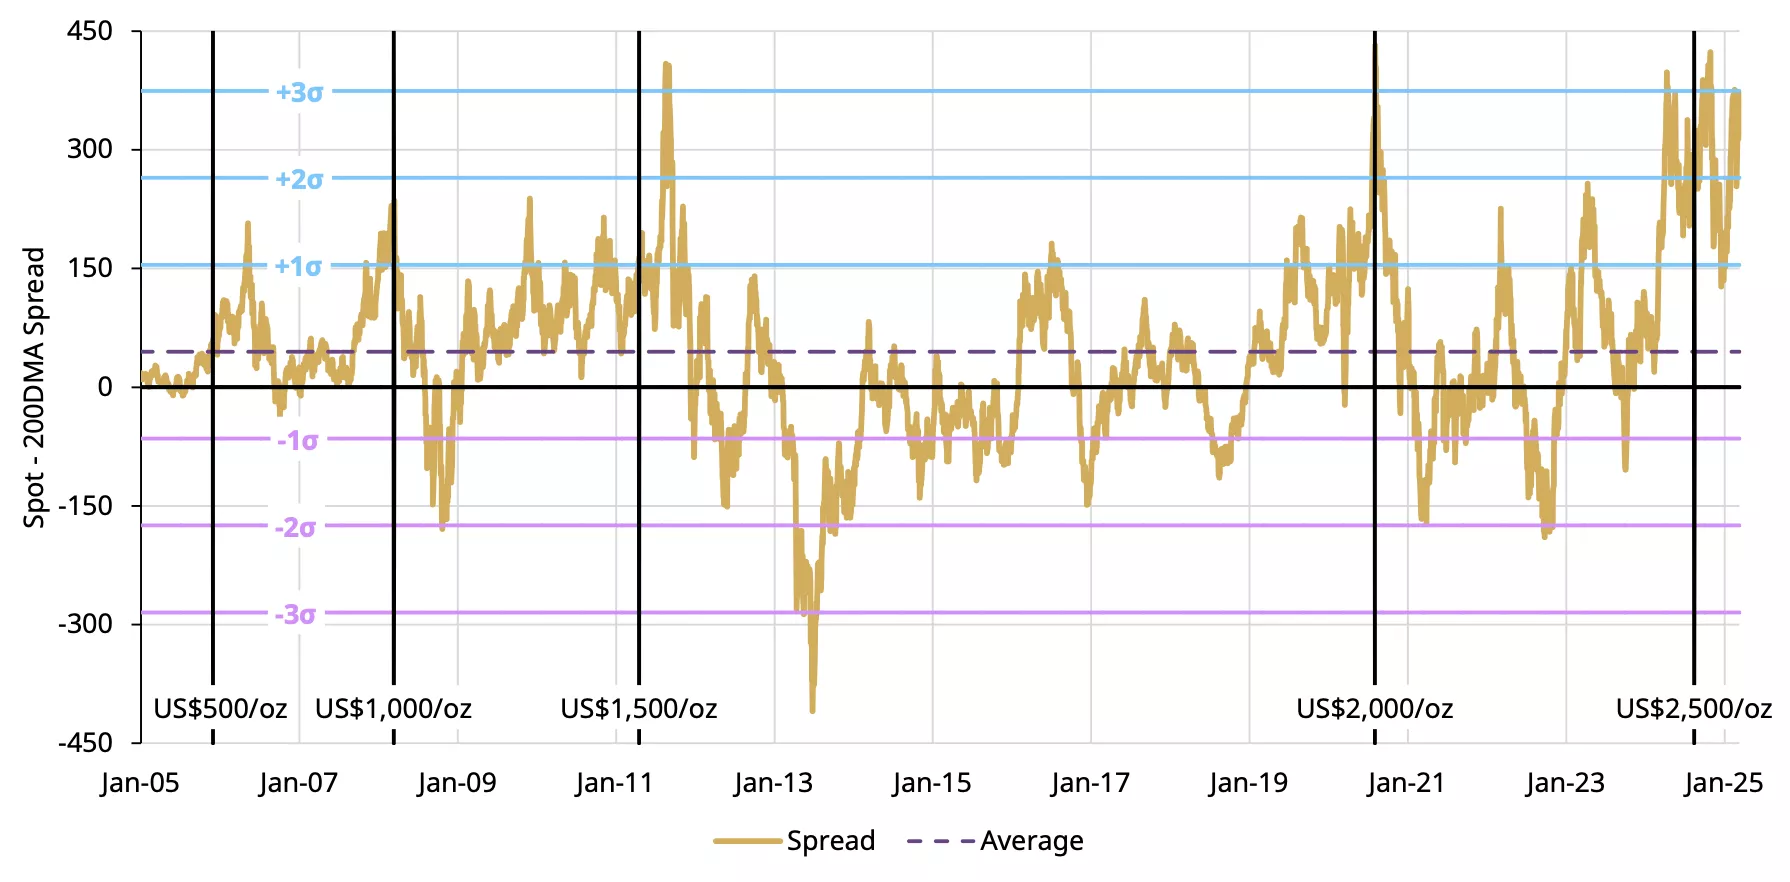
*Based on spot gold (XAU) as of 14 March 2025. Spread calculated as daily difference between spot price and its 200DMA. Each vertical black lines signifies the date when each initial US$500/oz incremental level was breached starting with US$500/oz (far left side) and the last black line (furthest to the right) representing US$2,500/oz.
Source: Bloomberg, World Gold Council
What’s next?
As the saying goes, “even strong rallies need to catch their breath.” Gold has remained, on average, above previous multiples of US$500/oz for nine days before pulling back (Table 1). At the same time, however, gold has rebounded above the same level in just a few days four out of five times.
From a technical and positioning standpoint, if gold were to remain above US$3,000/oz over the next couple of weeks, it would likely trigger additional buying from derivatives contracts. For example, we estimate there is roughly US$8bn in net delta-adjusted notional in options contracts from US gold ETFs that expire Friday 21 March,4 and US$16bn in options on futures that expire on 26 March. While this may create a slingshot effect, it could also trigger short-term-profit taking.
In view of the speed of gold’s latest move, it would not be surprising to see some price consolidation. But despite potential short-term volatility, the most important determinant for gold’s next move is whether fundamentals can provide long-term support to its trend. As we discussed in our recent Gold Demand Trends, while price strength will likely create headwinds for gold jewellery demand, push recycling up and motivate some profit taking, there are many reasons to believe that investment demand will continue to be supported by a combination of geopolitical and geoeconomic uncertainty, rising inflation, lower rates and a weaker US dollar.
Footnotes
1Indicative Bloomberg data on spot gold (XAU) suggests that gold broke through US$3,000/oz in the morning of Friday 14 March and Monday 17 March 2025.
2Based on the LBMA Gold Price PM, as of 17 March 2025.
3Including and reinvesting dividends, the S&P 500 has increased by approximately 10% between 1 December 2005 and 14 March 2025.
4The delta adjusted notional outstanding is based on options on the largest two US gold ETFs, GLD and IAU, which we estimate at $8bn and $20mm, respectively as of 17 March.
Disclaimer
Important information and disclaimers
© 2025 World Gold Council. All rights reserved. World Gold Council and the Circle device are trademarks of the World Gold Council or its affiliates.
All references to LBMA Gold Price are used with the permission of ICE Benchmark Administration Limited and have been provided for informational purposes only. ICE Benchmark Administration Limited accepts no liability or responsibility for the accuracy of the prices or the underlying product to which the prices may be referenced. Other content is the intellectual property of the respective third party and all rights are reserved to them.
Reproduction or redistribution of any of this information is expressly prohibited without the prior written consent of World Gold Council or the appropriate copyright owners, except as specifically provided below. Information and statistics are copyright © and/or other intellectual property of the World Gold Council or its affiliates or third-party providers identified herein. All rights of the respective owners are reserved.
The use of the statistics in this information is permitted for the purposes of review and commentary (including media commentary) in line with fair industry practice, subject to the following two pre-conditions: (i) only limited extracts of data or analysis be used; and (ii) any and all use of these statistics is accompanied by a citation to World Gold Council and, where appropriate, to Metals Focus or other identified copyright owners as their source. World Gold Council is affiliated with Metals Focus.
The World Gold Council and its affiliates do not guarantee the accuracy or completeness of any information nor accept responsibility for any losses or damages arising directly or indirectly from the use of this information.
This information is for educational purposes only and by receiving this information, you agree with its intended purpose. Nothing contained herein is intended to constitute a recommendation, investment advice, or offer for the purchase or sale of gold, any gold-related products or services or any other products, services, securities or financial instruments (collectively, “Services”). This information does not take into account any investment objectives, financial situation or particular needs of any particular person.
Diversification does not guarantee any investment returns and does not eliminate the risk of loss. Past performance is not necessarily indicative of future results. The resulting performance of any investment outcomes that can be generated through allocation to gold are hypothetical in nature, may not reflect actual investment results and are not guarantees of future results. The World Gold Council and its affiliates do not guarantee or warranty any calculations and models used in any hypothetical portfolios or any outcomes resulting from any such use. Investors should discuss their individual circumstances with their appropriate investment professionals before making any decision regarding any Services or investments.
This information may contain forward-looking statements, such as statements which use the words “believes”, “expects”, “may”, or “suggests”, or similar terminology, which are based on current expectations and are subject to change. Forward-looking statements involve a number of risks and uncertainties. There can be no assurance that any forward-looking statements will be achieved. World Gold Council and its affiliates assume no responsibility for updating any forward-looking statements.
Information regarding QaurumSM and the Gold Valuation Framework
Note that the resulting performance of various investment outcomes that can be generated through use of Qaurum, the Gold Valuation Framework and other information are hypothetical in nature, may not reflect actual investment results and are not guarantees of future results. Neither World Gold Council (including its affiliates) nor Oxford Economics provides any warranty or guarantee regarding the functionality of the tool, including without limitation any projections, estimates or calculations.
India gold market update: Investment appetite upheld
Kavita Chacko
Research Head, India World Gold CouncilHighlights
- Gold’s price momentum remains strong, breaching records, with domestic gold prices gaining 13% y-t-d
- Price rises dampen jewellery purchases but boost old gold sales; investment demand is sustained: gold ETFs see healthy inflows in February, although below January’s peak
- The Reserve Bank of India (RBI) gold holdings remains unchanged in February
- Gold imports drop to an 11-month low in February.
Looking ahead
- Expectation is growing that seasonal factors (auspicious days and festivals) and wedding related purchases could lend support to gold demand over the next couple of months. This may not, however, fully compensate for the price-driven constraints in jewellery demand.
Gold’s unprecedented momentum
Gold’s momentum has been exceptionally strong in 2025. So far this year prices have hit 13 new highs1 and have crossed the psychological threshold of US$3,000/oz.2 This performance, which has been replicated across major currencies, is driven by economic trends and sustained investment demand. Geopolitical and economic uncertainty, a weaker USD, lowering of interest rates across economies, and inflation concerns are fuelling investment demand and influencing prices.
Chart 1: Gold’s unyielding rise
Monthly LBMA Price AM and domestic landed price changes and movement*
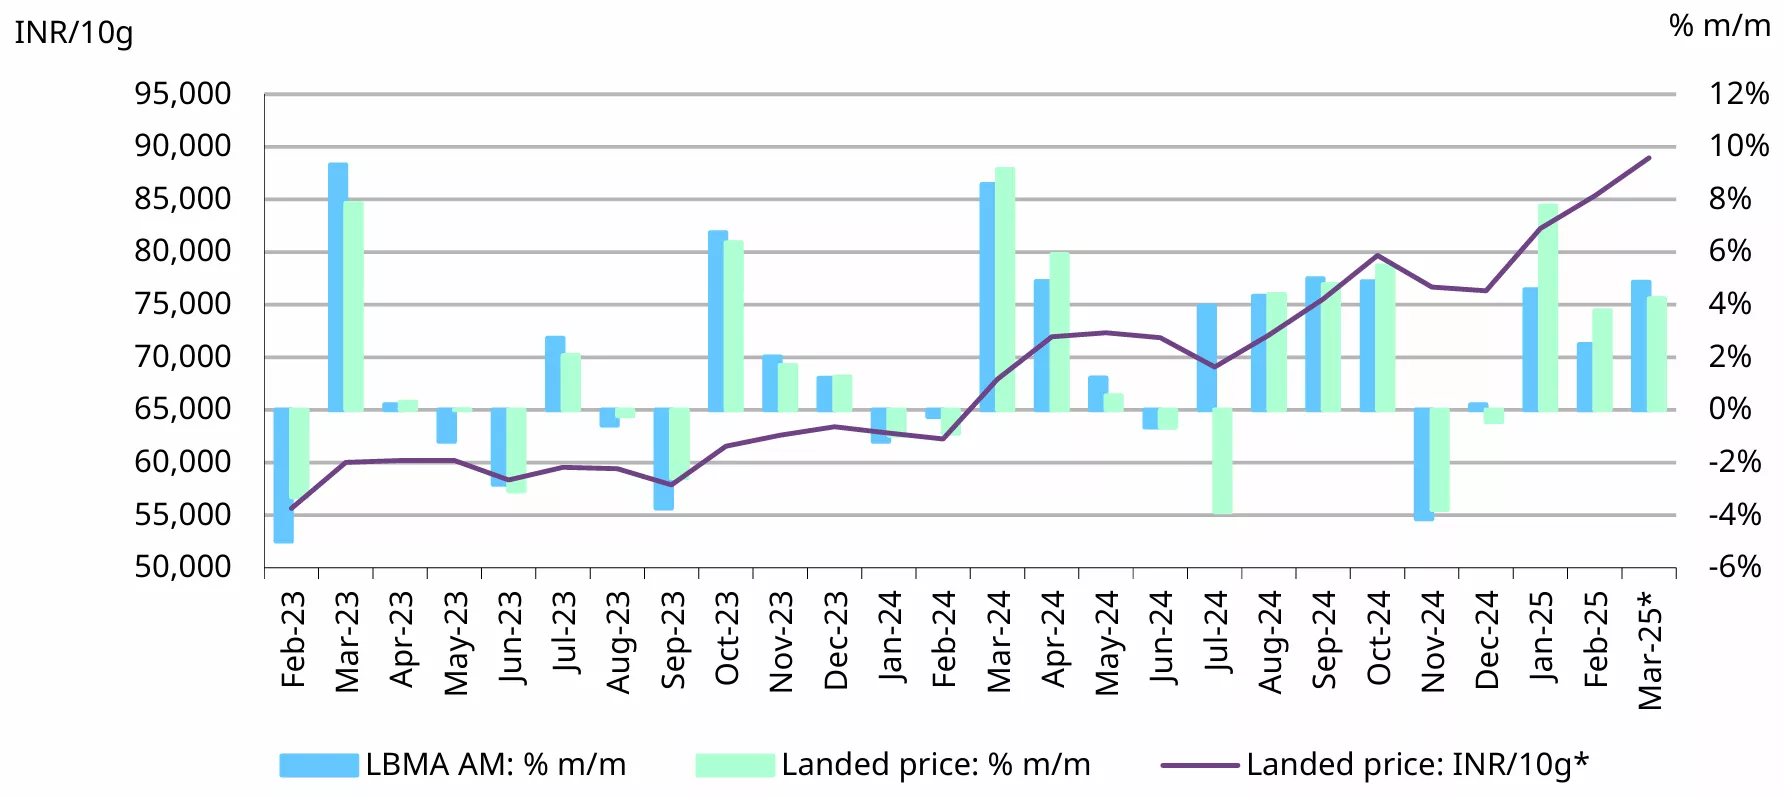
*Based on the LBMA Gold Price AM in USD expressed in local currency as of 14 March 2025. Landed price of gold is the international price (LBMA gold price AM) adjusted for import taxes and exchange rate
Source: Bloomberg, World Gold Council.
So far in 2025,3 the LBMA gold price AM in USD has risen by US$330/oz or 12%, to US$2,999/oz, with over 4% of that increase taking place in the first half of March. The Indian domestic landed price4 has risen in tandem, gaining 17% to reach a record INR88,946/10g. The larger gains can be attributed to weakness in the INR against the USD (1.3% depreciation y-t-d). However, given the weakness in demand – particularly in jewellery – the domestic gold price remains at a discount relative to the landed price. The discount, or spread, between local and landed prices averaged US$12/oz in the first half of March, slightly narrower than the US$17/oz spread observed in February.
Gold remains India’s top performing asset, with y-t-d gains of 13%,5 in sharp contrast with the negative return from domestic equities and notably surpassing gains in fixed income assets (bonds and bank deposits). This underscores the strategic significance of gold in investor portfolios.
Chart 2: Gold outperforms other asset classes
% y-t-d returns in INR*
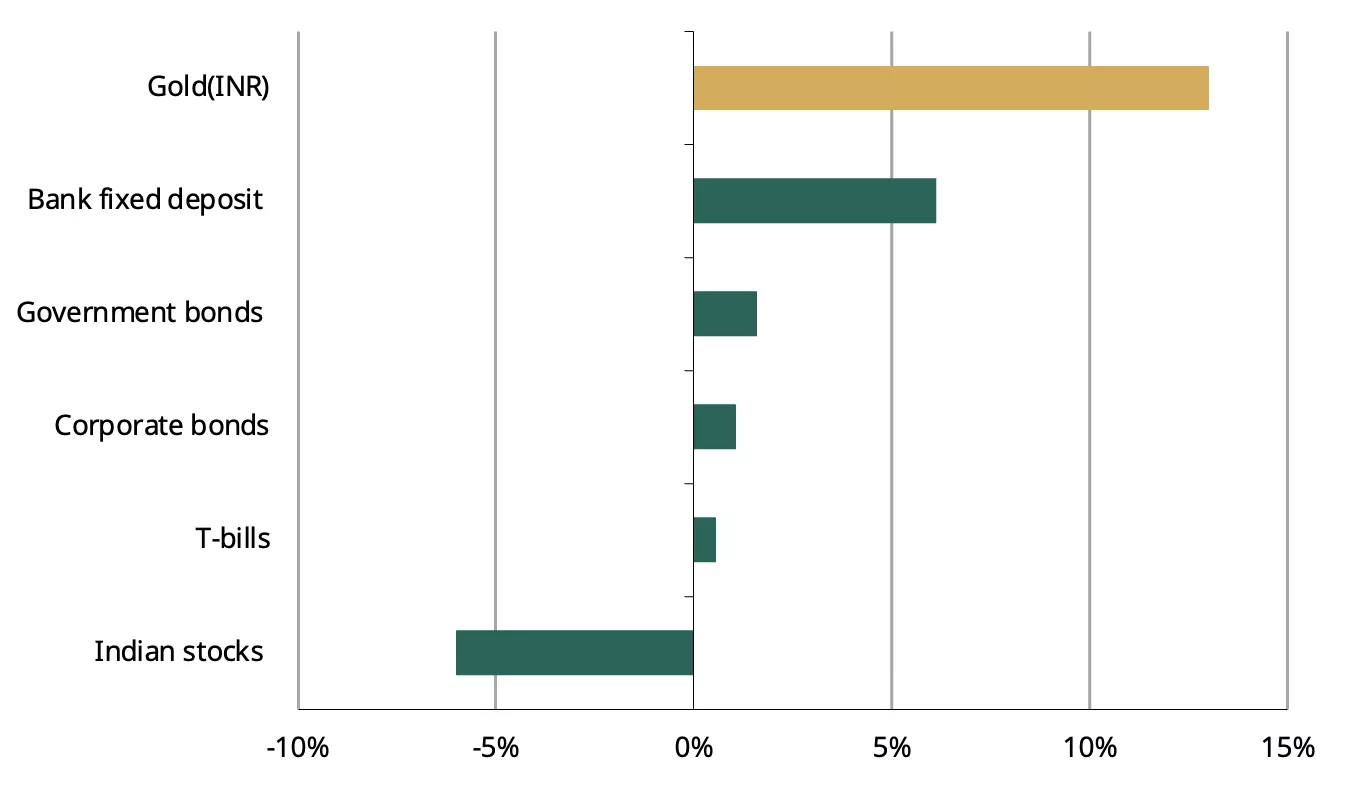
*As of 13 March 2025. Indices used: MCX Gold Index (for 995 purity), CRISIL Corporate Bond Index, S&P BSE Sensex Total Return Index, Clearing Corp of India Liquidity Weight T-Bill Index, ICE BofA Govt Bond Index.
Source: Bloomberg, World Gold Council
Price surge limits jewellery purchases but drives sales of old gold
Record high prices have dented demand, particularly for gold jewellery, with purchases restricted to those that are need-based, primarily weddings. In addition, financial year-end dynamics, such as statutory payments and tax-saving investments, are curtailing discretionary spending and further weighing on demand. This slowdown is broad-based across both urban and rural areas. Anecdotal reports indicate that consumers continue to wait on the sidelines, hoping for a correction in prices or at least signs of price stability. Despite this, notwithstanding an easing in momentum, investment demand for bars and coins remains relatively healthy, driven by bullish sentiment regarding the future trajectory of the gold price.
The surge in gold prices has prompted sales of old gold jewellery. Retailers have reported a significant uptick in scrap or old gold sales, with some attributing up to a third of their sales to the exchange of old jewellery for newer, lighter pieces. Furthermore, loans against gold jewellery have increased. To the end of January this year, retail gold loans by commercial banks were up 77% y/y, indicating that consumers are increasingly leveraging gold for liquidity and financial gain.
Gold ETFs maintain momentum
Indian gold ETFs continued their inflow in February. While lower than January’s record high, they remained healthy, driven by broadening investor interest amid global economic and market uncertainty and the positive momentum in the gold price.
According to the Association of Mutual Funds in India (AMFI), gold ETFs recorded net inflows of INR19.8bn(~US$227mn) in February,6 marking the tenth consecutive month of positive flows. Although lower than January’s peak,7 this surpassed the average net inflow figure (INR14.8bn/US$175mn) recorded over the preceding nine months. February also witnessed significant redemptions, totalling INR7.8bn/US$89.7mn – the highest since April 2024. This may be attributed to profit taking as gold prices surged. Despite these redemptions, investor participation remained strong with 0.3mn investor accounts (or folios) added during the month, bringing the total number of gold ETF investor accounts to a record 6.8mn, reflecting a growing investor interest in this instrument. Cumulative assets under management (AUM) of gold ETFs grew to INR55.7bn(~US$6.4bn), up 7% m/m and 95% y/y. Overall holdings increased by 2.2t, taking collective holdings to 64.6t. These figures are in line with our initial estimates based on information available at the time.8 Rising investor interest has encouraged fund houses to introduce new gold ETF products, two of which were launched in February, bringing the total number of domestic gold ETFs to 20. At the end of February gold ETFs accounted for 0.9% of total AUM of mutual funds, up from 0.5% a year ago – an indication of the growing traction among investors.
Chart 3: Gold ETFs keep climbing
Monthly gold ETF fund flows in INRbn, and total holdings in tonnes*
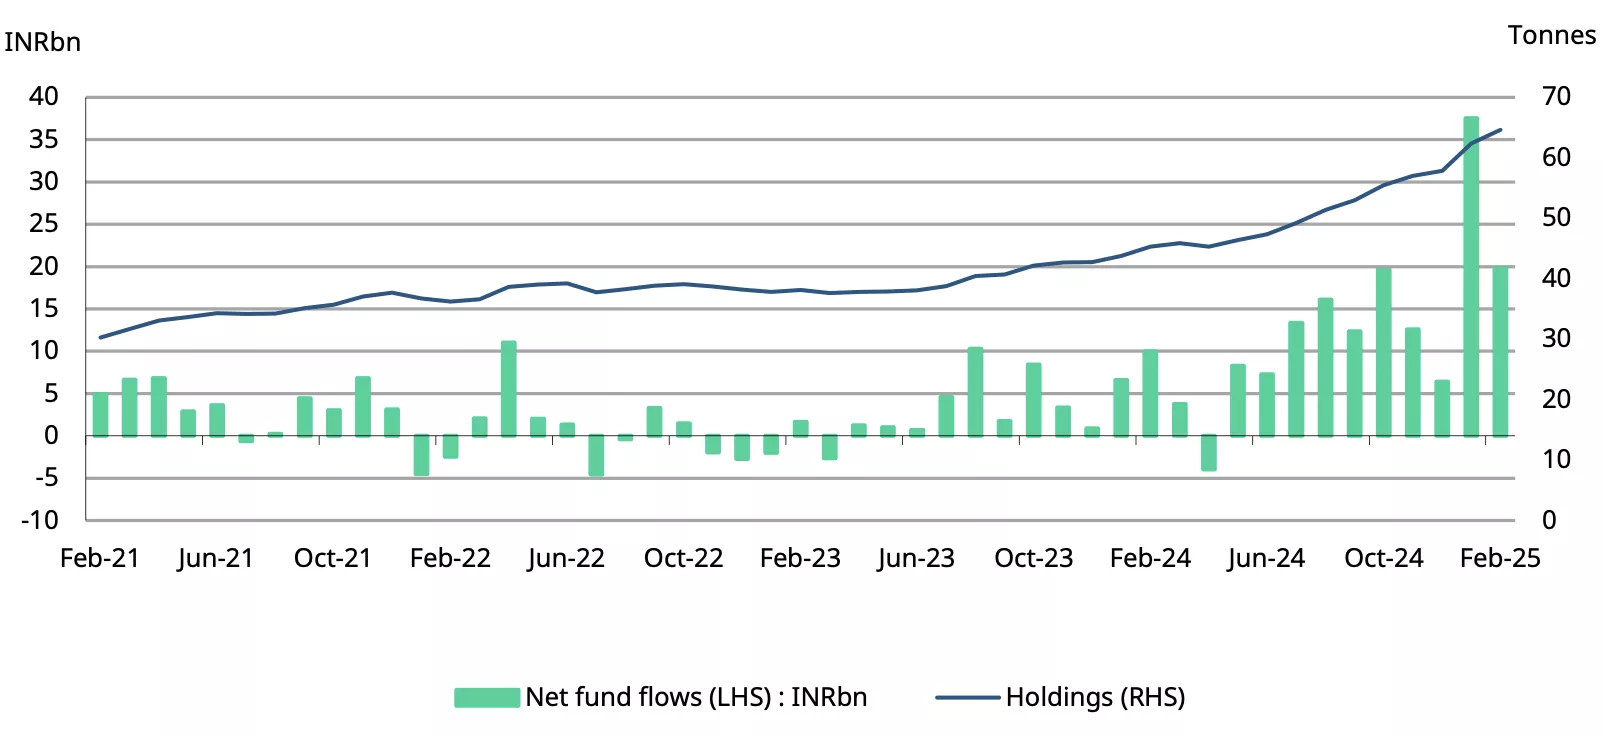
*As of end February 2025.
Source: AMFI, ICRA Analytics, CMIE, World Gold Council
RBI gold reserves stable, share of gold in forex reserves rising
The RBI held off buying gold in February, marking its second pause in three months, according to our estimates based on the bank’s weekly reporting of forex reserves. However, the bank has been increasing its gold holdings consistently since the beginning of 2024, purchasing an average of 6.3t in 12 of the last 14 months. While its gold reserves remained steady at 879t in February, the share of gold in total forex reserves rose to 11.5%,9 the highest on record and almost 4% higher than a year ago. This highlights the RBI’s continued diversification of its forex reserves.
Chart 4: RBI’s gold buying pauses twice in three months
RRBI’s net purchases and reserves, in tonnes*
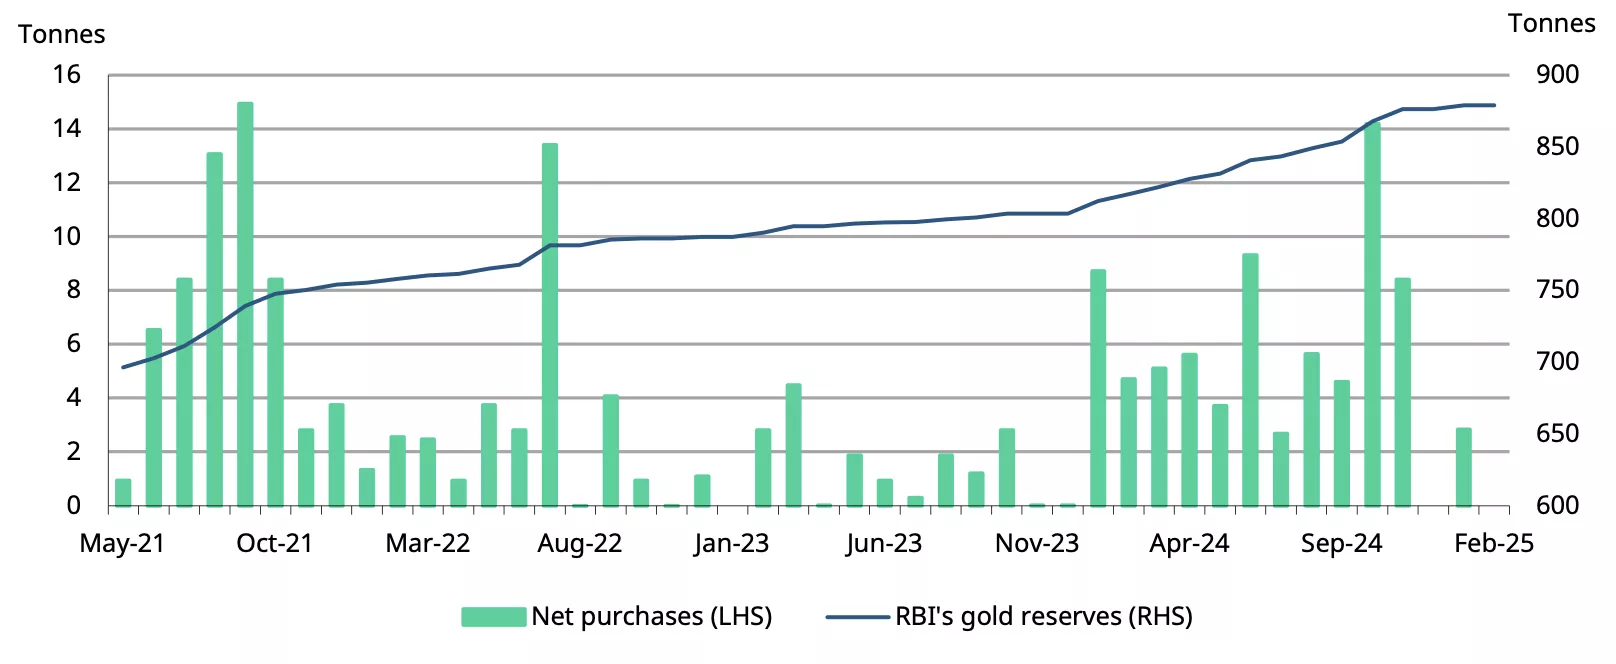
*Data as of 7 March 2025.
Source: RBI, World Gold Council
Gold imports decline further
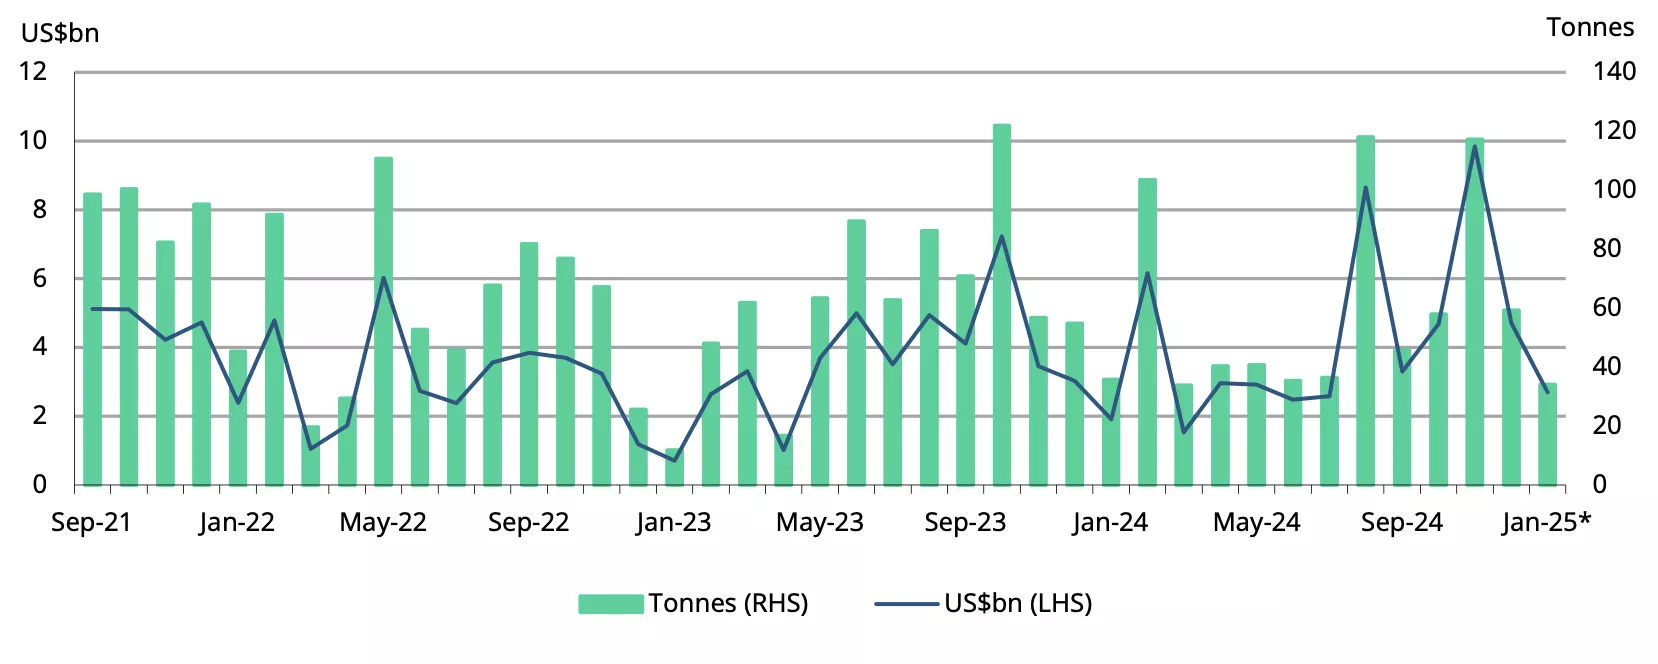
February gold imports fell to their lowest level since March 2024, marking the third consecutive month of decline and a steep drop from November's highs. This trend reflects the weak demand environment amid high prices. According to Ministry of Commerce data10 the gold import bill for February totalled $2.3bn – a 14% m/m and 63% y/y decline. We estimate that import volume in February ranged between 25t and 30t.
Chart 5: Downtrend in gold imports
Monthly gold imports in tonnes and US$bn*
*Includes World Gold Council estimates.
Source: Ministry of Commerce and Industry, CMIE, World Gold Council
Footnotes
1As of 14 March 2025.
2In the spot market on 14 and 17 March, 2025.
3As of 14 March 2025.
4Landed price of gold is the international price (LBMA gold price AM of 999 purity) adjusted for import taxes and exchange rate.
5The gold price is the MCX gold spot price for 995 purity.
6Our initial estimate based on partial information was US$220mn.
7Indian gold ETF inflows in January 2025 were INR 37.5bn/US$435mn.
8The daily AUM and NAV data published by AMFI covers 16 of the country’s 20 gold ETFs.
9As of end February 2025.
10Press release by the Ministry of Commerce on foreign trade, 17 March, 2025.
Disclaimer
Important information and disclaimers
© 2025 World Gold Council. All rights reserved. World Gold Council and the Circle device are trademarks of the World Gold Council or its affiliates.
All references to LBMA Gold Price are used with the permission of ICE Benchmark Administration Limited and have been provided for informational purposes only. ICE Benchmark Administration Limited accepts no liability or responsibility for the accuracy of the prices or the underlying product to which the prices may be referenced. Other content is the intellectual property of the respective third party and all rights are reserved to them.
Reproduction or redistribution of any of this information is expressly prohibited without the prior written consent of World Gold Council or the appropriate copyright owners, except as specifically provided below. Information and statistics are copyright © and/or other intellectual property of the World Gold Council or its affiliates or third-party providers identified herein. All rights of the respective owners are reserved.
The use of the statistics in this information is permitted for the purposes of review and commentary (including media commentary) in line with fair industry practice, subject to the following two pre-conditions: (i) only limited extracts of data or analysis be used; and (ii) any and all use of these statistics is accompanied by a citation to World Gold Council and, where appropriate, to Metals Focus or other identified copyright owners as their source. World Gold Council is affiliated with Metals Focus.
The World Gold Council and its affiliates do not guarantee the accuracy or completeness of any information nor accept responsibility for any losses or damages arising directly or indirectly from the use of this information.
This information is for educational purposes only and by receiving this information, you agree with its intended purpose. Nothing contained herein is intended to constitute a recommendation, investment advice, or offer for the purchase or sale of gold, any gold-related products or services or any other products, services, securities or financial instruments (collectively, “Services”). This information does not take into account any investment objectives, financial situation or particular needs of any particular person.
Diversification does not guarantee any investment returns and does not eliminate the risk of loss. Past performance is not necessarily indicative of future results. The resulting performance of any investment outcomes that can be generated through allocation to gold are hypothetical in nature, may not reflect actual investment results and are not guarantees of future results. The World Gold Council and its affiliates do not guarantee or warranty any calculations and models used in any hypothetical portfolios or any outcomes resulting from any such use. Investors should discuss their individual circumstances with their appropriate investment professionals before making any decision regarding any Services or investments.
This information may contain forward-looking statements, such as statements which use the words “believes”, “expects”, “may”, or “suggests”, or similar terminology, which are based on current expectations and are subject to change. Forward-looking statements involve a number of risks and uncertainties. There can be no assurance that any forward-looking statements will be achieved. World Gold Council and its affiliates assume no responsibility for updating any forward-looking statements.
Information regarding QaurumSM and the Gold Valuation Framework
Note that the resulting performance of various investment outcomes that can be generated through use of Qaurum, the Gold Valuation Framework and other information are hypothetical in nature, may not reflect actual investment results and are not guarantees of future results. Neither World Gold Council (including its affiliates) nor Oxford Economics provides any warranty or guarantee regarding the functionality of the tool, including without limitation any projections, estimates or calculations.
Weekly Markets Monitor: Gold claims US$3,000/oz
Weekly Markets Monitor
Highlights
- Last week was peppered with global central bank meetings, with four out of five opting to keep rates unchanged, citing growing economic and political uncertainty. The US Fed has penciled in two rate cuts this year while the BoJ has indicated further hikes.
- Global equity markets closed mostly higher. US stocks finally rebounded following weeks of declines and Europe equities also gained. Indian equities rose as investors bought dips while Chinese stock dropped. The 10-year US Treasury yields fell and the dollar rose as investors assessed the Fed’s future rate path and trade policy uncertainty.
- Gold finally closed above the US$3,000/oz threshold. It has so far rejected technical resistance at $3,040/3,050/oz and the market is seen as highly overstretched, with a possible (healthy) pause in the core uptrend on the cards.
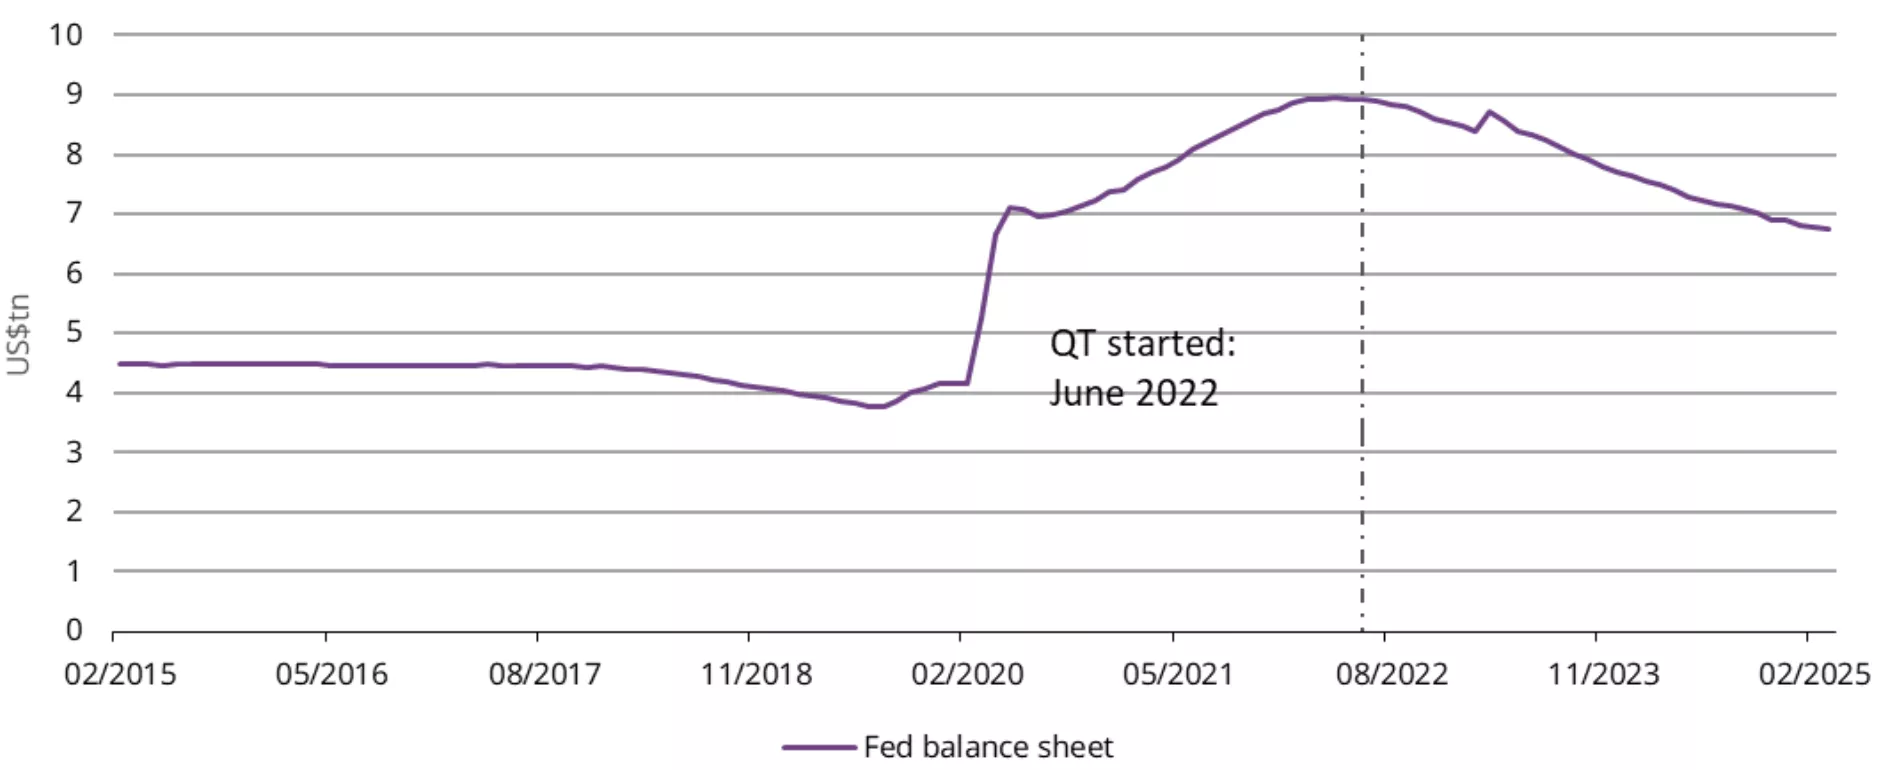
- After the Fed’s decision to slow their QT pace, markets have been adjusting their expectations. On Wall Street, while some institutions see the end arriving in Q3 2025, others forecast some time in 2026. And the Polymarket betters are much more aggressive as the crypto-based platform shows a 100% possibility of QT ending by this May.
Chart of the week – QT lifeline: running out of time?
Source: Bloomberg, World Gold Council
Disclaimer
Important information and disclaimers
© 2025 World Gold Council. All rights reserved. World Gold Council and the Circle device are trademarks of the World Gold Council or its affiliates.
All references to LBMA Gold Price are used with the permission of ICE Benchmark Administration Limited and have been provided for informational purposes only. ICE Benchmark Administration Limited accepts no liability or responsibility for the accuracy of the prices or the underlying product to which the prices may be referenced. Other content is the intellectual property of the respective third party and all rights are reserved to them.
Reproduction or redistribution of any of this information is expressly prohibited without the prior written consent of World Gold Council or the appropriate copyright owners, except as specifically provided below. Information and statistics are copyright © and/or other intellectual property of the World Gold Council or its affiliates or third-party providers identified herein. All rights of the respective owners are reserved.
The use of the statistics in this information is permitted for the purposes of review and commentary (including media commentary) in line with fair industry practice, subject to the following two pre-conditions: (i) only limited extracts of data or analysis be used; and (ii) any and all use of these statistics is accompanied by a citation to World Gold Council and, where appropriate, to Metals Focus or other identified copyright owners as their source. World Gold Council is affiliated with Metals Focus.
The World Gold Council and its affiliates do not guarantee the accuracy or completeness of any information nor accept responsibility for any losses or damages arising directly or indirectly from the use of this information.
This information is for educational purposes only and by receiving this information, you agree with its intended purpose. Nothing contained herein is intended to constitute a recommendation, investment advice, or offer for the purchase or sale of gold, any gold-related products or services or any other products, services, securities or financial instruments (collectively, “Services”). This information does not take into account any investment objectives, financial situation or particular needs of any particular person.
Diversification does not guarantee any investment returns and does not eliminate the risk of loss. Past performance is not necessarily indicative of future results. The resulting performance of any investment outcomes that can be generated through allocation to gold are hypothetical in nature, may not reflect actual investment results and are not guarantees of future results. The World Gold Council and its affiliates do not guarantee or warranty any calculations and models used in any hypothetical portfolios or any outcomes resulting from any such use. Investors should discuss their individual circumstances with their appropriate investment professionals before making any decision regarding any Services or investments.
This information may contain forward-looking statements, such as statements which use the words “believes”, “expects”, “may”, or “suggests”, or similar terminology, which are based on current expectations and are subject to change. Forward-looking statements involve a number of risks and uncertainties. There can be no assurance that any forward-looking statements will be achieved. World Gold Council and its affiliates assume no responsibility for updating any forward-looking statements.
Information regarding QaurumSM and the Gold Valuation Framework
Note that the resulting performance of various investment outcomes that can be generated through use of Qaurum, the Gold Valuation Framework and other information are hypothetical in nature, may not reflect actual investment results and are not guarantees of future results. Neither World Gold Council (including its affiliates) nor Oxford Economics provides any warranty or guarantee regarding the functionality of the tool, including without limitation any projections, estimates or calculations.
Get updates in your inbox
Make sure you are subscribed
Get email updates
Weekly Markets Monitor: Liberation Day & Stagflation
Weekly Markets Monitor
Highlights
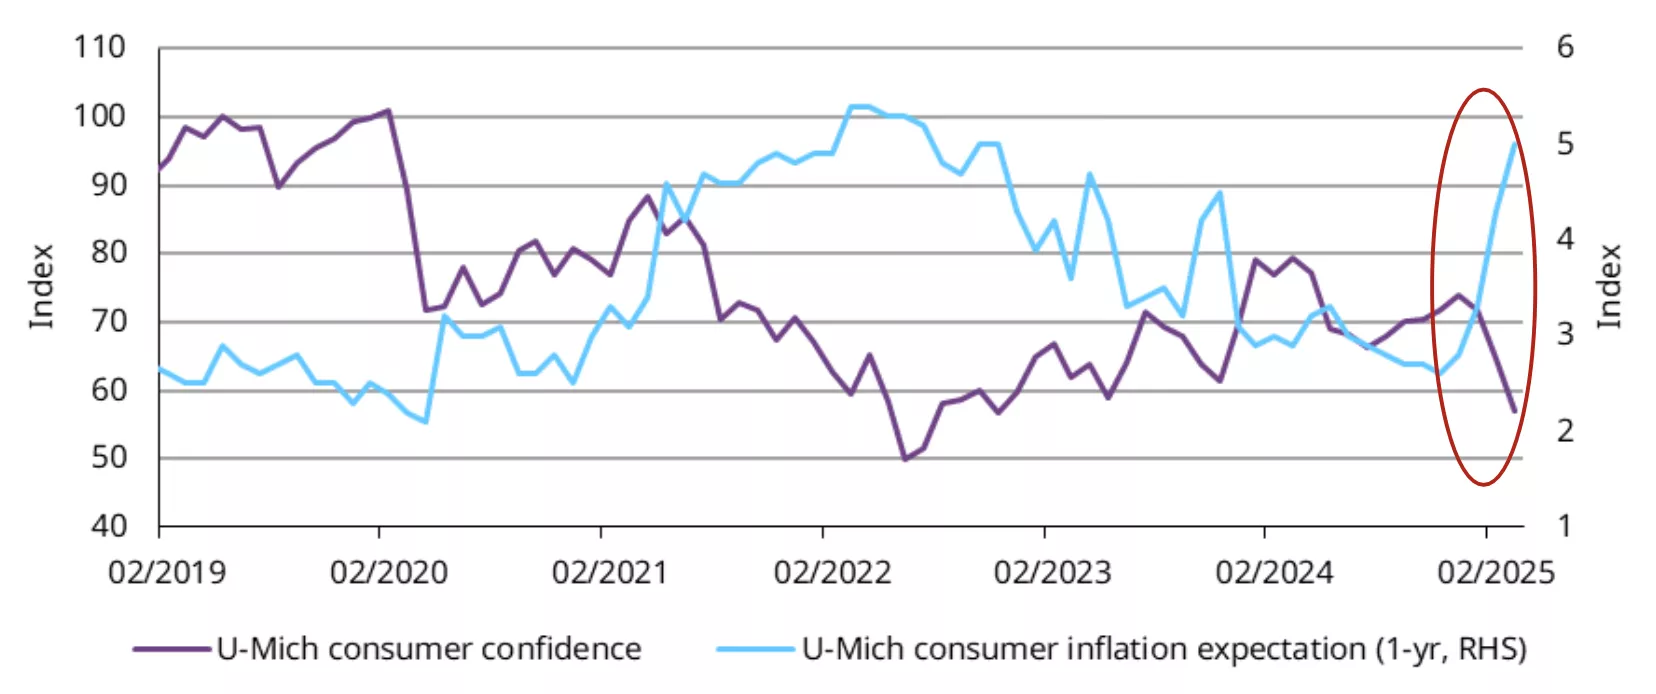
- Markets focused on trade tensions last week, as a new 25% US auto import tariff and upcoming retaliatory tariffs weighed on sentiment. Stagflation worries added to the pressure. US, Japan and UK data surprises are in stagflation territory
- Global stocks fell this week, erasing earlier gains, after the US announced new tariffs. US Treasury yields held steady, while the dollar slipped on growth concerns ahead of April 2 tariff plans. Oil rose over supply fears linked to US tensions with Venezuela and Iran
- Gold (XAU) rose above $3,100/oz in Asian trading Monday, maintaining its strong upward trend despite overbought signals
- Stagflation fears abound on higher core PCE inflation and lower spending and consumer confidence, pushing stocks down and gold up – as we have seen in the past.
Chart of the week – Stagflation signs clearer
Source: Bloomberg, World Gold Council
Disclaimer
Important information and disclaimers
© 2025 World Gold Council. All rights reserved. World Gold Council and the Circle device are trademarks of the World Gold Council or its affiliates.
All references to LBMA Gold Price are used with the permission of ICE Benchmark Administration Limited and have been provided for informational purposes only. ICE Benchmark Administration Limited accepts no liability or responsibility for the accuracy of the prices or the underlying product to which the prices may be referenced. Other content is the intellectual property of the respective third party and all rights are reserved to them.
Reproduction or redistribution of any of this information is expressly prohibited without the prior written consent of World Gold Council or the appropriate copyright owners, except as specifically provided below. Information and statistics are copyright © and/or other intellectual property of the World Gold Council or its affiliates or third-party providers identified herein. All rights of the respective owners are reserved.
The use of the statistics in this information is permitted for the purposes of review and commentary (including media commentary) in line with fair industry practice, subject to the following two pre-conditions: (i) only limited extracts of data or analysis be used; and (ii) any and all use of these statistics is accompanied by a citation to World Gold Council and, where appropriate, to Metals Focus or other identified copyright owners as their source. World Gold Council is affiliated with Metals Focus.
The World Gold Council and its affiliates do not guarantee the accuracy or completeness of any information nor accept responsibility for any losses or damages arising directly or indirectly from the use of this information.
This information is for educational purposes only and by receiving this information, you agree with its intended purpose. Nothing contained herein is intended to constitute a recommendation, investment advice, or offer for the purchase or sale of gold, any gold-related products or services or any other products, services, securities or financial instruments (collectively, “Services”). This information does not take into account any investment objectives, financial situation or particular needs of any particular person.
Diversification does not guarantee any investment returns and does not eliminate the risk of loss. Past performance is not necessarily indicative of future results. The resulting performance of any investment outcomes that can be generated through allocation to gold are hypothetical in nature, may not reflect actual investment results and are not guarantees of future results. The World Gold Council and its affiliates do not guarantee or warranty any calculations and models used in any hypothetical portfolios or any outcomes resulting from any such use. Investors should discuss their individual circumstances with their appropriate investment professionals before making any decision regarding any Services or investments.
This information may contain forward-looking statements, such as statements which use the words “believes”, “expects”, “may”, or “suggests”, or similar terminology, which are based on current expectations and are subject to change. Forward-looking statements involve a number of risks and uncertainties. There can be no assurance that any forward-looking statements will be achieved. World Gold Council and its affiliates assume no responsibility for updating any forward-looking statements.
Information regarding QaurumSM and the Gold Valuation Framework
Note that the resulting performance of various investment outcomes that can be generated through use of Qaurum, the Gold Valuation Framework and other information are hypothetical in nature, may not reflect actual investment results and are not guarantees of future results. Neither World Gold Council (including its affiliates) nor Oxford Economics provides any warranty or guarantee regarding the functionality of the tool, including without limitation any projections, estimates or calculations.
Get updates in your inbox
Get email updates
Weekly Markets Monitor: Tariffs Spare no Land
Weekly Markets Monitor
Highlights
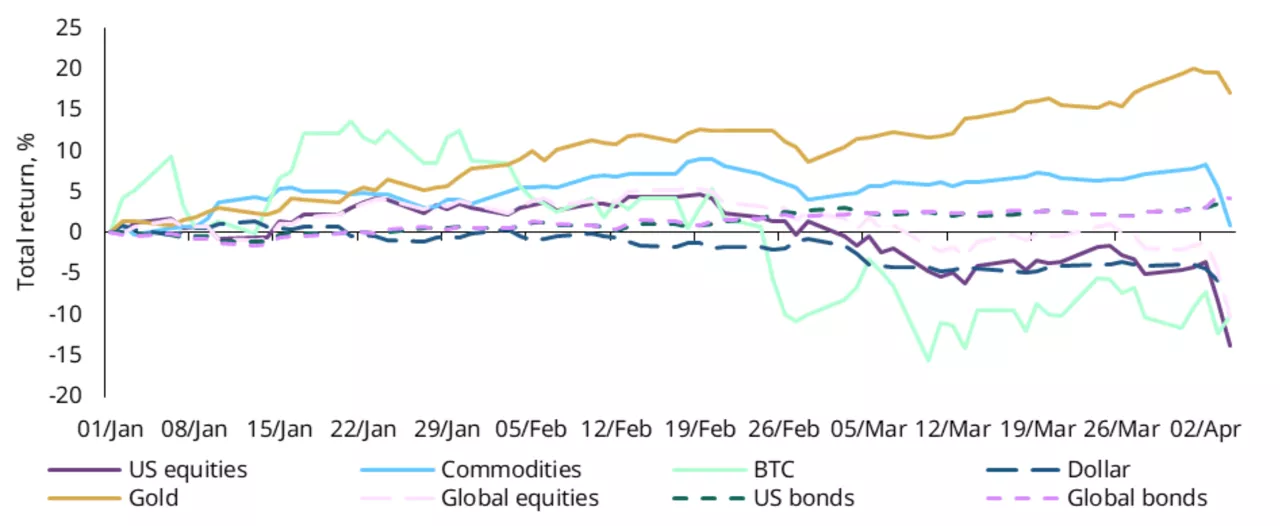
- Last week, the US rattled global markets with unexpectedly aggressive reciprocal tariffs, prompting swift retaliation from China and potential countermeasures from others. The aggressive moves raised fears of slower growth, higher inflation, and job losses, overshadowing otherwise positive economic data.
- Tariffs roiled markets, triggering a wave of risk-off sentiment that led to sharp declines in global equities and falling bond yields, as investors sought safe-haven assets. Surprising to some, the US dollar weakened, and oil prices fell after OPEC+’s unexpected output hike.
- Amidst the massive sell-off, gold was steady – the ballast during turmoil as always – although possible liquidations to meet margin calls weighed on gold. Nonetheless, gold remains a top performer with a stunning 17% y-t-d gain.
Chart of the week – The cost of winning
Source: Bloomberg, World Gold Council
Note: Cumulative daily returns of MSCI USA Index, Bloomberg Commodity index, Bloomberg Bitcoin Index, Bloomberg US Dollar Index, LBMA Gold Price PM,
MSCI World Index, Bloomberg US Agg Index and Bloomberg Global Agg Index.
Disclaimer
Important information and disclaimers
© 2025 World Gold Council. All rights reserved. World Gold Council and the Circle device are trademarks of the World Gold Council or its affiliates.
All references to LBMA Gold Price are used with the permission of ICE Benchmark Administration Limited and have been provided for informational purposes only. ICE Benchmark Administration Limited accepts no liability or responsibility for the accuracy of the prices or the underlying product to which the prices may be referenced. Other content is the intellectual property of the respective third party and all rights are reserved to them.
Reproduction or redistribution of any of this information is expressly prohibited without the prior written consent of World Gold Council or the appropriate copyright owners, except as specifically provided below. Information and statistics are copyright © and/or other intellectual property of the World Gold Council or its affiliates or third-party providers identified herein. All rights of the respective owners are reserved.
The use of the statistics in this information is permitted for the purposes of review and commentary (including media commentary) in line with fair industry practice, subject to the following two pre-conditions: (i) only limited extracts of data or analysis be used; and (ii) any and all use of these statistics is accompanied by a citation to World Gold Council and, where appropriate, to Metals Focus or other identified copyright owners as their source. World Gold Council is affiliated with Metals Focus.
The World Gold Council and its affiliates do not guarantee the accuracy or completeness of any information nor accept responsibility for any losses or damages arising directly or indirectly from the use of this information.
This information is for educational purposes only and by receiving this information, you agree with its intended purpose. Nothing contained herein is intended to constitute a recommendation, investment advice, or offer for the purchase or sale of gold, any gold-related products or services or any other products, services, securities or financial instruments (collectively, “Services”). This information does not take into account any investment objectives, financial situation or particular needs of any particular person.
Diversification does not guarantee any investment returns and does not eliminate the risk of loss. Past performance is not necessarily indicative of future results. The resulting performance of any investment outcomes that can be generated through allocation to gold are hypothetical in nature, may not reflect actual investment results and are not guarantees of future results. The World Gold Council and its affiliates do not guarantee or warranty any calculations and models used in any hypothetical portfolios or any outcomes resulting from any such use. Investors should discuss their individual circumstances with their appropriate investment professionals before making any decision regarding any Services or investments.
This information may contain forward-looking statements, such as statements which use the words “believes”, “expects”, “may”, or “suggests”, or similar terminology, which are based on current expectations and are subject to change. Forward-looking statements involve a number of risks and uncertainties. There can be no assurance that any forward-looking statements will be achieved. World Gold Council and its affiliates assume no responsibility for updating any forward-looking statements.
Information regarding QaurumSM and the Gold Valuation Framework
Note that the resulting performance of various investment outcomes that can be generated through use of Qaurum, the Gold Valuation Framework and other information are hypothetical in nature, may not reflect actual investment results and are not guarantees of future results. Neither World Gold Council (including its affiliates) nor Oxford Economics provides any warranty or guarantee regarding the functionality of the tool, including without limitation any projections, estimates or calculations.
Get updates in your inbox
Get email updates
Weekly Markets Monitor: Gold above US$3,200/oz
Weekly Markets Monitor
Highlights
- Trade tensions steered sentiment last week. Trump's temporary tariff relief boosted optimism, but mixed economic data and lingering trade uncertainty kept volatility elevated. Growth concerns prompted central banks in India, New Zealand, and the Philippines to cut.
- Global stocks rebounded after the tariff pause, with US shares getting an extra boost from strong bank earnings. Treasury yields spiked and the dollar fell. And oil broke lower from its range.
- Gold jumped above the US$3,200/oz, setting another record despite the sharp rise in yields. The strong trend remains intact with key technical resistance at $3,350.
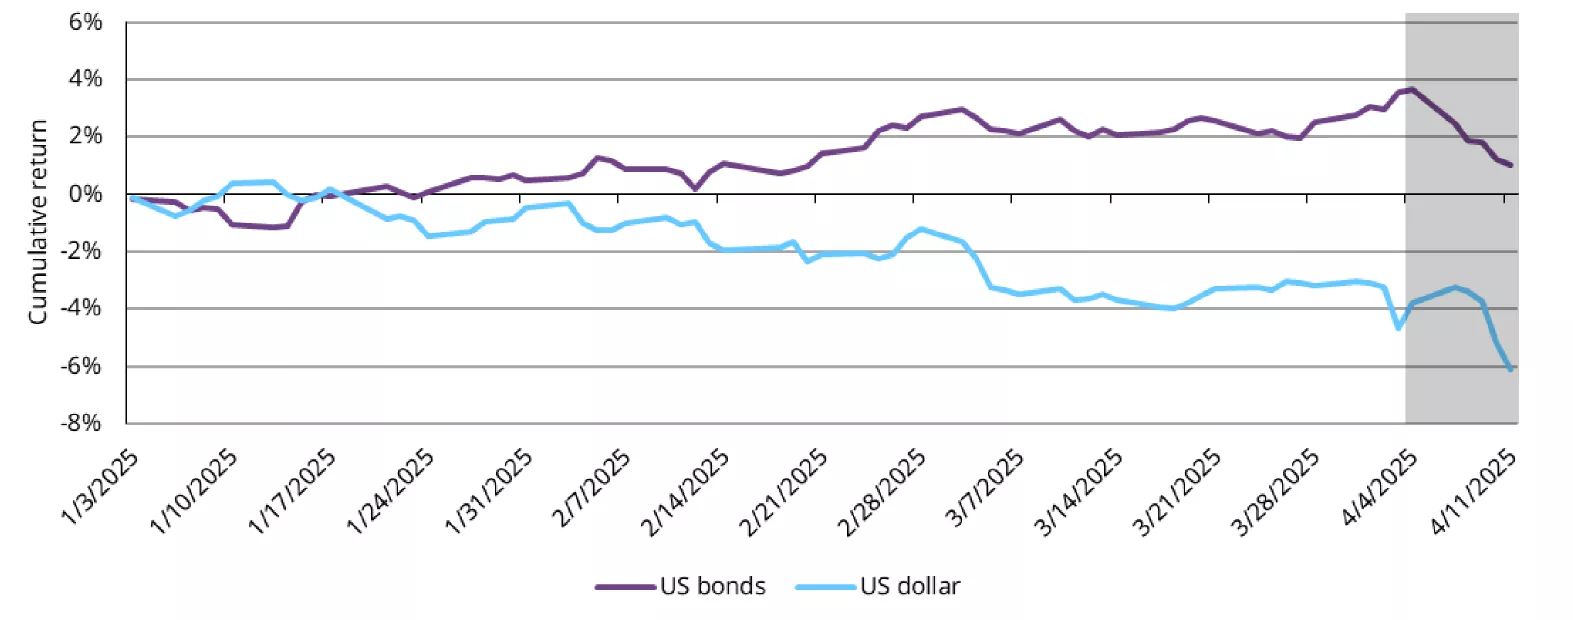
- Erratic tariff moves from the Trump administration exposed US assets to an increasing loss of confidence. A fire sale of US Treasuries saw the biggest weekly yield surge in decades alongside a continued decline in the US dollar.
Chart of the week – Selling the US
Source: Bloomberg, World Gold Council
Note: cumulative daily returns of Bloomberg US Dollar Index and Bloomberg US Agg Index.
Disclaimer
Important information and disclaimers
© 2025 World Gold Council. All rights reserved. World Gold Council and the Circle device are trademarks of the World Gold Council or its affiliates.
All references to LBMA Gold Price are used with the permission of ICE Benchmark Administration Limited and have been provided for informational purposes only. ICE Benchmark Administration Limited accepts no liability or responsibility for the accuracy of the prices or the underlying product to which the prices may be referenced. Other content is the intellectual property of the respective third party and all rights are reserved to them.
Reproduction or redistribution of any of this information is expressly prohibited without the prior written consent of World Gold Council or the appropriate copyright owners, except as specifically provided below. Information and statistics are copyright © and/or other intellectual property of the World Gold Council or its affiliates or third-party providers identified herein. All rights of the respective owners are reserved.
The use of the statistics in this information is permitted for the purposes of review and commentary (including media commentary) in line with fair industry practice, subject to the following two pre-conditions: (i) only limited extracts of data or analysis be used; and (ii) any and all use of these statistics is accompanied by a citation to World Gold Council and, where appropriate, to Metals Focus or other identified copyright owners as their source. World Gold Council is affiliated with Metals Focus.
The World Gold Council and its affiliates do not guarantee the accuracy or completeness of any information nor accept responsibility for any losses or damages arising directly or indirectly from the use of this information.
This information is for educational purposes only and by receiving this information, you agree with its intended purpose. Nothing contained herein is intended to constitute a recommendation, investment advice, or offer for the purchase or sale of gold, any gold-related products or services or any other products, services, securities or financial instruments (collectively, “Services”). This information does not take into account any investment objectives, financial situation or particular needs of any particular person.
Diversification does not guarantee any investment returns and does not eliminate the risk of loss. Past performance is not necessarily indicative of future results. The resulting performance of any investment outcomes that can be generated through allocation to gold are hypothetical in nature, may not reflect actual investment results and are not guarantees of future results. The World Gold Council and its affiliates do not guarantee or warranty any calculations and models used in any hypothetical portfolios or any outcomes resulting from any such use. Investors should discuss their individual circumstances with their appropriate investment professionals before making any decision regarding any Services or investments.
This information may contain forward-looking statements, such as statements which use the words “believes”, “expects”, “may”, or “suggests”, or similar terminology, which are based on current expectations and are subject to change. Forward-looking statements involve a number of risks and uncertainties. There can be no assurance that any forward-looking statements will be achieved. World Gold Council and its affiliates assume no responsibility for updating any forward-looking statements.
Information regarding QaurumSM and the Gold Valuation Framework
Note that the resulting performance of various investment outcomes that can be generated through use of Qaurum, the Gold Valuation Framework and other information are hypothetical in nature, may not reflect actual investment results and are not guarantees of future results. Neither World Gold Council (including its affiliates) nor Oxford Economics provides any warranty or guarantee regarding the functionality of the tool, including without limitation any projections, estimates or calculations.
