China’s gold market update: Investment boom continues in March
Ray Jia
Head of Research (Asia Pacific, ex-India) and Deputy Head of Trade Engagement (China) World Gold CouncilHighlights
- March was another exceptional month for gold: the Shanghai Benchmark Gold Price PM and the LBMA Gold Price PM surged by 8.4% and 9.9% respectively, both concluding Q1 with performances unprecedented in decades
- Gold withdrawals from the Shanghai Gold Exchange (SGE) rebounded following the holiday slowdown in February; this, combined with strong investment, likely boosted the local gold price premium in March; however, Q1 wholesale gold demand fell 36% y/y amid January and February weakness
- Chinese gold ETFs attracted RMB5.6bn (US$772mn) in March, pushing total assets under management (AUM) to RMB101bn (US$14bn) and holdings 7.7t higher to 138t; Q1 inflows reached a record high
- The People’s Bank of China (PBoC) has been adding gold to its reserves for five consecutive months: March saw a 2.8t reported addition to China’s official gold holdings and Q1 ended with a net gain of 12.8t
- Gold imports during the first two months of 2025 were tepid on weak demand and local price discounts during the period.
Looking ahead
- Gold investment demand should stay strong in the short term, as the escalating US-China trade war hurts growth and local assets. The global gold price strength, boosted by a re-structuring of the world trade order and world market volatility, will provide further support
- Subsequent to policy changes Chinese insurers have entered the gold market: four companies became SGE members on 24 March and executed their first trades of SGE gold contracts the following day. Their participation should sustain long-term investment demand for gold in China, especially amid ongoing economic and trade uncertainties
- Despite the upcoming May Labour Day holiday sales boost, record high gold prices and economic worries are clouding the jewellery demand outlook – though safe-haven buying may offer a cushion.
Our Gold Demand Trends Q1 2025 report launches on 30 April, with an in-depth analysis and outlook on gold demand across key markets. Stay tuned!
Another month, another record high
Gold’s rally continued in March (Chart 1). The SHAUPM in RMB saw its strongest month for a year while the March return of the LBMA Gold Price PM in USD reached its highest since July 2020. Geopolitical tensions and Trump's unpredictable trade policies increased gold's appeal as a safe-haven asset. A weaker dollar and higher gold ETF investments pushed up prices further.
Chart 1: Gold prices showed continued strength in March
Monthly returns of the SHAUPM in RMB and the LBMA Gold Price PM in USD*
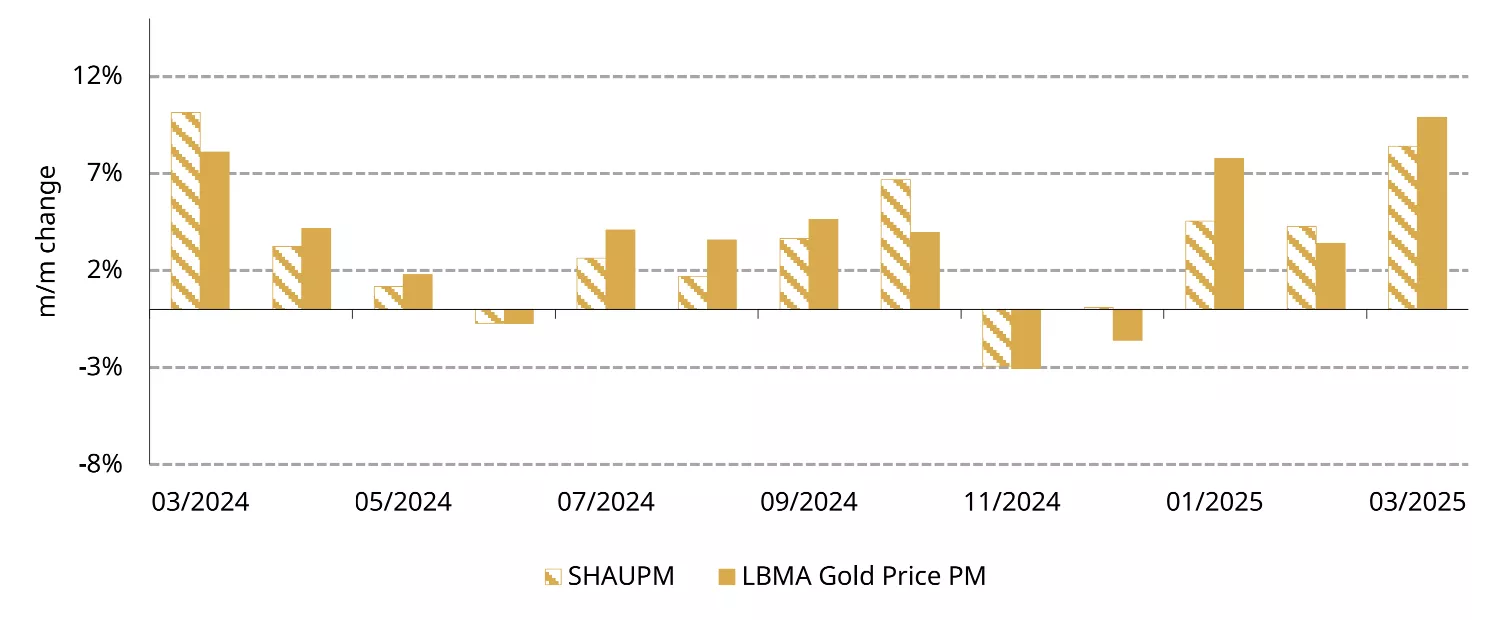
*February return based on prices between 27 January – the last trading day before the CNY holiday – and 28 February 2025 to account for holiday impact.
Source: Bloomberg, World Gold Council
March ended Q1 on a strong note with both RMB and USD gold prices jumping 19% (Chart 2). The RMB gold price recorded its strongest Q1 since 2002 – when the SGE was established – and the USD price posted its best Q1 return since 1975. Key drivers included:
- The rising safe-haven demand amid global geopolitical and trade policy risks
- A weaker dollar on concerns around US growth and shifting expectations of the Fed’s future cuts
- Strong momentum as global gold ETFs attracted notable inflows.
Chart 2: Record Q1 gold price strength
Q1 returns of the Au9999 in RMB and the LBMA Gold Price PM in USD*
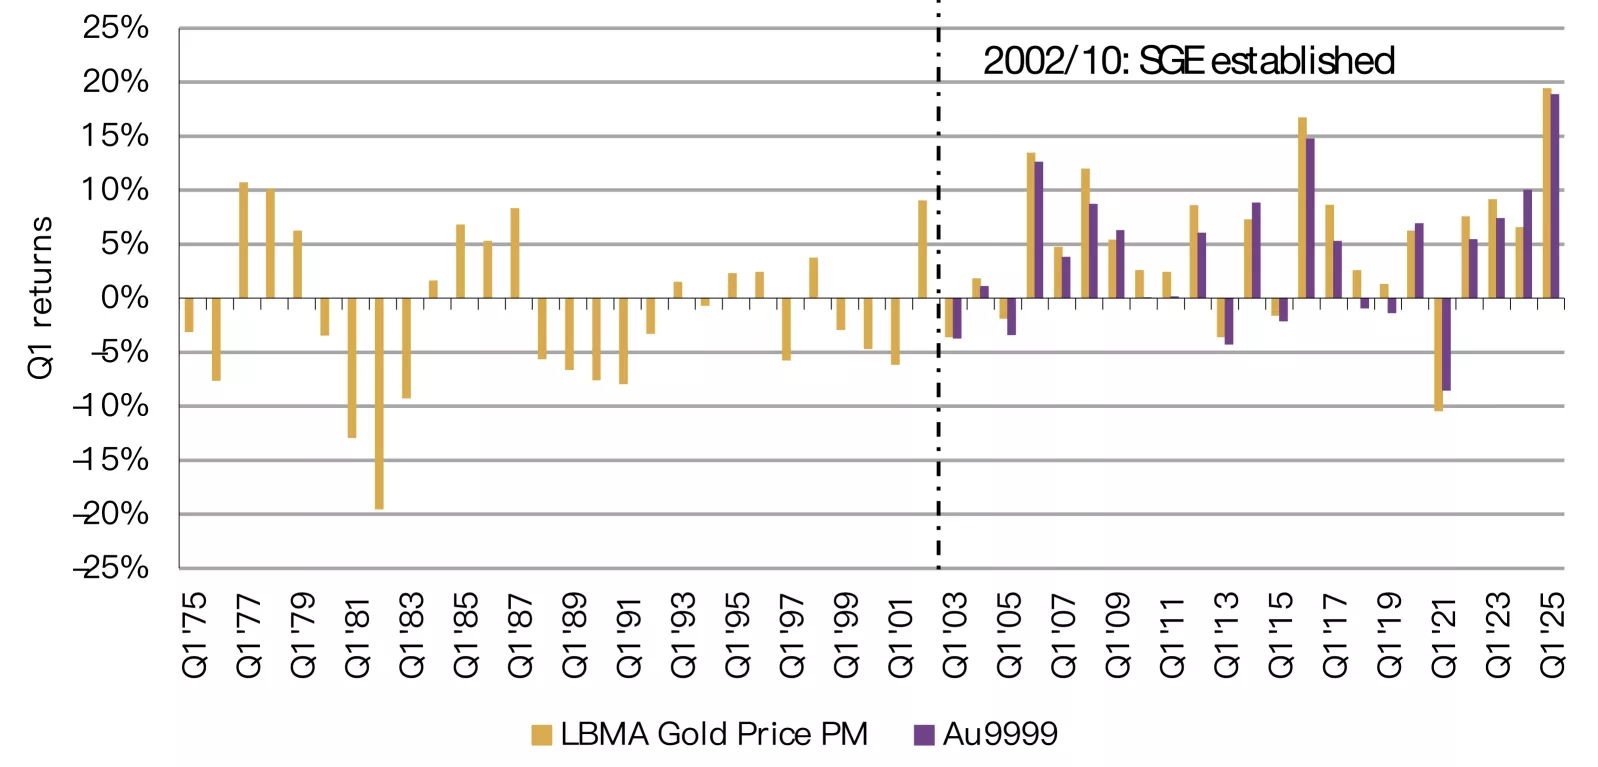
*We use AU9999 gold price in RMB here as it has a longer history than SHAUPM.
Source: Bloomberg, World Gold Council
Wholesale demand weakened in Q1 despite a m/m rebound in March
Gold withdrawals from the SGE totalled 120t in March, up 30t m/m but slightly lower y/y. The m/m rebound came as jewellers and banks restocked after the Chinese New Year holiday slowdown – a seasonal pattern. Continued strength in investment demand for gold may also have provided a boost. We believe a pickup in wholesale gold demand resulted in the improving local gold price premium in March (US$4.3/oz on average vs a US$1.5/oz discount in February).
Chinese wholesale gold demand totalled 336t in Q1, 29% below the ten-year average and a 36% fall y/y (Chart 3). We believe this weakness can be mainly attributed to:
- A high base – 2024 witnessed the strongest January wholesale demand on record
- A surging gold price – the record-shattering gold price hampered gold jewellery demand, a major factor in SGE gold withdrawals, although it did boost gold investment.
Chart 3: Wholesale demand weakened notably in Q1 despite a rebound in March
Gold withdrawals from the SGE*
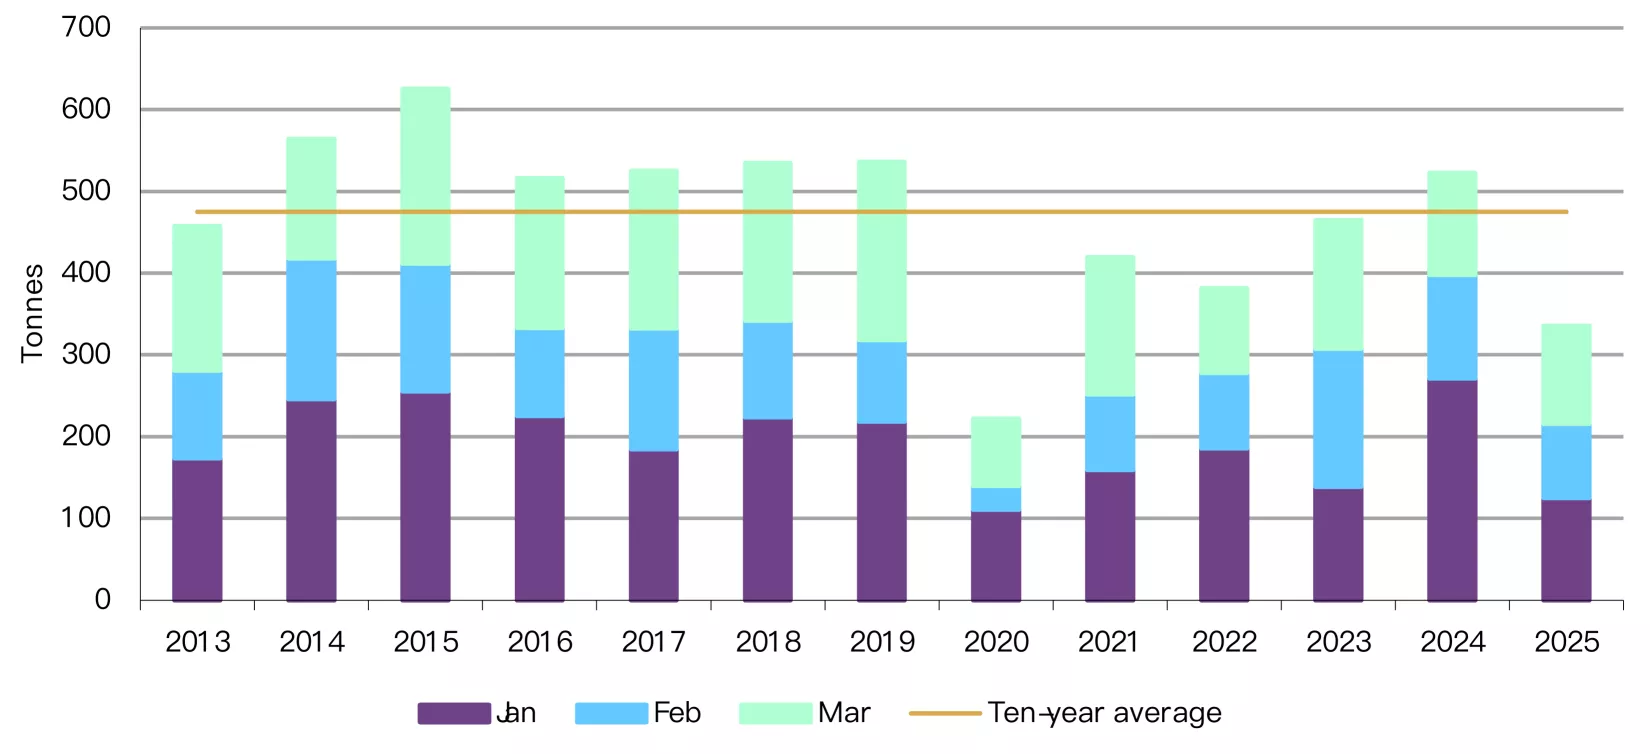
*As of Q1 2025. 10-year average based on Q1 totals between 2015 and 2024.
Source: Shanghai Gold Exchange, World Gold Council
Chinese investors continue to buy gold ETFs at a robust pace
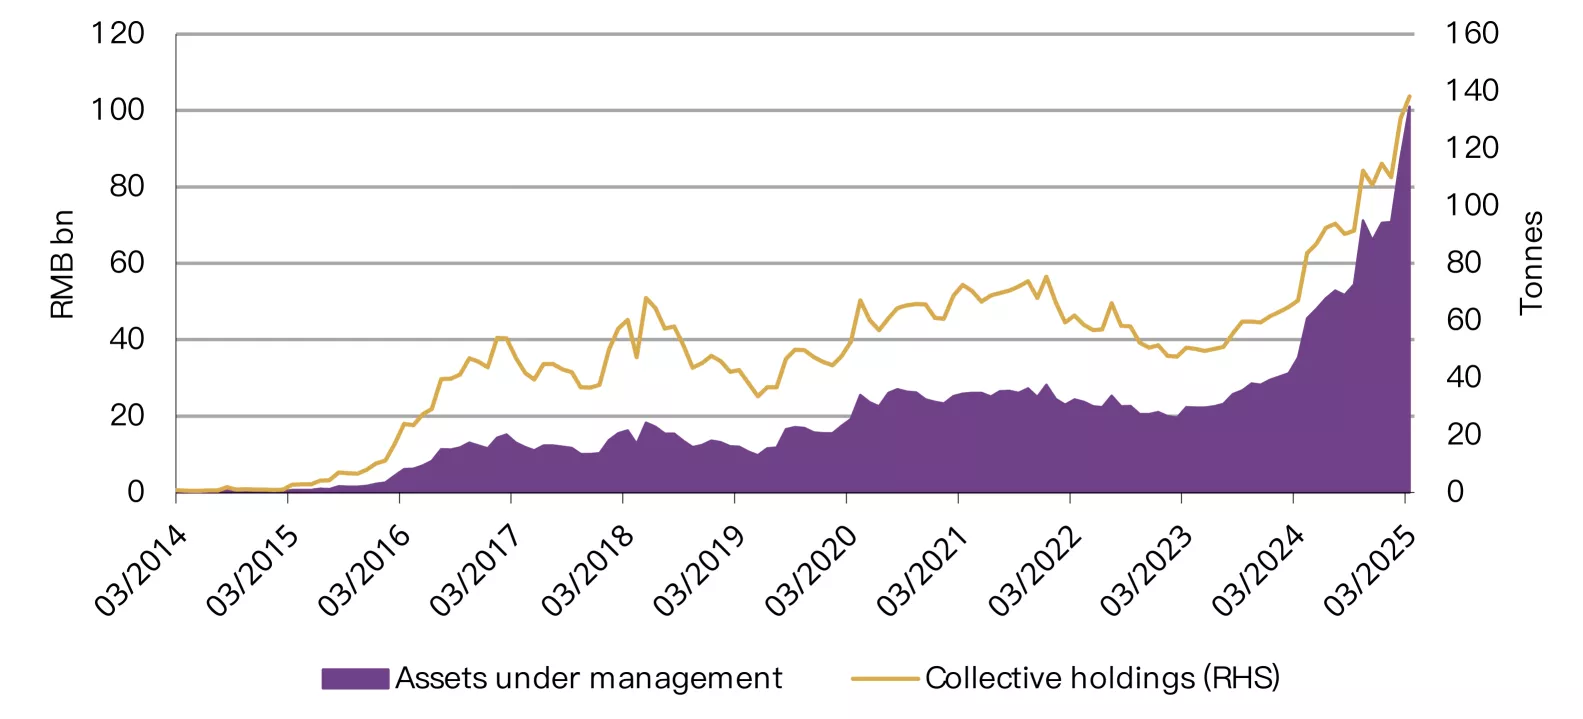
Inflows into Chinese gold ETFs sustained for a second month, totalling RMB5.6bn (US$772mn) in March. Continued inflows and the surging gold price pushed the total AUM to another month-end peak of RMB101bn (US$14bn). Collective holdings rose further by 7.7t to 138t, also a record high (Chart 4). The soaring gold price remained a key driver for healthy Chinese gold ETF inflows during March, while global trade uncertainties and concerns around their impact on the local economy provided an additional boost.
Chart 4: AUM of Chinese gold ETFs continued to grow
Collective holdings and AUM of Chinese gold ETFs*
*As of 31 March 2025.
Source: Company filings, World Gold Council
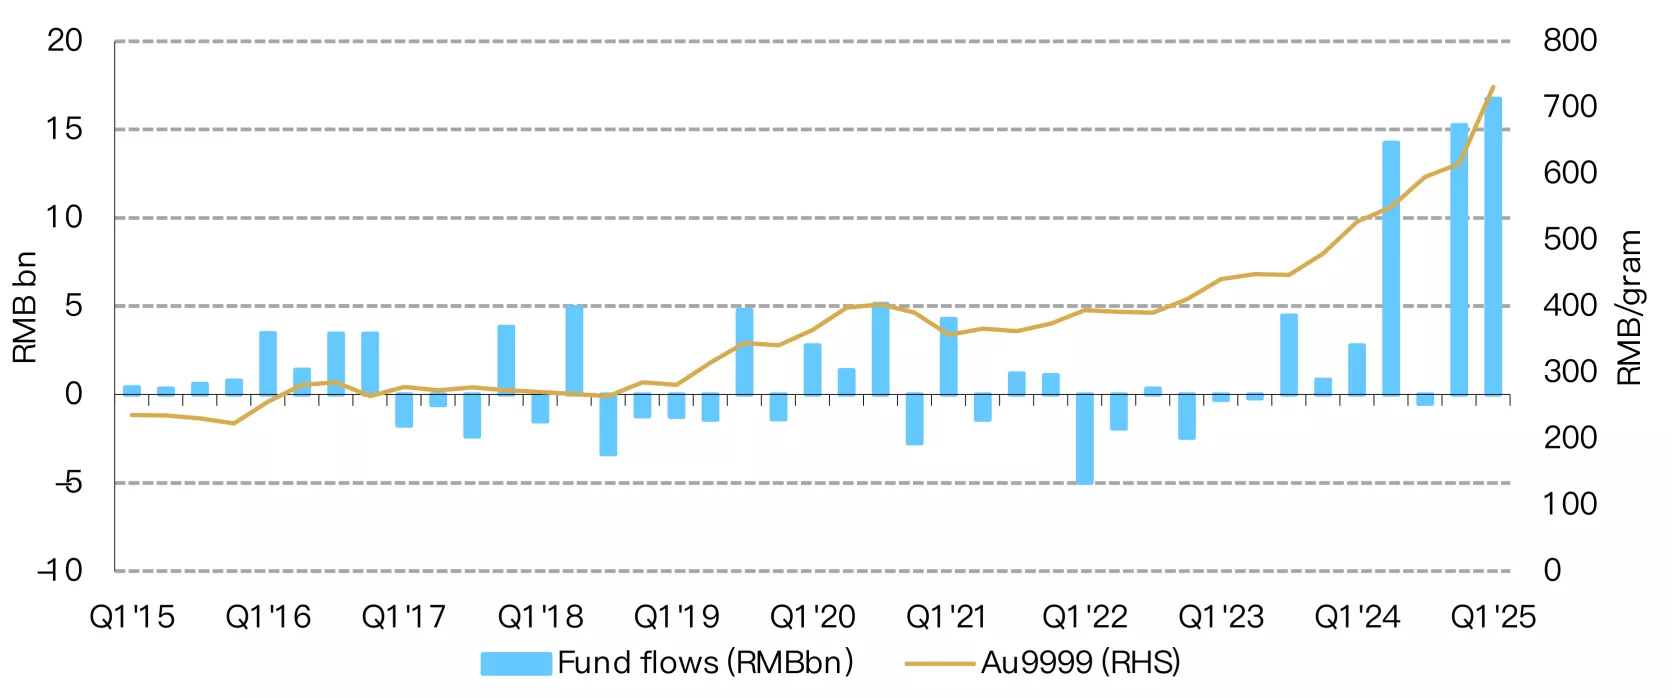
Strong demand in February and March led to a record quarter for Chinese gold ETF inflows (Chart 5). The first quarter of 2025 saw inflows of RMB16.7bn (US$2.3bn), equivalent to a 23t increase in holdings – both reaching record levels. The unprecedented gold price surge, shaky confidence in other domestic assets, as well as growth concerns stemming from escalating trade conflicts with the US, all contributed to strong Q1 flows.
And it is worth noting that record inflows continued into Q2. During the first two weeks of April, Chinese gold ETFs’ collective holdings surged another 29t whilst total AUM rocketed 25% on sustained gold price strength and escalating trade tensions with the US.
Chart 5: Unseen price strength brings in unprecedented Q1 inflows
Quarterly RMB gold price performance and Chinese gold ETF inflows*
*As of 31 March 2025.
Source: Shanghai Gold Exchange, ETF providers, World Gold Council
China’s gold reserves rose further in March
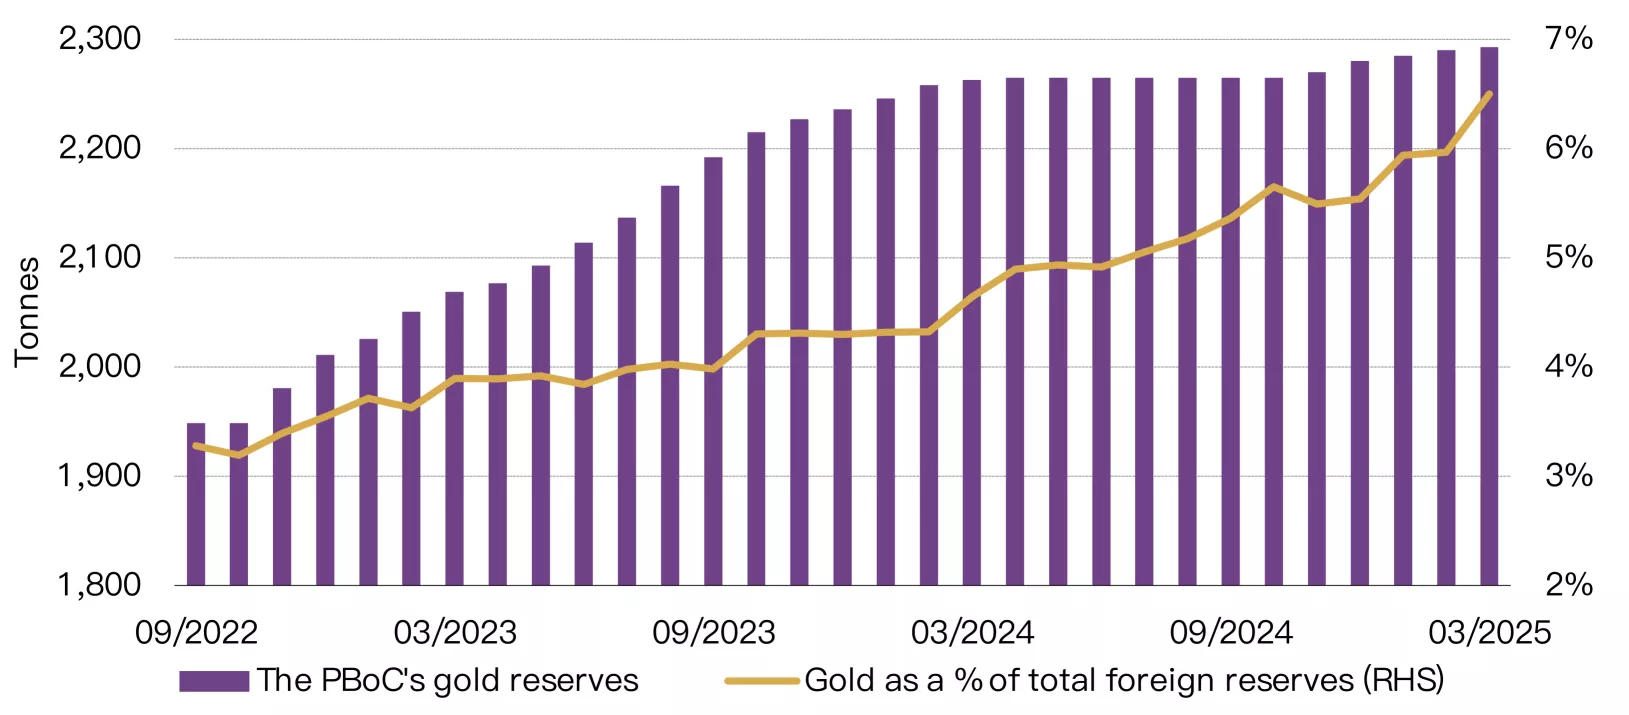
The PBoC has announced gold purchases in each of the past five months, and in March, added a further 2.8t (Chart 6). This pushes China’s official gold holdings to 2,292t, or 6.5% of total reserves. During Q1 2025 China reported purchases of 12.8t of gold.
Chart 6: China’s official gold reserves expand for five months in a row
Reported official gold holdings and gold as a percentage of total foreign exchange reserves*
*As of 31 March 2025.
Source: Administration of Foreign Exchange, World Gold Council
Over the course of Q1 China’s total reserves rose by 2.3% to US$3.5tn, supported mainly by:
- A weaker dollar, which pushed up USD denominated assets
- Falling US yields, which lifted bond values
- Rising gold holdings and a surging gold price, which surged 20% to US$230bn and contributed over 1% to the quarterly increase in total reserves.
Imports remained tepid at the start of 2025
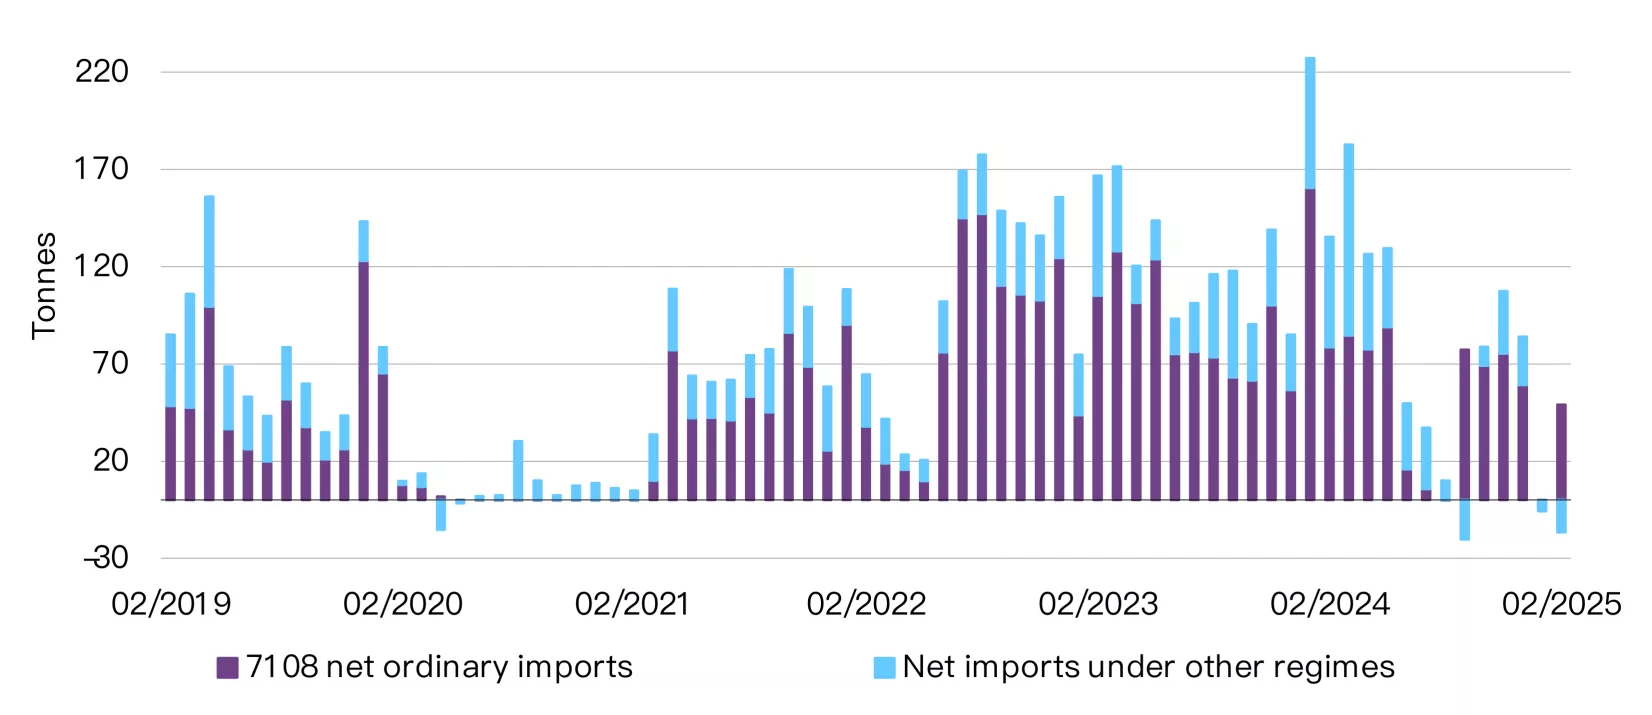
Gold imports into China virtually came to a halt in January, amounting to just 17t, the lowest monthly value since February 2021 – at which time imports were hampered by COVID restrictions. February imports picked up, rising to 76t. Nonetheless, they remained well below the 2024 monthly average of 102t.
And the weakness is more obvious on a netting basis. Net ordinary imports fell to zero in January, the lowest since early 2021; they rebounded to 49t in February, yet still represented a 38% y/y plunge. We believe fewer working days due to the Chinese New Year’s holiday, weak domestic gold demand and local gold price discounts during most of the period – which discouraged importers – were the main drivers.
Chart 7: Imports lowered notably at the start of 2025
7108 gold imports under various regimes*
*Based on the latest data available.
Source: China Customs, World Gold Council
Disclaimer
Important information and disclaimers
© 2025 World Gold Council. All rights reserved. World Gold Council and the Circle device are trademarks of the World Gold Council or its affiliates.
All references to LBMA Gold Price are used with the permission of ICE Benchmark Administration Limited and have been provided for informational purposes only. ICE Benchmark Administration Limited accepts no liability or responsibility for the accuracy of the prices or the underlying product to which the prices may be referenced. Other content is the intellectual property of the respective third party and all rights are reserved to them.
Reproduction or redistribution of any of this information is expressly prohibited without the prior written consent of World Gold Council or the appropriate copyright owners, except as specifically provided below. Information and statistics are copyright © and/or other intellectual property of the World Gold Council or its affiliates or third-party providers identified herein. All rights of the respective owners are reserved.
The use of the statistics in this information is permitted for the purposes of review and commentary (including media commentary) in line with fair industry practice, subject to the following two pre-conditions: (i) only limited extracts of data or analysis be used; and (ii) any and all use of these statistics is accompanied by a citation to World Gold Council and, where appropriate, to Metals Focus or other identified copyright owners as their source. World Gold Council is affiliated with Metals Focus.
The World Gold Council and its affiliates do not guarantee the accuracy or completeness of any information nor accept responsibility for any losses or damages arising directly or indirectly from the use of this information.
This information is for educational purposes only and by receiving this information, you agree with its intended purpose. Nothing contained herein is intended to constitute a recommendation, investment advice, or offer for the purchase or sale of gold, any gold-related products or services or any other products, services, securities or financial instruments (collectively, “Services”). This information does not take into account any investment objectives, financial situation or particular needs of any particular person.
Diversification does not guarantee any investment returns and does not eliminate the risk of loss. Past performance is not necessarily indicative of future results. The resulting performance of any investment outcomes that can be generated through allocation to gold are hypothetical in nature, may not reflect actual investment results and are not guarantees of future results. The World Gold Council and its affiliates do not guarantee or warranty any calculations and models used in any hypothetical portfolios or any outcomes resulting from any such use. Investors should discuss their individual circumstances with their appropriate investment professionals before making any decision regarding any Services or investments.
This information may contain forward-looking statements, such as statements which use the words “believes”, “expects”, “may”, or “suggests”, or similar terminology, which are based on current expectations and are subject to change. Forward-looking statements involve a number of risks and uncertainties. There can be no assurance that any forward-looking statements will be achieved. World Gold Council and its affiliates assume no responsibility for updating any forward-looking statements.
Information regarding QaurumSM and the Gold Valuation Framework
Note that the resulting performance of various investment outcomes that can be generated through use of Qaurum, the Gold Valuation Framework and other information are hypothetical in nature, may not reflect actual investment results and are not guarantees of future results. Neither World Gold Council (including its affiliates) nor Oxford Economics provides any warranty or guarantee regarding the functionality of the tool, including without limitation any projections, estimates or calculations.
India gold market update: Rally and demand realignment
Kavita Chacko
Research Head, India World Gold CouncilHighlights
- Gold’s price rally builds and exceeds key levels, with domestic price gains of 23% y-t-d
- High prices reshape consumer buying patterns
- March sees the first net outflow from gold ETFs in 10 months - India diverges from the global trend
- The RBI adopts a measured buying pace, even as the strategic importance of gold reserves intensifies
- Corporate retail jewellery sector logs strong growth from January to March
- March sees a sharp recovery in gold imports.
Looking ahead
- Seasonal and wedding related purchases may support gold demand this month and next. Investor interest is likely to strengthen as gold’s appeal as a safe-haven asset and portfolio diversifier heightens amid global economic uncertainties and financial market volatility.
Gold extends rally and breaks new thresholds
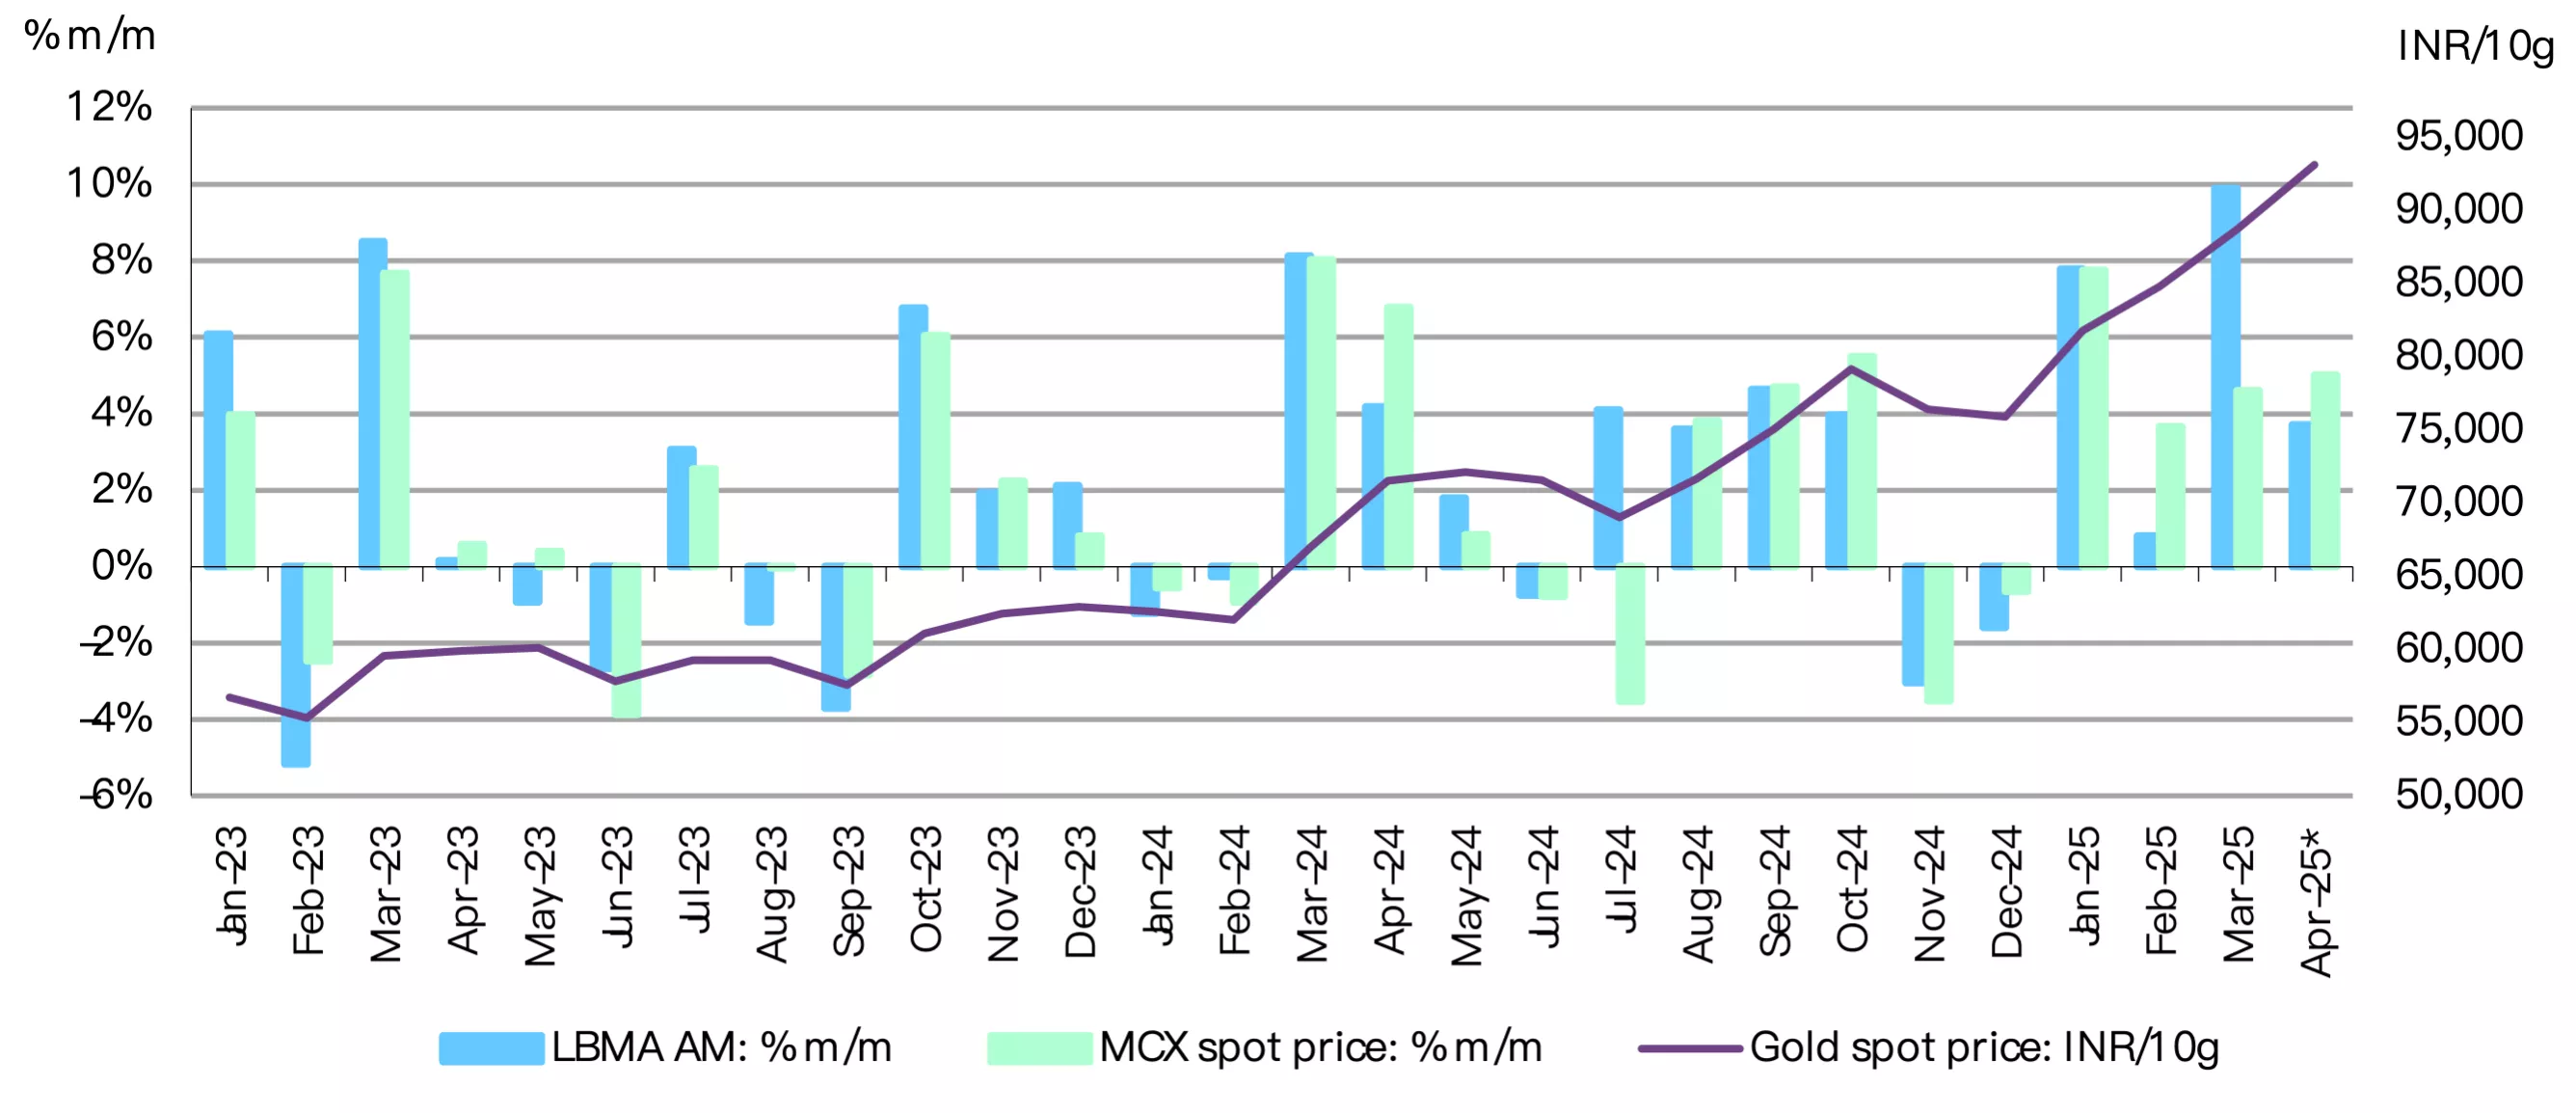
Gold has continued its impressive rally, repeatedly setting new record highs across major currencies and recently surpassing the threshold of US$3,200/oz.1 A weaker USD and heightened geopolitical risk – including tariff-led fear and uncertainty – have been key drivers of gold’s performance. Alongside this, strong gold ETF buying across most regions has been propelling gold higher.
Chart 1: Golden surge continues
Monthly LBMA Price AM and domestic spot price changes and movement*
*Based on the LBMA Gold Price PM in USD and MCX spot gold price.
Source: Bloomberg, World Gold Council
So far in 20252 the LBMA gold price PM in USD has climbed by US$621/oz or 24%, to US$3,230/oz, with over 14% of this increase occurring since March. The Indian domestic spot gold prices3 have mirrored this trend, rising 23% y-t-d to INR93,217/10g. For much of the past four months domestic prices have traded at a discount to international benchmarks (after adjusting for exchange rate and taxes),4 primarily due to subdued jewellery demand amid elevated prices. While domestic prices briefly moved into a slight premium in early April, the average discount has widened significantly – from US$12/oz in mid-March to over US$30/oz on 11 April.5
Gold buyers turn selective
Gold's steep climb and ongoing volatility are keeping many consumers on the sidelines, with demand for jewellery continuing to be limited to need based purchases, particularly for weddings. There has been a noticeable shift in consumer behaviour in response to soaring prices, with more buyers opting to trade in old jewellery for new: anecdotal reports suggest that 40–45% of purchases now involve some form of exchange.
While festive buying has continued, it remains modest and localised, often tied to specific regions and communities. At the same time, the investment appeal of gold is gaining prominence. Anecdotal reports suggest that demand for bars and coins has been resilient, even at high price levels.
The trend of festival and wedding related purchases is likely to persist, supported by the safe-haven appeal of gold. But this may not offset the drop in discretionary purchases. Amid broader financial market turmoil and uncertainty, gold's role as a store of value is becoming more pronounced, reflecting a shift in consumer behaviour from consumption-driven purchases to wealth preservation.
Stronger quarter for corporate retail jewellers
Earnings reports from leading jewellery retailers6 for January-March quarter point to a strong performance, with average revenue growth up 25–35% y/y. This was largely fuelled by wedding related demand, festive buying, and a noticeable consumer shift toward gold – both as an adornment and a store of value.
While high gold prices tempered demand at the lower price points, the premium segments remained fairly resilient. Average transaction values reportedly rose by 15% to 20% y/y. Also, there was an uptick in old gold exchanges, which contributed to overall sales volumes. Corporate retailers7 continued their aggressive store expansion strategy, adding 10 to 30 new outlets during the quarter and reinforcing the growing presence of organised players in the jewellery sector.
These large retailers remain upbeat about the outlook for the April-June quarter. Early indicators of advance bookings for regional festivals such as Akshaya Tritiya – a key period for gold purchases – point to strong consumer sentiment. Further underlining this bullish outlook, leading retailers plan to open between 150 and 200 new showrooms over the next 12 months, setting the stage for continued gains in market share and deeper penetration across regions.
Streak snaps: gold ETFs see outflows
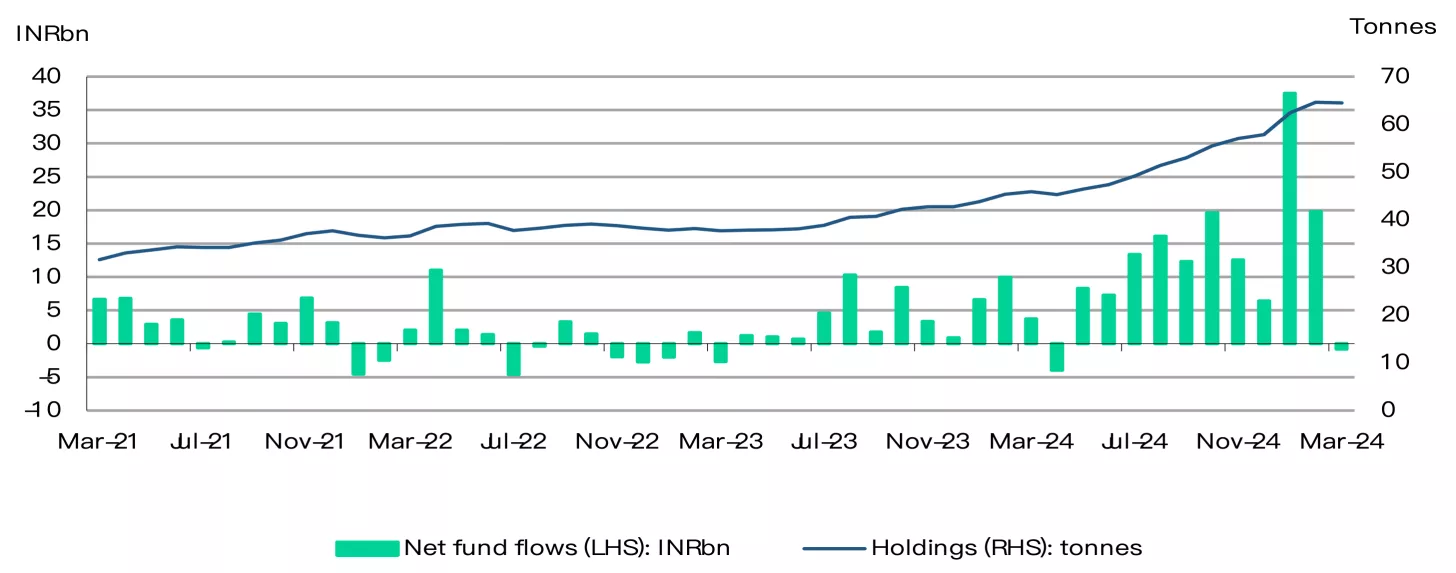
In a divergence from the global trend, Indian gold ETFs recorded modest net outflows in March, following ten consecutive months of sustained, strong inflows. Anecdotal evidence suggests that the pullback likely reflects profit-taking amid a record rally in gold prices, alongside portfolio rebalancing. Despite the outflows, assets under management (AUM) climbed to a record high, driven by the surge in gold prices, while investor participation continued to grow as new accounts were added.
According to the Association of Mutual Funds in India (AMFI), gold ETFs recorded net outflows of INR0.8bn (~US$8.9mn) in March, the first monthly outflow since April 2024. This is lower than our initial estimates, which were based on preliminary data.8 Despite these outflows, cumulative assets under management (AUM) of gold ETFs rose to INR589bn (~US$6.8bn), up 6% m/m and 89% y/y thanks to the gold price increase. Gold ETFs now account for 0.9% of total mutual fund AUM, up from 0.6% a year ago. The collective gold holdings of the 20 gold ETFs stood at 64.5t, down 0.1t from a month ago. However, strong inflows during the preceding two months added 6.7t to the collective holding in Q1 2025, the highest quarterly addition on record.
Investor interest in this asset class continues to grow with 0.13mn new investor accounts (or folios) added during the month, bringing the total number of gold ETF investor accounts to a record 7mn. In the last twelve months 1.9mn folios were added to gold ETFs.
Chart 2: Gold ETFs hit pause on inflows
Monthly gold ETF fund flows in INRbn, and total holdings in tonnes*
*As of end March 2025.
Source: AMFI, ICRA Analytics, CMIE, World Gold Council
RBI moderates gold buying but gold’s role in reserves strengthens
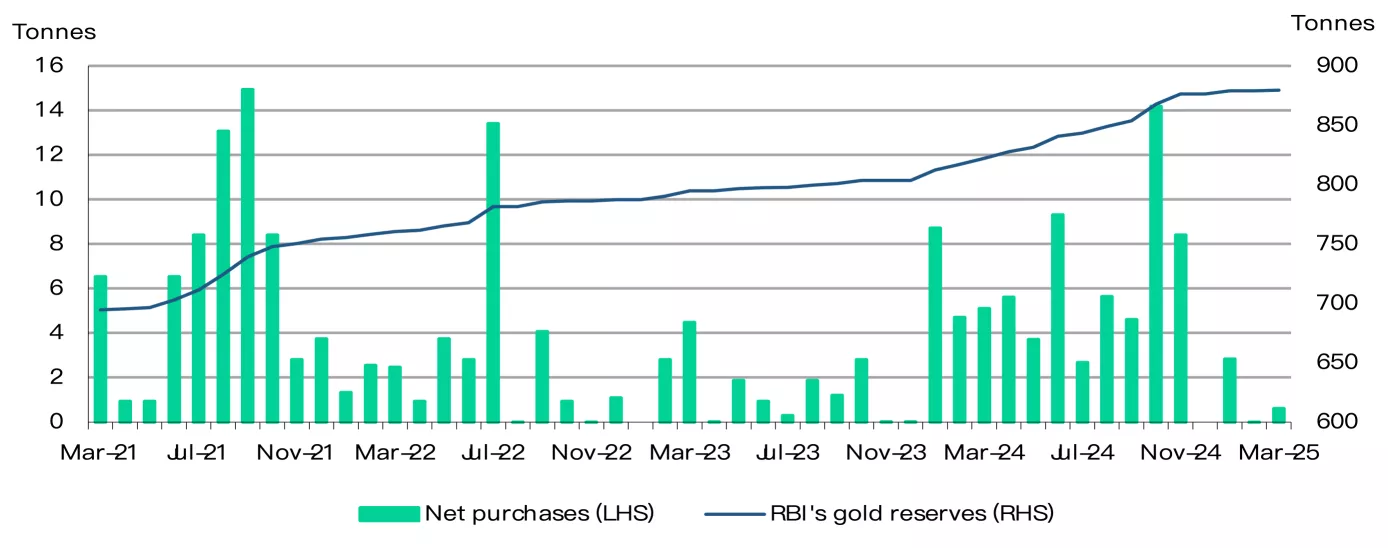
The RBI added a modest 0.6t of gold to its reserves in March, resuming purchases after a pause in February, according to our estimates based on the central bank’s weekly forex reserve data. This brings the RBI’s total gold holdings to 879.6t, or 11.7% of its total foreign exchange reserves – the highest level both in quantum and share.
Over the past year, gold’s share in the RBI’s forex reserves has risen nearly 4%, reflecting a net addition of 57.5t to its holdings. Yet recent trends suggest a moderation in the central bank’s gold buying. After consistently purchasing an average of 6.6t per month from January to November 2024, the RBI took a breather in December and February. And in January and March its purchases were notably below the previous monthly average.
This recent pattern in gold purchases may suggest a more measured approach from the RBI, although it underscores gold's rising strategic importance in India’s reserves management.
Chart 3: RBI’s gold accumulation slows
RBI’s monthly net purchase and reserves, tonnes *
*As of 4 April 2025.
Source: RBI, World Gold Council
Turnaround in imports
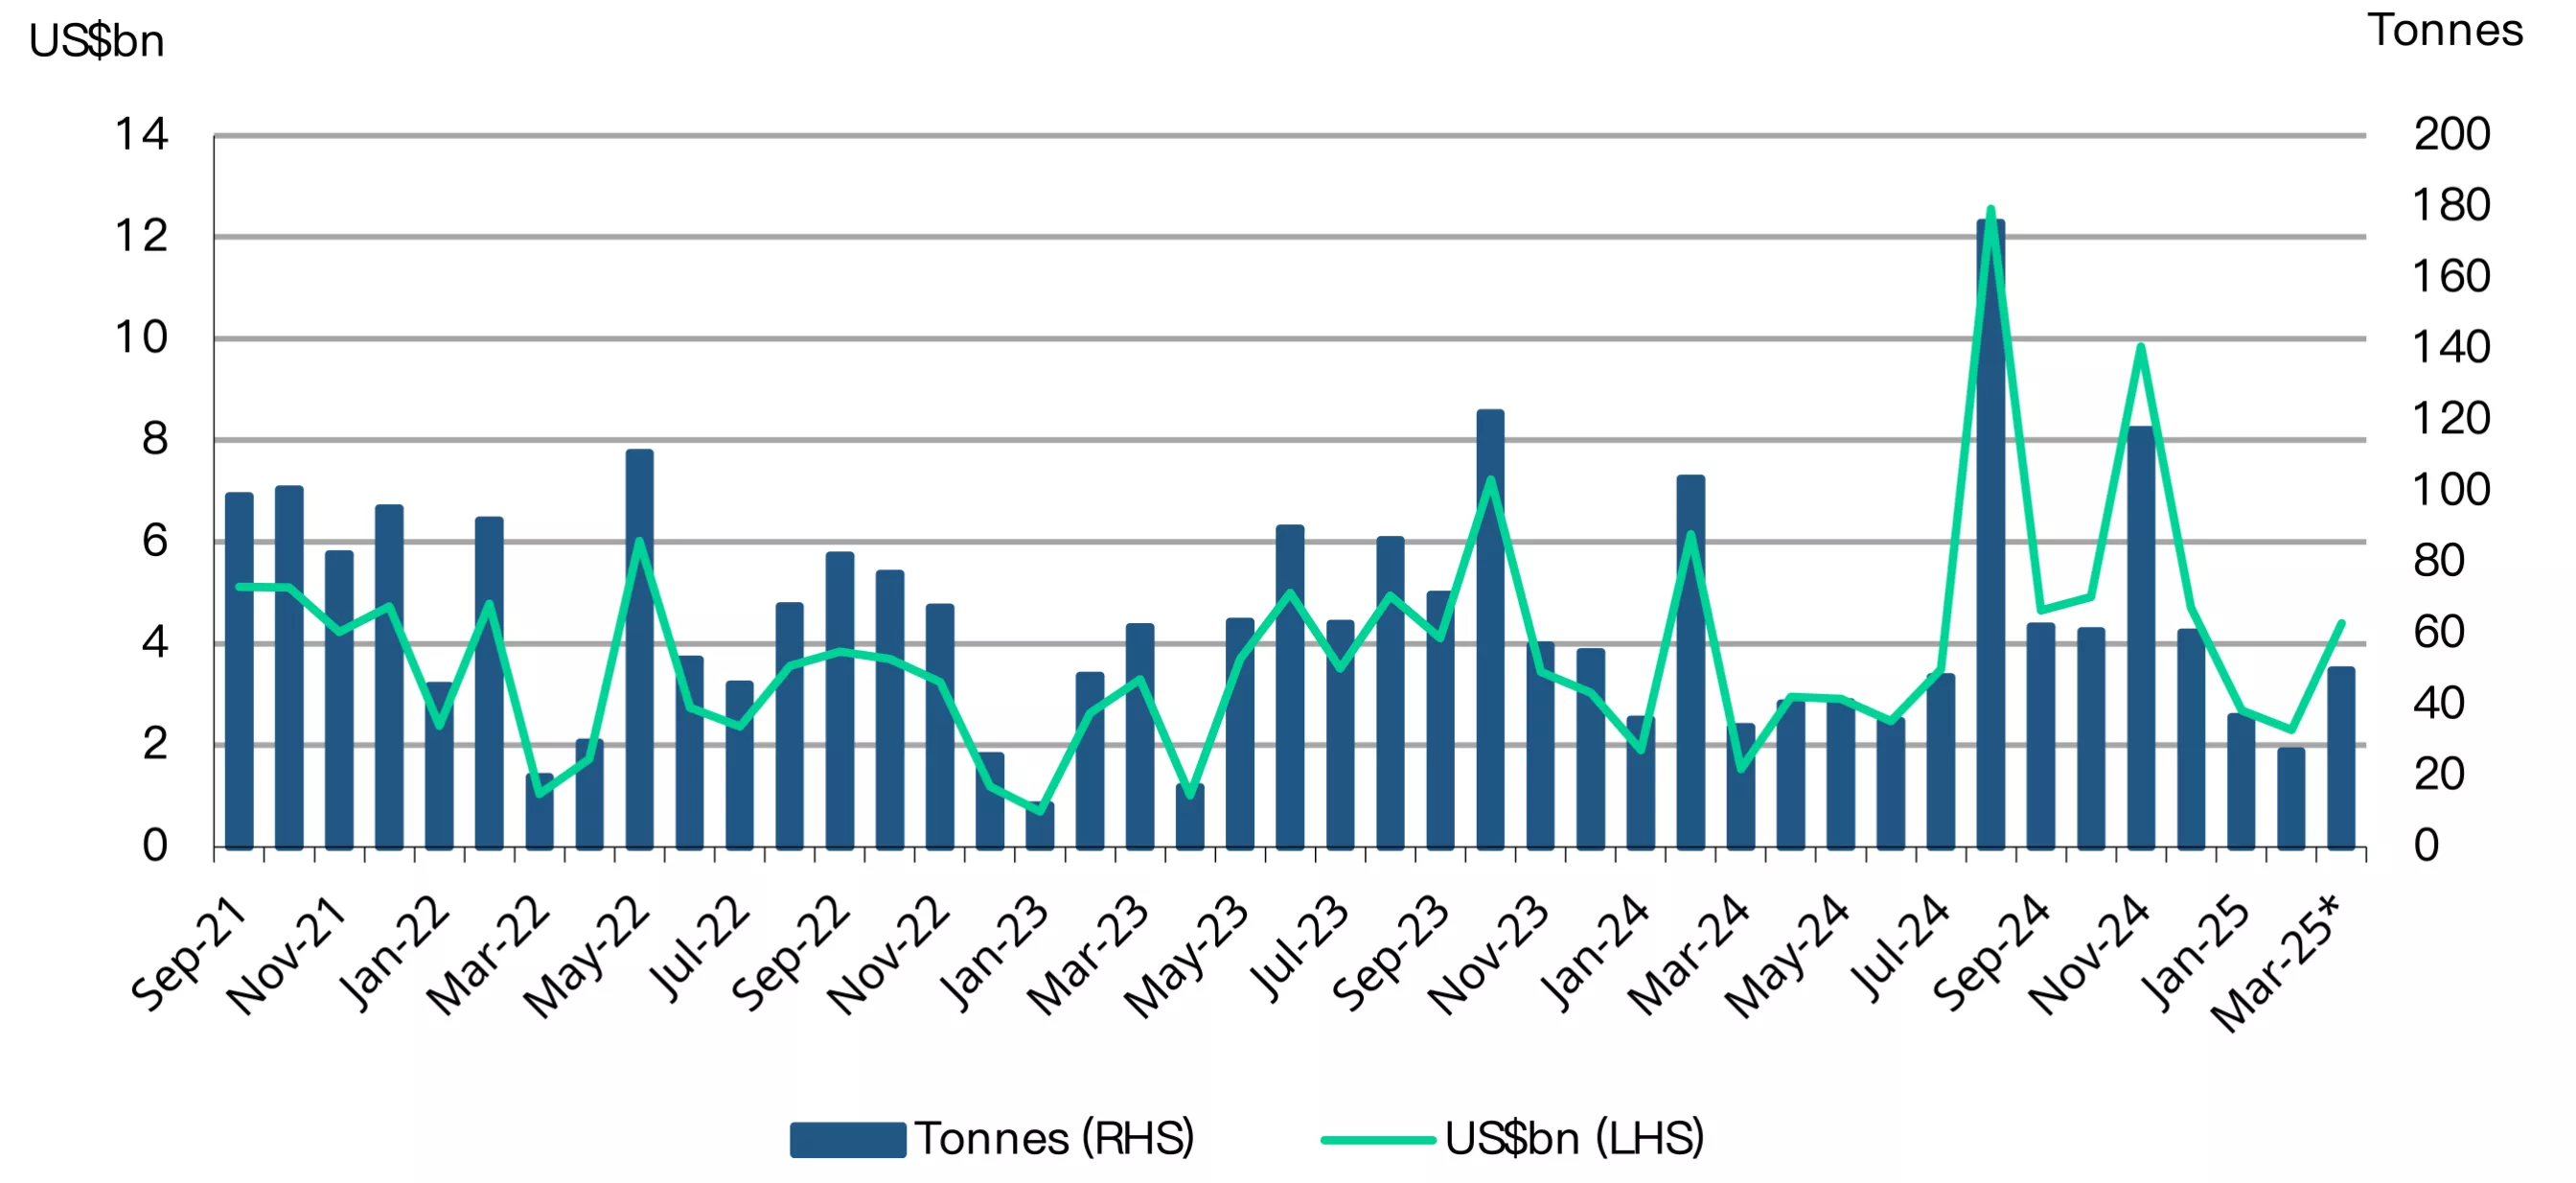
Despite record high prices, gold imports rebounded sharply in March after two consecutive months of decline. According to data from the Ministry of Commerce, imports climbed to US$4.4bn – nearly double the previous month's figure and significantly higher than the US$1.53bn recorded a year earlier. While still below the average monthly imports of US$7.3bn set between August and December 2024, the sharp uptick suggests a resurgence in demand and underscores a continued interest in gold, even at elevated prices. Based on our estimates, import volumes for the month were in the range of 47t to 52t.
The latest data from the Ministry of Commerce has revised gold imports for 2024 – from 724t to 812t – mainly due to revisions in import figures for the period from July to October.
Chart 4: Gold imports see strongest uptick in three months
Monthly gold imports in tonnes and US$bn*
*Includes World Gold Council estimates.
Source: Ministry of Commerce and Industry, CMIE, World Gold Council
Footnotes
1On 11 April,2025.
2As of 11 April 2025.
3MCX spot gold price.
4The premium/discount of local gold prices is based on the LBMA Gold Price AM adjusted for import taxes and exchange rate, which is also referred to as the ‘landed price’.
5Based on NCDEX data as 11 April 2025.
6Kalyan Jewellers India Pvt Ltd,, Titian Company Ltd, and Senco Gold Ltd.
7Comprises Kalyan Jewellers India Pvt Ltd,, Titian Company Ltd, and Senco Gold Ltd.
8Our initial estimate based on partial information available at the time was outflows of US$51mn.
Disclaimer
Important information and disclaimers
© 2025 World Gold Council. All rights reserved. World Gold Council and the Circle device are trademarks of the World Gold Council or its affiliates.
All references to LBMA Gold Price are used with the permission of ICE Benchmark Administration Limited and have been provided for informational purposes only. ICE Benchmark Administration Limited accepts no liability or responsibility for the accuracy of the prices or the underlying product to which the prices may be referenced. Other content is the intellectual property of the respective third party and all rights are reserved to them.
Reproduction or redistribution of any of this information is expressly prohibited without the prior written consent of World Gold Council or the appropriate copyright owners, except as specifically provided below. Information and statistics are copyright © and/or other intellectual property of the World Gold Council or its affiliates or third-party providers identified herein. All rights of the respective owners are reserved.
The use of the statistics in this information is permitted for the purposes of review and commentary (including media commentary) in line with fair industry practice, subject to the following two pre-conditions: (i) only limited extracts of data or analysis be used; and (ii) any and all use of these statistics is accompanied by a citation to World Gold Council and, where appropriate, to Metals Focus or other identified copyright owners as their source. World Gold Council is affiliated with Metals Focus.
The World Gold Council and its affiliates do not guarantee the accuracy or completeness of any information nor accept responsibility for any losses or damages arising directly or indirectly from the use of this information.
This information is for educational purposes only and by receiving this information, you agree with its intended purpose. Nothing contained herein is intended to constitute a recommendation, investment advice, or offer for the purchase or sale of gold, any gold-related products or services or any other products, services, securities or financial instruments (collectively, “Services”). This information does not take into account any investment objectives, financial situation or particular needs of any particular person.
Diversification does not guarantee any investment returns and does not eliminate the risk of loss. Past performance is not necessarily indicative of future results. The resulting performance of any investment outcomes that can be generated through allocation to gold are hypothetical in nature, may not reflect actual investment results and are not guarantees of future results. The World Gold Council and its affiliates do not guarantee or warranty any calculations and models used in any hypothetical portfolios or any outcomes resulting from any such use. Investors should discuss their individual circumstances with their appropriate investment professionals before making any decision regarding any Services or investments.
This information may contain forward-looking statements, such as statements which use the words “believes”, “expects”, “may”, or “suggests”, or similar terminology, which are based on current expectations and are subject to change. Forward-looking statements involve a number of risks and uncertainties. There can be no assurance that any forward-looking statements will be achieved. World Gold Council and its affiliates assume no responsibility for updating any forward-looking statements.
Information regarding QaurumSM and the Gold Valuation Framework
Note that the resulting performance of various investment outcomes that can be generated through use of Qaurum, the Gold Valuation Framework and other information are hypothetical in nature, may not reflect actual investment results and are not guarantees of future results. Neither World Gold Council (including its affiliates) nor Oxford Economics provides any warranty or guarantee regarding the functionality of the tool, including without limitation any projections, estimates or calculations.
Weekly Markets Monitor: The Easter gold surge
Weekly Markets Monitor
Highlights
- Tariff uncertainty continued to weigh on global markets last week. Weak US data and new chip export restrictions on China added to concerns. Growth worries drove ECB rate cuts while China’s economy showed resilience in Q1.
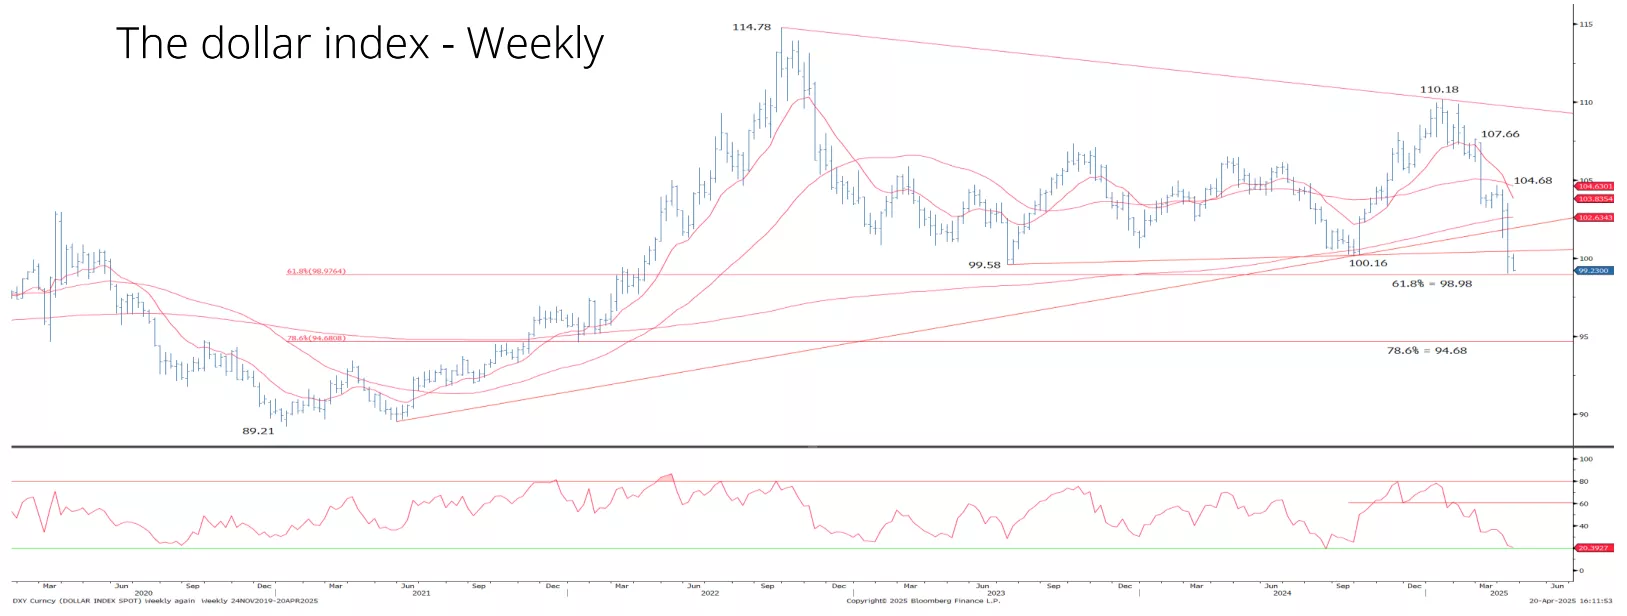
- Global equities ended mixed as investors tracked trade talks. The S&P 500 and Nasdaq dropped while the US 10-year Treasury yield fell. The dollar index dipped below 100 amid reducing confidence in US assets. Oil prices rose on supply fears.
- Gold has rallied to test next key technical resistance at US$3,350/oz. Investor confidence in US assets weakened further on fears Trump might fire Fed Chair Powell: the dollar plunged early Monday, sending gold to another record high.
- Another nervous week awaits with Powell purge fears front and centre, Japan trade talks continuing and China standing firm.
Chart of the week – dollar on the ropes
Source: Bloomberg
Disclaimer
Important information and disclaimers
© 2025 World Gold Council. All rights reserved. World Gold Council and the Circle device are trademarks of the World Gold Council or its affiliates.
All references to LBMA Gold Price are used with the permission of ICE Benchmark Administration Limited and have been provided for informational purposes only. ICE Benchmark Administration Limited accepts no liability or responsibility for the accuracy of the prices or the underlying product to which the prices may be referenced. Other content is the intellectual property of the respective third party and all rights are reserved to them.
Reproduction or redistribution of any of this information is expressly prohibited without the prior written consent of World Gold Council or the appropriate copyright owners, except as specifically provided below. Information and statistics are copyright © and/or other intellectual property of the World Gold Council or its affiliates or third-party providers identified herein. All rights of the respective owners are reserved.
The use of the statistics in this information is permitted for the purposes of review and commentary (including media commentary) in line with fair industry practice, subject to the following two pre-conditions: (i) only limited extracts of data or analysis be used; and (ii) any and all use of these statistics is accompanied by a citation to World Gold Council and, where appropriate, to Metals Focus or other identified copyright owners as their source. World Gold Council is affiliated with Metals Focus.
The World Gold Council and its affiliates do not guarantee the accuracy or completeness of any information nor accept responsibility for any losses or damages arising directly or indirectly from the use of this information.
This information is for educational purposes only and by receiving this information, you agree with its intended purpose. Nothing contained herein is intended to constitute a recommendation, investment advice, or offer for the purchase or sale of gold, any gold-related products or services or any other products, services, securities or financial instruments (collectively, “Services”). This information does not take into account any investment objectives, financial situation or particular needs of any particular person.
Diversification does not guarantee any investment returns and does not eliminate the risk of loss. Past performance is not necessarily indicative of future results. The resulting performance of any investment outcomes that can be generated through allocation to gold are hypothetical in nature, may not reflect actual investment results and are not guarantees of future results. The World Gold Council and its affiliates do not guarantee or warranty any calculations and models used in any hypothetical portfolios or any outcomes resulting from any such use. Investors should discuss their individual circumstances with their appropriate investment professionals before making any decision regarding any Services or investments.
This information may contain forward-looking statements, such as statements which use the words “believes”, “expects”, “may”, or “suggests”, or similar terminology, which are based on current expectations and are subject to change. Forward-looking statements involve a number of risks and uncertainties. There can be no assurance that any forward-looking statements will be achieved. World Gold Council and its affiliates assume no responsibility for updating any forward-looking statements.
Information regarding QaurumSM and the Gold Valuation Framework
Note that the resulting performance of various investment outcomes that can be generated through use of Qaurum, the Gold Valuation Framework and other information are hypothetical in nature, may not reflect actual investment results and are not guarantees of future results. Neither World Gold Council (including its affiliates) nor Oxford Economics provides any warranty or guarantee regarding the functionality of the tool, including without limitation any projections, estimates or calculations.
Get updates in your inbox
Get email updates
Weekly Markets Monitor: And breathe...
Weekly Markets Monitor
Highlights
- Last week, market volatility continued, but signs of easing trade tensions emerged. Concerns over the Fed’s independence also eased. But the IMF downgraded global and regional growth forecasts amid trade risks.
- Equity and bond markets posted solid gains, with US stocks rising on strong earnings and hopes of easing trade tensions, while bond yields fell as volatility in the fixed-income market subsided. The dollar and oil prices also rose.
- Gold took a breather, testing and rejecting the major US$3,500/oz psychological barrier, possibly entering a consolidation phase.
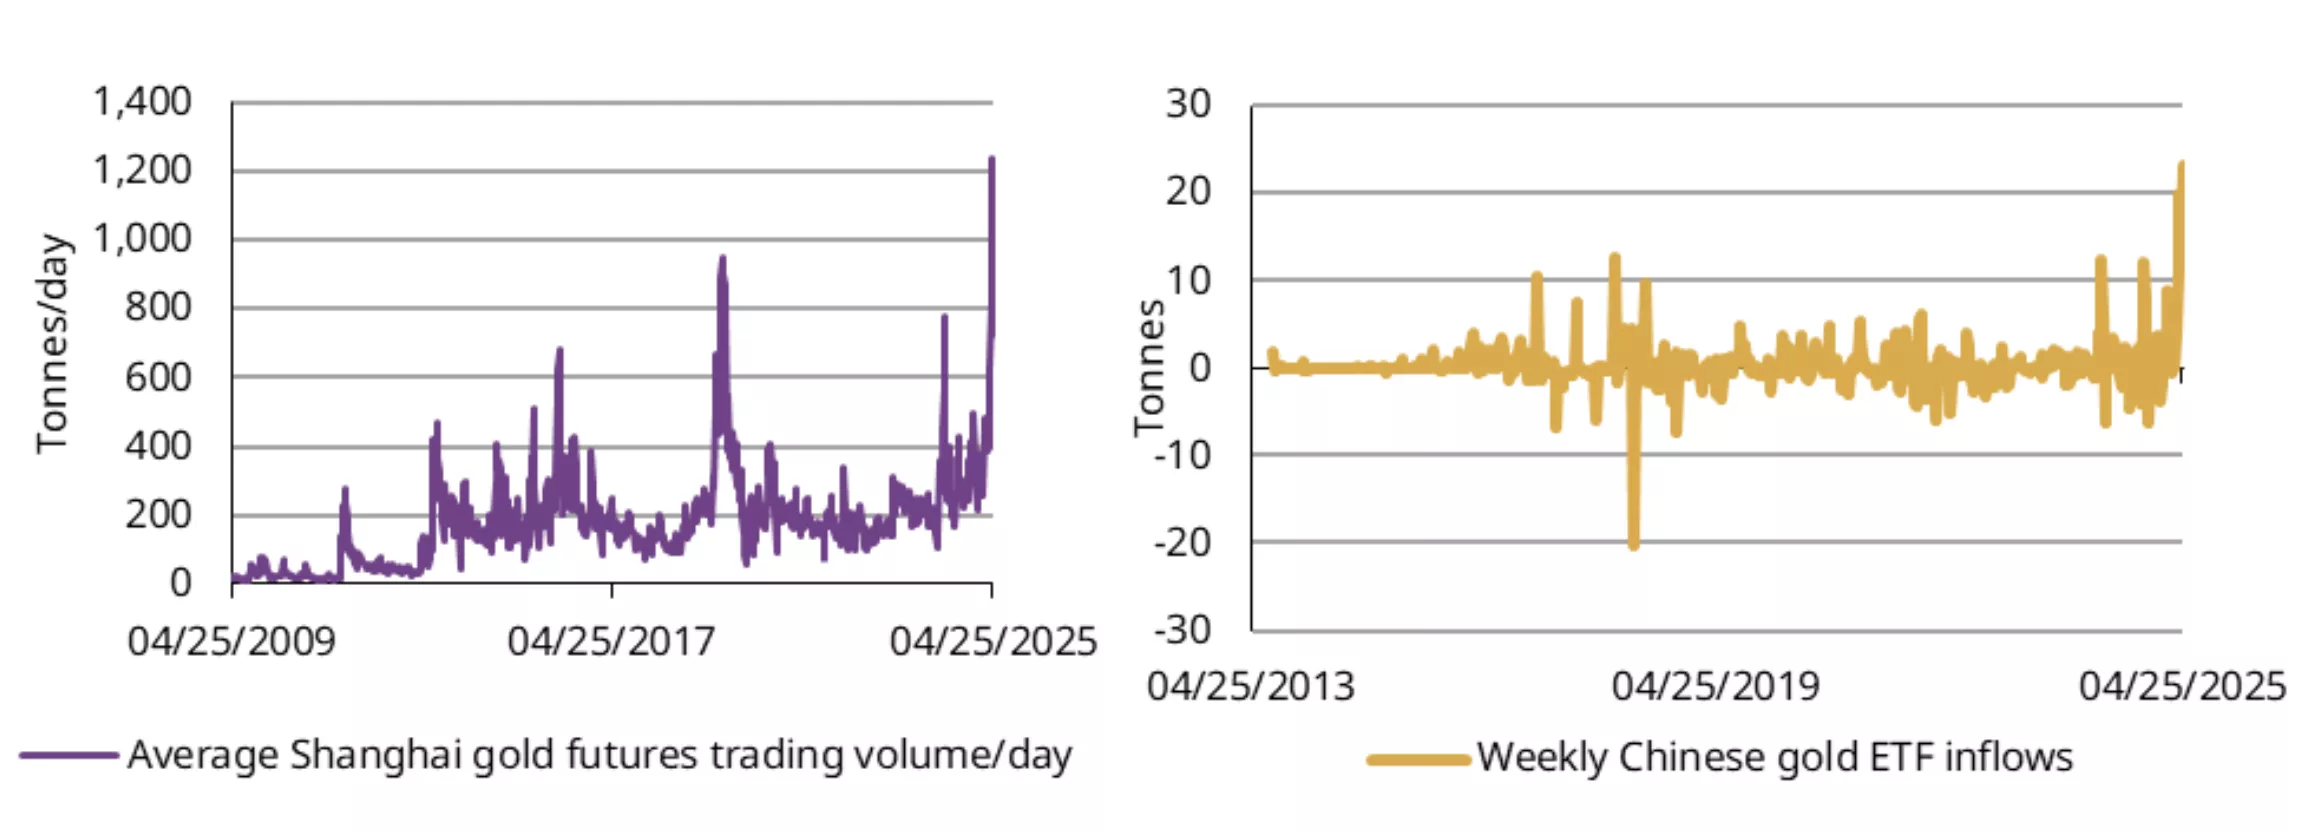
- Amid the US-China trade war and the strong gold price rally y-t-d, Chinese investors are trading/buying gold at an unprecedented pace – last week, Shanghai gold futures hit all-time high volumes and Chinese gold ETFs saw record inflows.
Chart of the week - The Chinese gold rush
Source: Shanghai Futures Exchange, ETF providers, World Gold Council
Based on weekly average trading volumes of gold futures/day at the Shanghai Futures Exchange and weekly inflows of Chinese gold ETFs, as of 25 April 2025.
Disclaimer
Important information and disclaimers
© 2025 World Gold Council. All rights reserved. World Gold Council and the Circle device are trademarks of the World Gold Council or its affiliates.
All references to LBMA Gold Price are used with the permission of ICE Benchmark Administration Limited and have been provided for informational purposes only. ICE Benchmark Administration Limited accepts no liability or responsibility for the accuracy of the prices or the underlying product to which the prices may be referenced. Other content is the intellectual property of the respective third party and all rights are reserved to them.
Reproduction or redistribution of any of this information is expressly prohibited without the prior written consent of World Gold Council or the appropriate copyright owners, except as specifically provided below. Information and statistics are copyright © and/or other intellectual property of the World Gold Council or its affiliates or third-party providers identified herein. All rights of the respective owners are reserved.
The use of the statistics in this information is permitted for the purposes of review and commentary (including media commentary) in line with fair industry practice, subject to the following two pre-conditions: (i) only limited extracts of data or analysis be used; and (ii) any and all use of these statistics is accompanied by a citation to World Gold Council and, where appropriate, to Metals Focus or other identified copyright owners as their source. World Gold Council is affiliated with Metals Focus.
The World Gold Council and its affiliates do not guarantee the accuracy or completeness of any information nor accept responsibility for any losses or damages arising directly or indirectly from the use of this information.
This information is for educational purposes only and by receiving this information, you agree with its intended purpose. Nothing contained herein is intended to constitute a recommendation, investment advice, or offer for the purchase or sale of gold, any gold-related products or services or any other products, services, securities or financial instruments (collectively, “Services”). This information does not take into account any investment objectives, financial situation or particular needs of any particular person.
Diversification does not guarantee any investment returns and does not eliminate the risk of loss. Past performance is not necessarily indicative of future results. The resulting performance of any investment outcomes that can be generated through allocation to gold are hypothetical in nature, may not reflect actual investment results and are not guarantees of future results. The World Gold Council and its affiliates do not guarantee or warranty any calculations and models used in any hypothetical portfolios or any outcomes resulting from any such use. Investors should discuss their individual circumstances with their appropriate investment professionals before making any decision regarding any Services or investments.
This information may contain forward-looking statements, such as statements which use the words “believes”, “expects”, “may”, or “suggests”, or similar terminology, which are based on current expectations and are subject to change. Forward-looking statements involve a number of risks and uncertainties. There can be no assurance that any forward-looking statements will be achieved. World Gold Council and its affiliates assume no responsibility for updating any forward-looking statements.
Information regarding QaurumSM and the Gold Valuation Framework
Note that the resulting performance of various investment outcomes that can be generated through use of Qaurum, the Gold Valuation Framework and other information are hypothetical in nature, may not reflect actual investment results and are not guarantees of future results. Neither World Gold Council (including its affiliates) nor Oxford Economics provides any warranty or guarantee regarding the functionality of the tool, including without limitation any projections, estimates or calculations.
Get updates in your inbox
Get email updates
Weekly Markets Monitor: All hands on gold
Weekly Markets Monitor
Highlights
- Last week, markets absorbed strong US earnings and labor data, steady BoJ policy, weak Chinese factory activity, and stronger EU growth, reflecting mixed global momentum
- Global equity markets mostly rose, driven by strong earnings and economic data. Bonds yields in the US and Europe climbed on positive economic reports. The dollar pared some losses and oil declined as OPEC+ decided to boost output.
- Gold is taking a breather after hitting the US$3,500/oz resistance, a “typical” historical extreme- 25% above its 40-week average – cooling market sentiment and momentum were key drivers (see slide 5 & 6 for details).
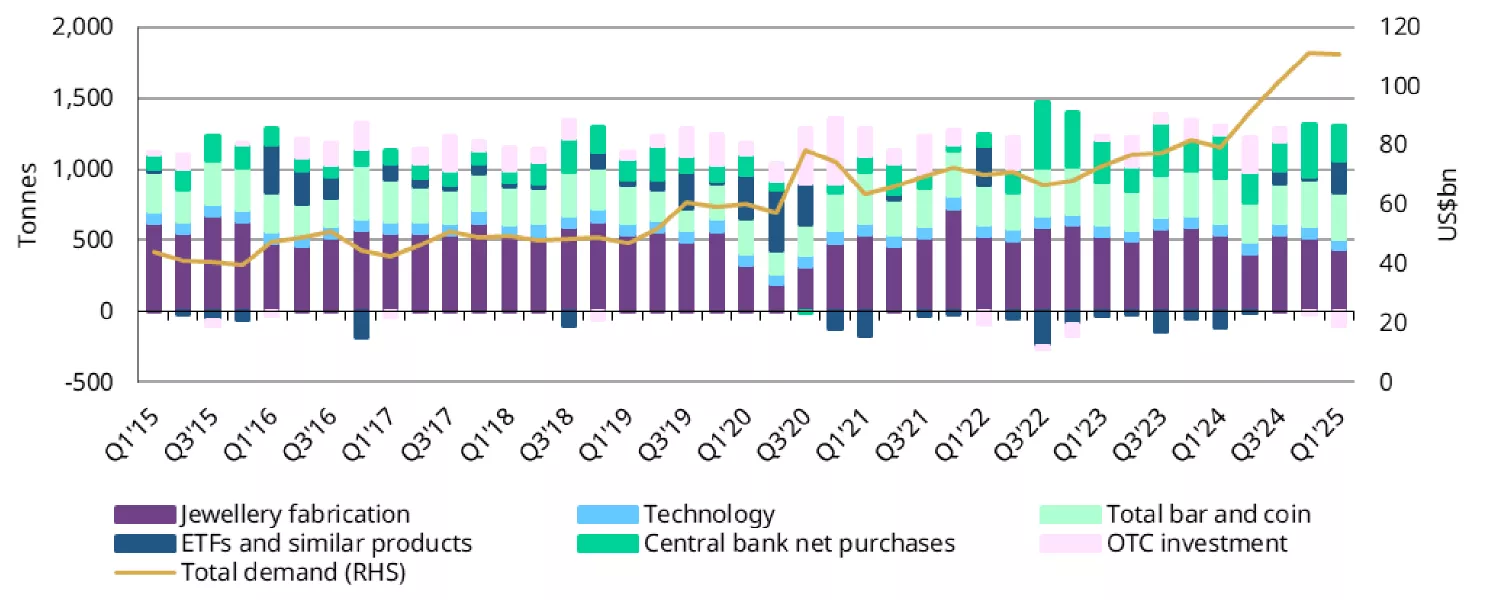
- We released our Gold Demand Trends report for Q1 last week: total demand (including OTC investment) rose 1% y/y to 1,206t, the highest Q1 since 2016.
Chart of the week – Q1 gold demand firms
Source: ICE Benchmark Administration, Metals Focus, World Gold Council
Data to 31 March 2025.
Disclaimer
Important information and disclaimers
© 2025 World Gold Council. All rights reserved. World Gold Council and the Circle device are trademarks of the World Gold Council or its affiliates.
All references to LBMA Gold Price are used with the permission of ICE Benchmark Administration Limited and have been provided for informational purposes only. ICE Benchmark Administration Limited accepts no liability or responsibility for the accuracy of the prices or the underlying product to which the prices may be referenced. Other content is the intellectual property of the respective third party and all rights are reserved to them.
Reproduction or redistribution of any of this information is expressly prohibited without the prior written consent of World Gold Council or the appropriate copyright owners, except as specifically provided below. Information and statistics are copyright © and/or other intellectual property of the World Gold Council or its affiliates or third-party providers identified herein. All rights of the respective owners are reserved.
The use of the statistics in this information is permitted for the purposes of review and commentary (including media commentary) in line with fair industry practice, subject to the following two pre-conditions: (i) only limited extracts of data or analysis be used; and (ii) any and all use of these statistics is accompanied by a citation to World Gold Council and, where appropriate, to Metals Focus or other identified copyright owners as their source. World Gold Council is affiliated with Metals Focus.
The World Gold Council and its affiliates do not guarantee the accuracy or completeness of any information nor accept responsibility for any losses or damages arising directly or indirectly from the use of this information.
This information is for educational purposes only and by receiving this information, you agree with its intended purpose. Nothing contained herein is intended to constitute a recommendation, investment advice, or offer for the purchase or sale of gold, any gold-related products or services or any other products, services, securities or financial instruments (collectively, “Services”). This information does not take into account any investment objectives, financial situation or particular needs of any particular person.
Diversification does not guarantee any investment returns and does not eliminate the risk of loss. Past performance is not necessarily indicative of future results. The resulting performance of any investment outcomes that can be generated through allocation to gold are hypothetical in nature, may not reflect actual investment results and are not guarantees of future results. The World Gold Council and its affiliates do not guarantee or warranty any calculations and models used in any hypothetical portfolios or any outcomes resulting from any such use. Investors should discuss their individual circumstances with their appropriate investment professionals before making any decision regarding any Services or investments.
This information may contain forward-looking statements, such as statements which use the words “believes”, “expects”, “may”, or “suggests”, or similar terminology, which are based on current expectations and are subject to change. Forward-looking statements involve a number of risks and uncertainties. There can be no assurance that any forward-looking statements will be achieved. World Gold Council and its affiliates assume no responsibility for updating any forward-looking statements.
Information regarding QaurumSM and the Gold Valuation Framework
Note that the resulting performance of various investment outcomes that can be generated through use of Qaurum, the Gold Valuation Framework and other information are hypothetical in nature, may not reflect actual investment results and are not guarantees of future results. Neither World Gold Council (including its affiliates) nor Oxford Economics provides any warranty or guarantee regarding the functionality of the tool, including without limitation any projections, estimates or calculations.
Get updates in your inbox
Get email updates
Weekly Markets Monitor: Trade Progress?
Weekly Markets Monitor
Highlights
- Last week saw a raft of central bank announcements: the Fed, Sweden, and Norway kept rates unchanged, while China, the UK, Poland, and the Czech Republic cut. Meanwhile, trade tensions eased as the US reached a deal with the UK and began talks with China.
- Global equities closed mixed amid hopes of tariff de-escalation, while Treasury yields rose, the US dollar strengthened and oil rose.
- Despite reduced futures net longs and ETF outflows, gold rose amid highly bullish option market positioning.
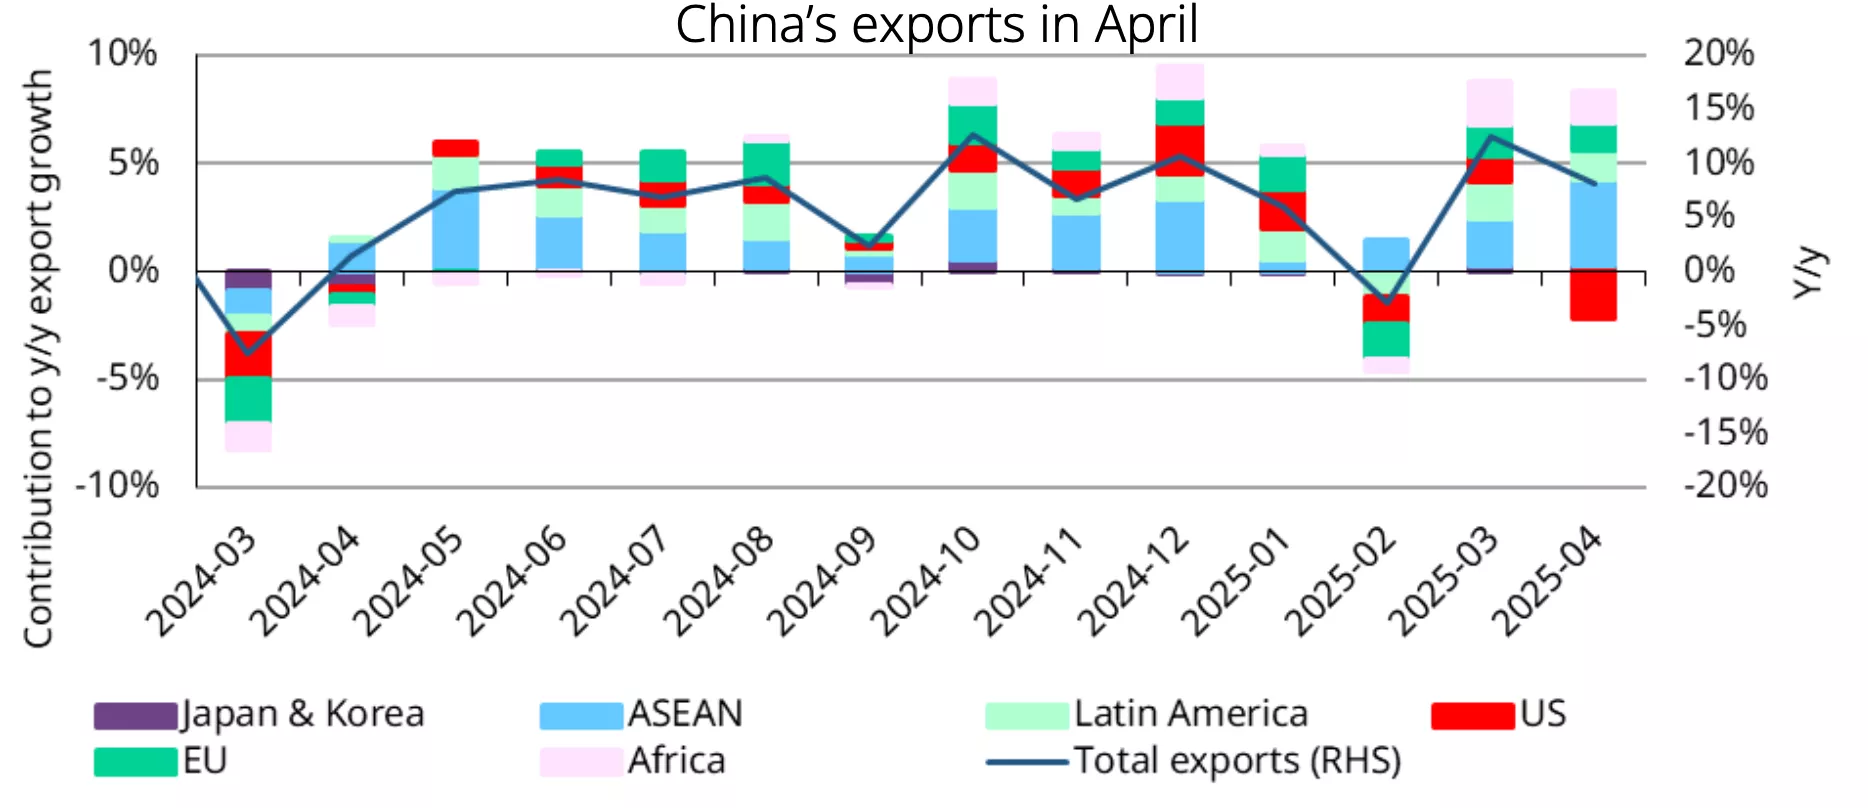
China’s export growth decelerated in April but remained robust – while trade with the US declined, exports to ASEAN rose. Although the trade talk may ease tension, we believe the risk-induced premium of gold may linger.
Chart of the week – China shuffles the deck
Source: China Customs, World Gold Council
Data to 30 April 2025. Note that due to data availability, we only singled out major trading partners instead of all export destination breakdown.
Disclaimer
Important information and disclaimers
© 2025 World Gold Council. All rights reserved. World Gold Council and the Circle device are trademarks of the World Gold Council or its affiliates.
All references to LBMA Gold Price are used with the permission of ICE Benchmark Administration Limited and have been provided for informational purposes only. ICE Benchmark Administration Limited accepts no liability or responsibility for the accuracy of the prices or the underlying product to which the prices may be referenced. Other content is the intellectual property of the respective third party and all rights are reserved to them.
Reproduction or redistribution of any of this information is expressly prohibited without the prior written consent of World Gold Council or the appropriate copyright owners, except as specifically provided below. Information and statistics are copyright © and/or other intellectual property of the World Gold Council or its affiliates or third-party providers identified herein. All rights of the respective owners are reserved.
The use of the statistics in this information is permitted for the purposes of review and commentary (including media commentary) in line with fair industry practice, subject to the following two pre-conditions: (i) only limited extracts of data or analysis be used; and (ii) any and all use of these statistics is accompanied by a citation to World Gold Council and, where appropriate, to Metals Focus or other identified copyright owners as their source. World Gold Council is affiliated with Metals Focus.
The World Gold Council and its affiliates do not guarantee the accuracy or completeness of any information nor accept responsibility for any losses or damages arising directly or indirectly from the use of this information.
This information is for educational purposes only and by receiving this information, you agree with its intended purpose. Nothing contained herein is intended to constitute a recommendation, investment advice, or offer for the purchase or sale of gold, any gold-related products or services or any other products, services, securities or financial instruments (collectively, “Services”). This information does not take into account any investment objectives, financial situation or particular needs of any particular person.
Diversification does not guarantee any investment returns and does not eliminate the risk of loss. Past performance is not necessarily indicative of future results. The resulting performance of any investment outcomes that can be generated through allocation to gold are hypothetical in nature, may not reflect actual investment results and are not guarantees of future results. The World Gold Council and its affiliates do not guarantee or warranty any calculations and models used in any hypothetical portfolios or any outcomes resulting from any such use. Investors should discuss their individual circumstances with their appropriate investment professionals before making any decision regarding any Services or investments.
This information may contain forward-looking statements, such as statements which use the words “believes”, “expects”, “may”, or “suggests”, or similar terminology, which are based on current expectations and are subject to change. Forward-looking statements involve a number of risks and uncertainties. There can be no assurance that any forward-looking statements will be achieved. World Gold Council and its affiliates assume no responsibility for updating any forward-looking statements.
Information regarding QaurumSM and the Gold Valuation Framework
Note that the resulting performance of various investment outcomes that can be generated through use of Qaurum, the Gold Valuation Framework and other information are hypothetical in nature, may not reflect actual investment results and are not guarantees of future results. Neither World Gold Council (including its affiliates) nor Oxford Economics provides any warranty or guarantee regarding the functionality of the tool, including without limitation any projections, estimates or calculations.
Get updates in your inbox
Get email updates
China gold market update: Unseen investment passion
Ray Jia
Head of Research (Asia Pacific, ex-India) and Deputy Head of Trade Engagement (China) World Gold CouncilHighlights
- Gold’s rally continued. The Shanghai Benchmark Gold Price PM rose 6.9% - its fifth consecutive monthly gain – and the LBMA Gold Price PM was up by 6%, witnessing positive returns for four consecutive months
- Jewellers, banks and other market participants withdrew 153t gold from the Shanghai Gold Exchange (SGE) in April, notably higher m/m and y/y
- Chinese gold ETFs added RMB49bn (US$6.8bn, 65t) in April, the strongest month ever. Their total assets under management (AUM) and collective holdings both surged to month-end peaks – but it is worth noting that inflows slowed at the start of May. Gold futures volumes at the Shanghai Futures Exchange (SHFE) also soared to a record high in April and remained elevated in early May
- The People’s Bank of China (PBoC) reported its sixth consecutive monthly gold purchase in April, adding 2.2t to its gold holdings, which now stand at 2,295t, 6.8% of total reserve assets
- The most recent information suggests tepid gold imports in March and a weak Q1 total. We believe this is due to lower gold price premiums – sometimes discounts – and cooling gold jewellery demand.
Looking ahead
- We expect gold jewellery consumption, in tonnage terms, to remain tepid as it enters its off season after the five-day Labour Day Holiday, although the recent price adjustment could provide some support
- Gold investment demand may also cool in the near term possibly due to profit taking, the range-bound price movements and cooling US-China trade tensions. But in the longer term, gold’s investment demand should be well supported amid its attractive performance, lingering global economic and geopolitical risks, as well as institutional allocations from Chinese insurers.
April saw continued gold price strength
Global gold prices kept rising in April (Chart 1). Our model shows that a weaker dollar, elevated geopolitical/economic uncertainties and strong gold ETF inflows drove gold up. While the LBMA Gold Price PM in USD saw its strongest April since 2011, the SHAUPM in RMB recorded its highest April return in 19 years.
Chart 1: The gold price rally extended into April
Monthly returns of the SHAUPM in RMB and the LBMA Gold Price PM in USD*
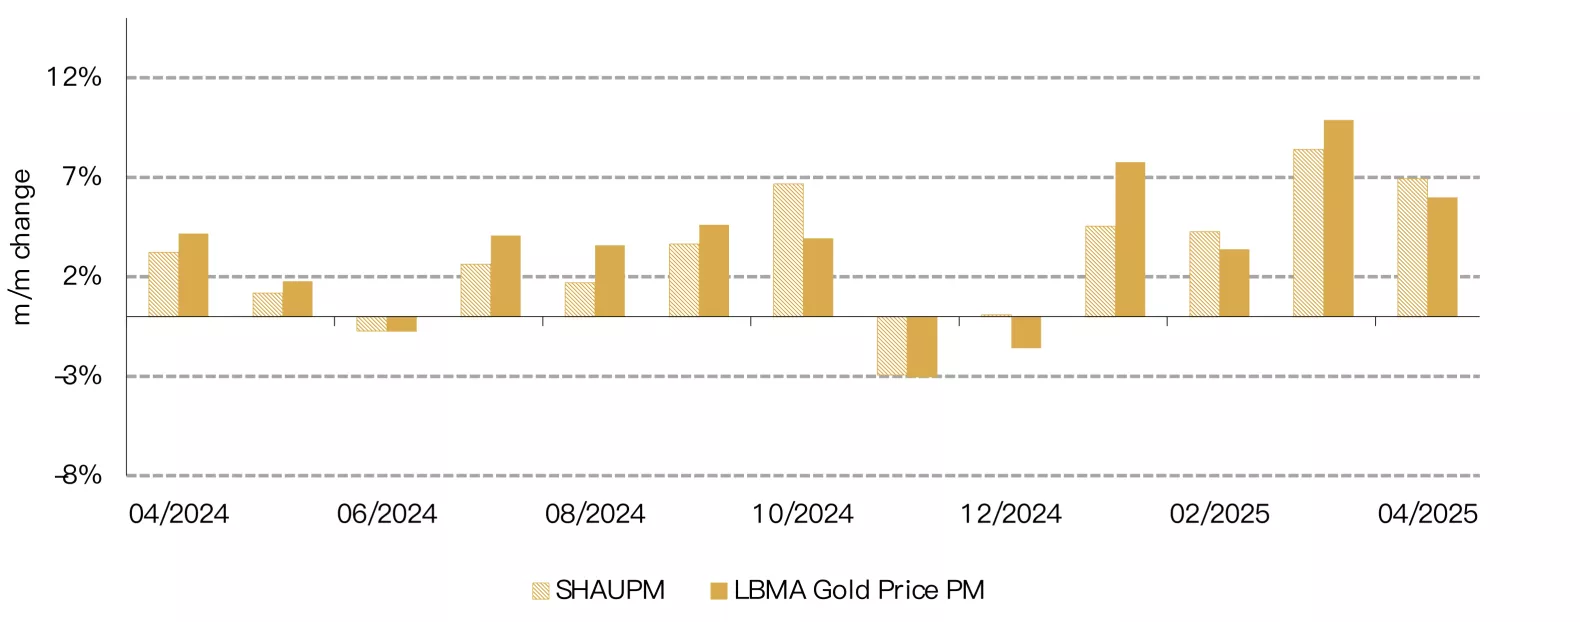
*Data as of 30 April 2025.
Source: Bloomberg, World Gold Council
Over the past four months, the RMB gold price has witnessed a cumulative return of 24%, the strongest January to April performance on record (Chart 2). And the LBMA Gold Price PM soared 27% during the same period. The difference is mainly a result of a stronger RMB, which has appreciated 1% so far in 2025.
Chart 2: Gold prices saw unprecedent y-t-d returns
Y-t-d returns of the Au9999 in RMB and the LBMA Gold Price PM in USD*
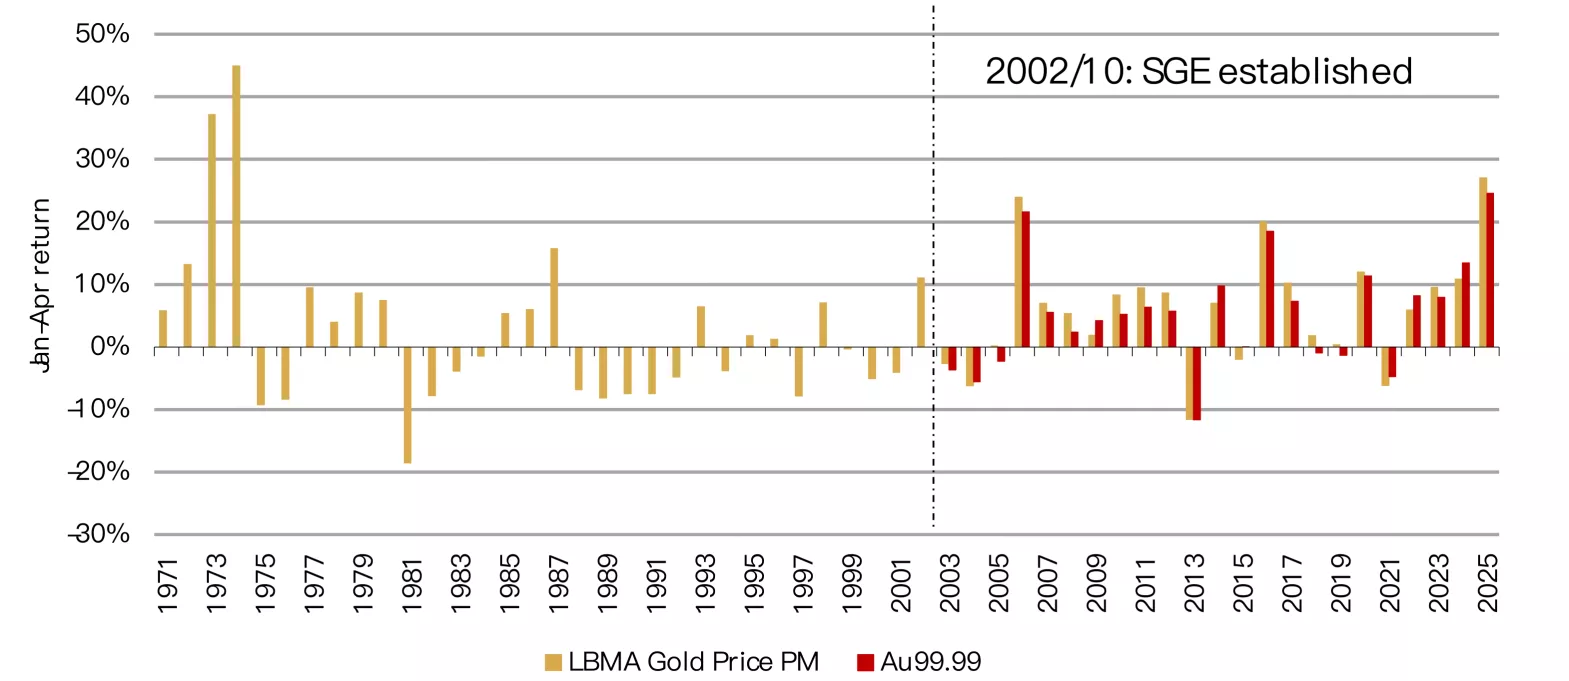
*We use Au99.99 – the main spot gold contract at the SGE – and the gold price in RMB as it has a longer history than SHAUPM.
Source: Bloomberg, World Gold Council
Wholesale demand continued to rebound
The industry withdrew 153t gold from the SGE, a rise of 27% m/m and 17% y/y (Chart 3). The improving wholesale gold demand is also reflected in the rising local gold price premium, which averaged US$37/oz in April, significantly higher than March’s US$2/oz.
We believe the following factors underpinned the April strength:
- Continued robustness in bar and coin sales amid strong investor buying: gold remains a top-performing asset in China as US-China trade tensions intensified
- Jewellers re-stocking for the early May Labour Day Holiday following Q1 withdrawals that were lower than usual.1
Chart 3: Wholesale demand improved in April
Gold withdrawals from the SGE*
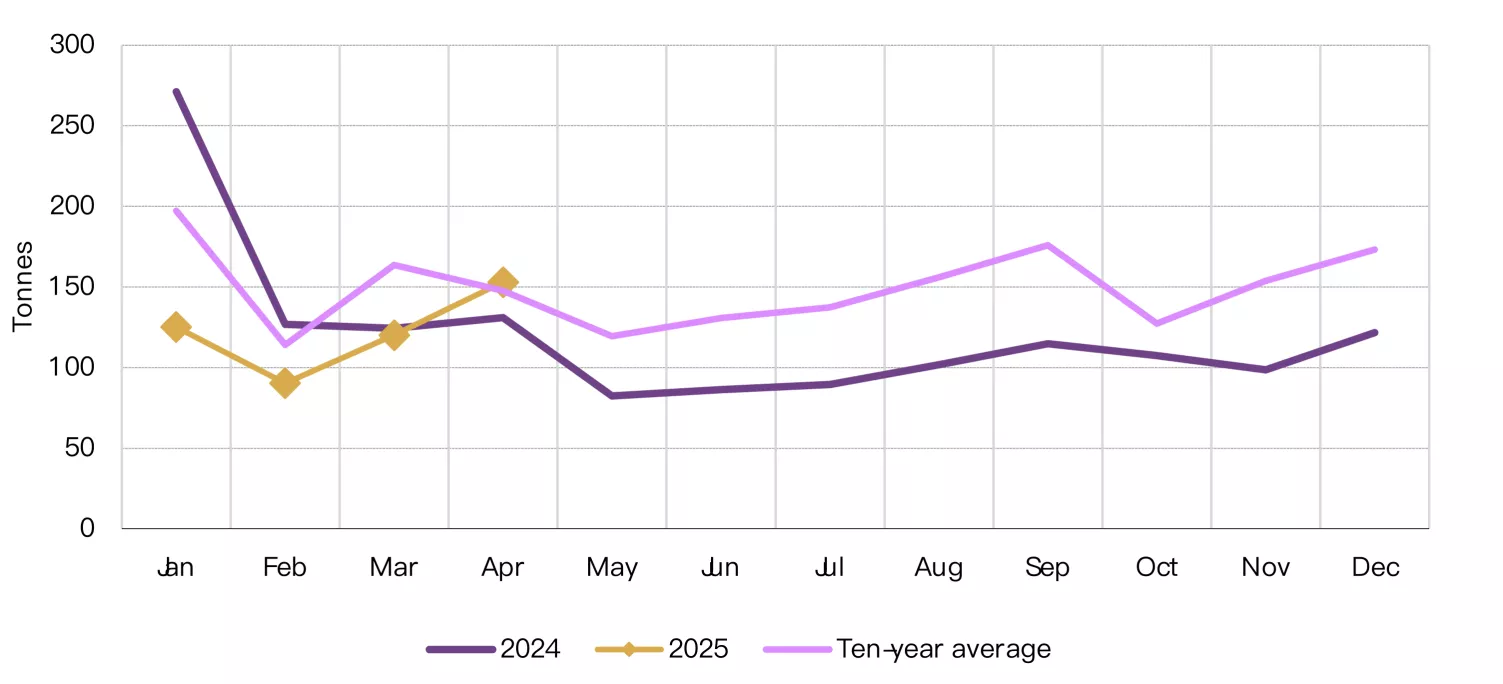
*As of April 2025.
Source: Shanghai Gold Exchange, World Gold Council
Surging gold ETF demand in April
Chinese gold ETFs recorded their strongest month on record, adding RMB49bn (US$6.8bn) (Chart 4). The third consecutive monthly inflow and the continued surge in the gold price lifted their total AUM to RMB158bn (US$22bn); a rise of 57% in April and the highest month-end value ever. Meanwhile, holdings surged by 65t to 203t, also a record high.
This unprecedented demand surge was mainly driven by the attractive local gold price performance, US-China trade war concerns and falling local bond yields amid intensified easing expectations. During the first four months of 2025 Chinese gold ETFs’ total AUM and holdings have jumped by 125% and 77%, respectively.
As we enter May, ETF demand in China remains positive yet slows notably compared to April. This is, likely due to investors having mostly priced in previous trade uncertainties – which have eased following the US-China Geneva trade talk – and a stabilisation of the local gold price.2
Chart 4: The strongest monthly gold ETF demand on record
Collective holdings and monthly demand of Chinese gold ETFs*
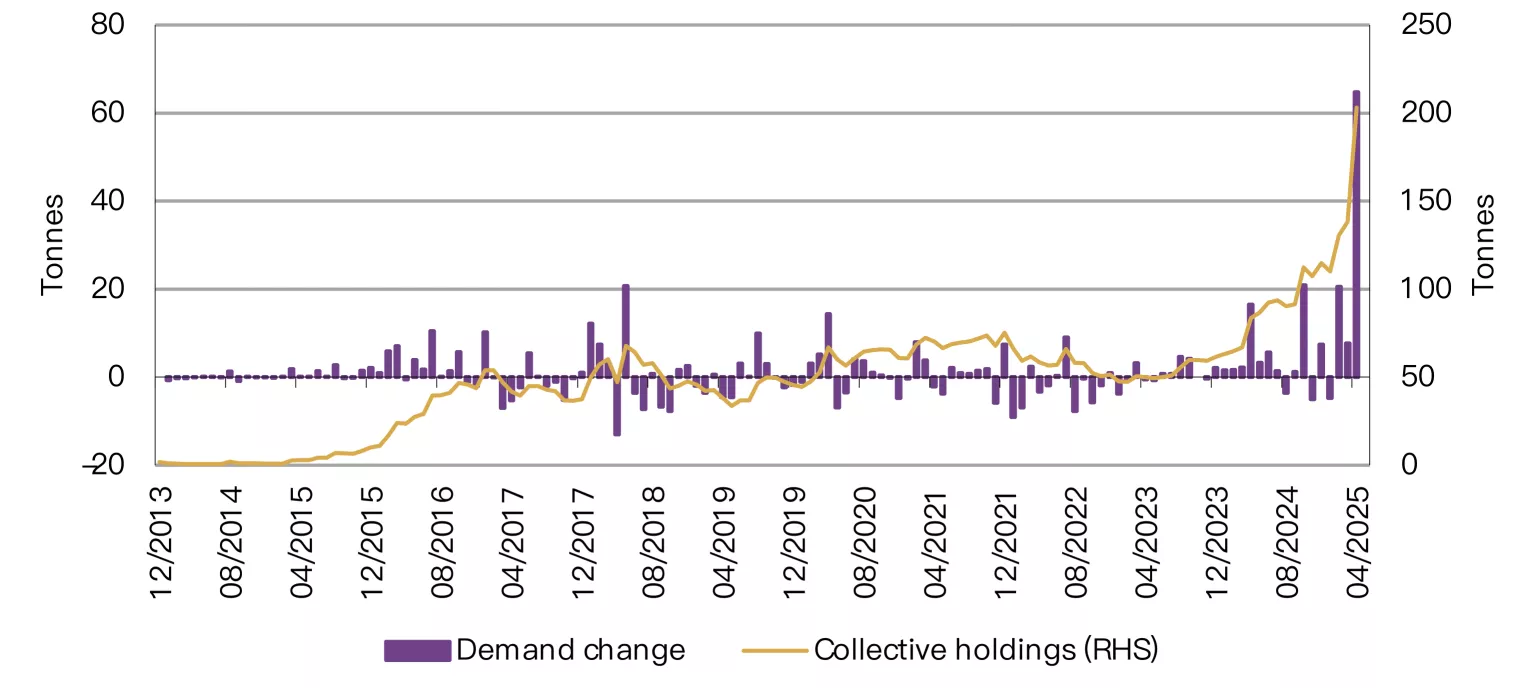
*As of 30 April 2025.
Source: Company filings, World Gold Council
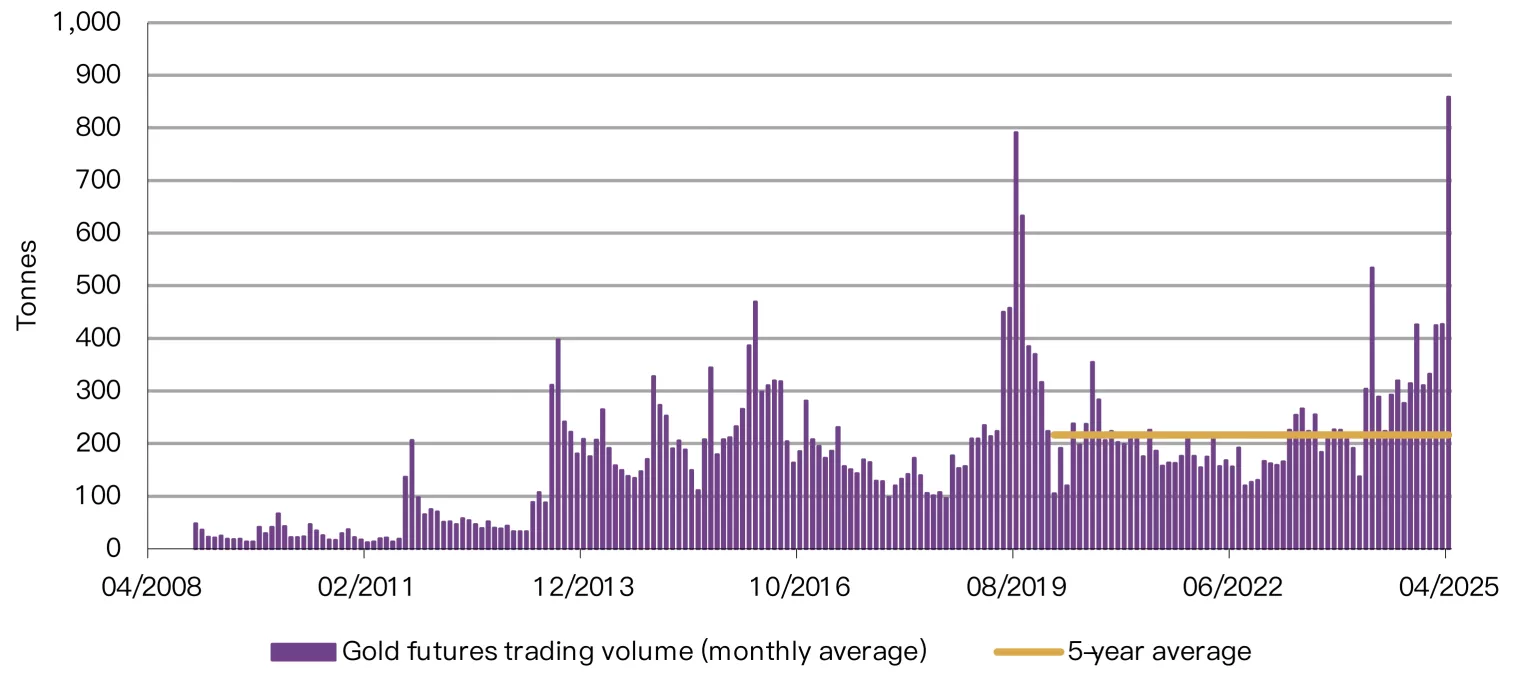
Chinese investor interest in gold futures also reached unseen levels in April (Chart 5). The average daily trading volume of SHFE’s gold futures doubled m/m to reach a record 859t. We believe amplified gold price volatility and the strong gold price performance attracted trader attention, pushing volumes of gold futures notably higher.
Although gold futures trading activities cooled mildly in early May, the average volume during the first five trading days stays near the record high at 756t/day.3 This marks traders’ continued enthusiasm in gold futures despite the price adjustment recently.
Chart 5: Active gold futures trading amidst the strong gold price rally
Average daily trading volume of SHFE gold futures*
*As of 30 April 2025.
Source: Shanghai Futures Exchange, World Gold Council
The PBoC reported another gold purchase in April
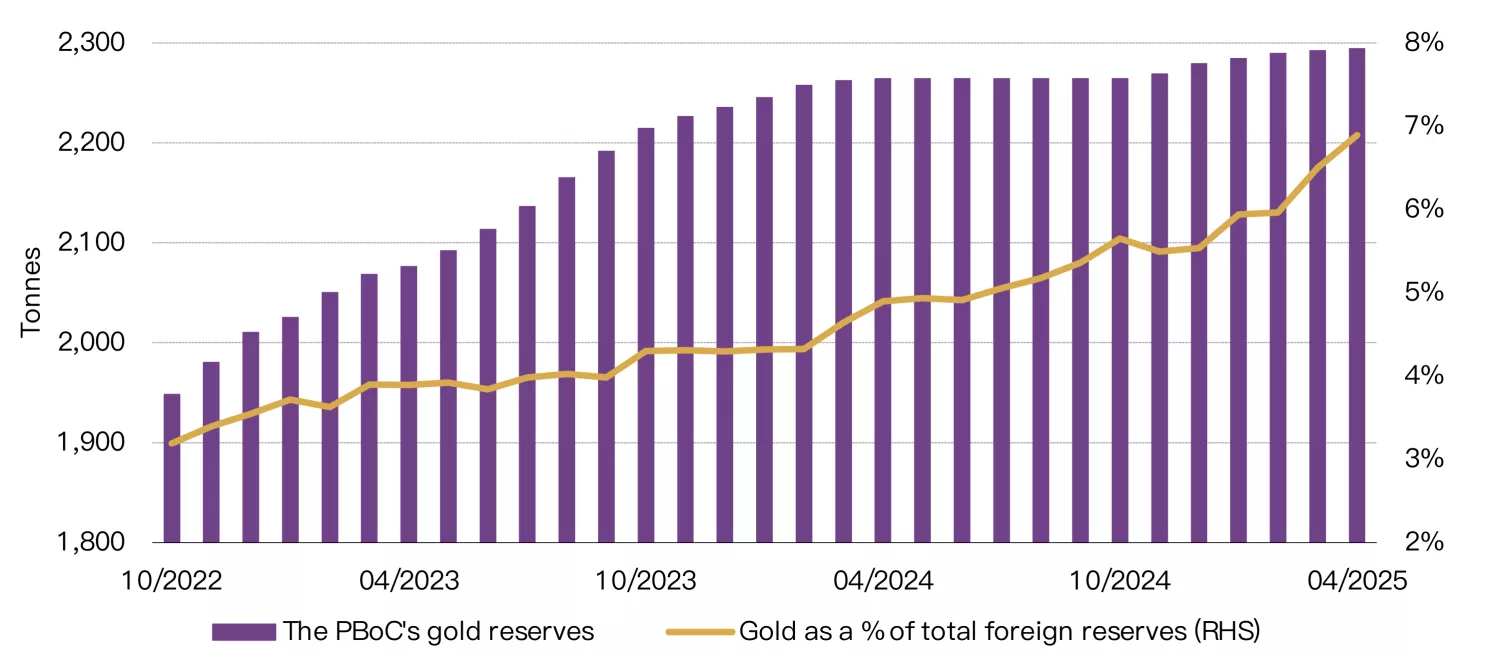
The PBoC’s gold purchasing streak has now extended to six months. Reported gold reserves in China rose 2.2t in April, lifting the total to 2,295t, or 6.8% of overall reserve assets (Chart 6). In value terms, China’s gold reserves rose to US$243.6bn, 6% higher m/m. So far in 2025 China has announced an increase of 14.9t in its official gold holdings.
Chart 6: China reported official gold holdings increase for the sixth consecutive month
Reported official gold holdings and gold as a percentage of total foreign exchange reserves*
* As of 30 April 2025.
Source: Administration of Foreign Exchange, World Gold Council
Imports remained tepid at the start of 2025
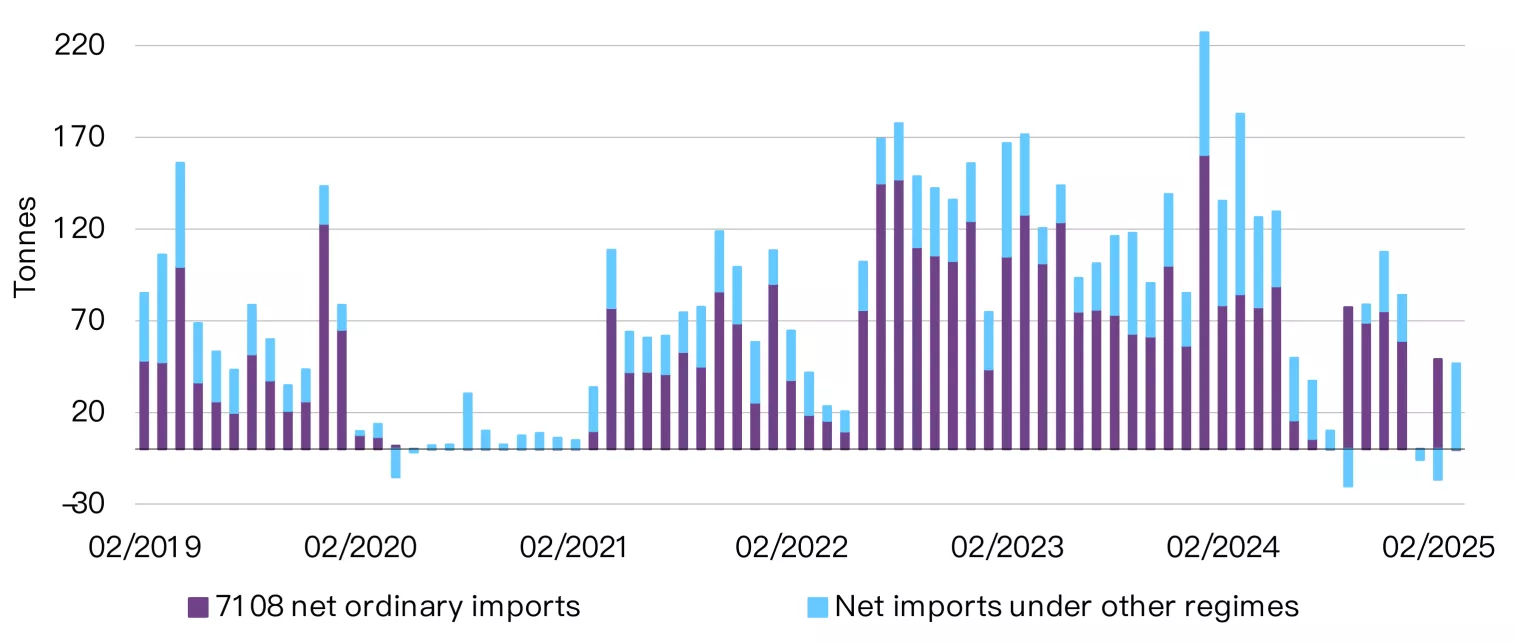
According to the latest data, China imported 46t of gold on a net basis in March (Chart 7). Despite a 14t m/m rebound, this was well below last March’s 183t. And Q1 total imports amounted to 73t, the lowest since 2021 when COVID-related restrictions limited imports, and far below the 545t level in Q1 2024.
Weaker gold jewellery demand during the quarter was a key reason for the slowdown as it helped squeeze the local gold price premium, at times pushing it to a discount, which further discouraged gold importers.
Chart 7: Imports remained tepid in March
7108 gold imports under various regimes*
*Based on the latest data available. Data to March 2025.
Source: China Customs, World Gold Council
Footnotes
1The 2025 Labour Day Holiday was between 1 and 5 May.
2See: Joint Statement on U.S.-China Economic and Trade Meeting in Geneva – The White House, 12 May 2025.
3Based on average daily trading volumes of SHFE’s gold futures between 6 and 12 May 2025. 1 – 5 May was the Labour Day Holiday.
Disclaimer
Important information and disclaimers
© 2025 World Gold Council. All rights reserved. World Gold Council and the Circle device are trademarks of the World Gold Council or its affiliates.
All references to LBMA Gold Price are used with the permission of ICE Benchmark Administration Limited and have been provided for informational purposes only. ICE Benchmark Administration Limited accepts no liability or responsibility for the accuracy of the prices or the underlying product to which the prices may be referenced. Other content is the intellectual property of the respective third party and all rights are reserved to them.
Reproduction or redistribution of any of this information is expressly prohibited without the prior written consent of World Gold Council or the appropriate copyright owners, except as specifically provided below. Information and statistics are copyright © and/or other intellectual property of the World Gold Council or its affiliates or third-party providers identified herein. All rights of the respective owners are reserved.
The use of the statistics in this information is permitted for the purposes of review and commentary (including media commentary) in line with fair industry practice, subject to the following two pre-conditions: (i) only limited extracts of data or analysis be used; and (ii) any and all use of these statistics is accompanied by a citation to World Gold Council and, where appropriate, to Metals Focus or other identified copyright owners as their source. World Gold Council is affiliated with Metals Focus.
The World Gold Council and its affiliates do not guarantee the accuracy or completeness of any information nor accept responsibility for any losses or damages arising directly or indirectly from the use of this information.
This information is for educational purposes only and by receiving this information, you agree with its intended purpose. Nothing contained herein is intended to constitute a recommendation, investment advice, or offer for the purchase or sale of gold, any gold-related products or services or any other products, services, securities or financial instruments (collectively, “Services”). This information does not take into account any investment objectives, financial situation or particular needs of any particular person.
Diversification does not guarantee any investment returns and does not eliminate the risk of loss. Past performance is not necessarily indicative of future results. The resulting performance of any investment outcomes that can be generated through allocation to gold are hypothetical in nature, may not reflect actual investment results and are not guarantees of future results. The World Gold Council and its affiliates do not guarantee or warranty any calculations and models used in any hypothetical portfolios or any outcomes resulting from any such use. Investors should discuss their individual circumstances with their appropriate investment professionals before making any decision regarding any Services or investments.
This information may contain forward-looking statements, such as statements which use the words “believes”, “expects”, “may”, or “suggests”, or similar terminology, which are based on current expectations and are subject to change. Forward-looking statements involve a number of risks and uncertainties. There can be no assurance that any forward-looking statements will be achieved. World Gold Council and its affiliates assume no responsibility for updating any forward-looking statements.
Information regarding QaurumSM and the Gold Valuation Framework
Note that the resulting performance of various investment outcomes that can be generated through use of Qaurum, the Gold Valuation Framework and other information are hypothetical in nature, may not reflect actual investment results and are not guarantees of future results. Neither World Gold Council (including its affiliates) nor Oxford Economics provides any warranty or guarantee regarding the functionality of the tool, including without limitation any projections, estimates or calculations.
India's gold market update: Gains hold despite demand pressure
Kavita Chacko
Research Head, India World Gold CouncilHighlights
- Gold’s surge softens, yet y-t-d gains of 23% outperform other assets
- Gold demand remains soft overall; festival shows mixed response
- Heavy redemptions hit gold ETFs in April; AUM and investor base expands
- RBIs gold purchases slow amid record gold reserves
- Gold imports in April withstand price surge, demonstrating resilience.
Looking ahead
- Stability in prices could prompt a resurgence in demand. Consumer sentiment that the downside to gold prices is limited would reinforce gold’s appeal as a reliable investment.
Gold rallies to historic highs, then recedes
Gold’s momentum accelerated in April, surging to a record high of US$3,500/oz and marking its fourth consecutive month of gains, with a 6% increase. The speed and sharp rise were fuelled by a weakening US dollar, heightened geopolitical and economic uncertainties, and strong inflows into global gold ETFs. However, prices have since retreated, with the LBMA Gold PM price falling 8% so far in May.1 In India, domestic gold prices mirrored the global trend. Although, the May m-t-d correction was milder at 5%, cushioned by the appreciation of the Indian rupee.
Chart 1: Gold slides after four-month surge
Monthly LBMA Price PM and domestic spot price changes and movement*

*Based on the LBMA Gold Price PM in USD and MCX spot gold price as of 14 May 2025.
Source: Bloomberg, World Gold Council
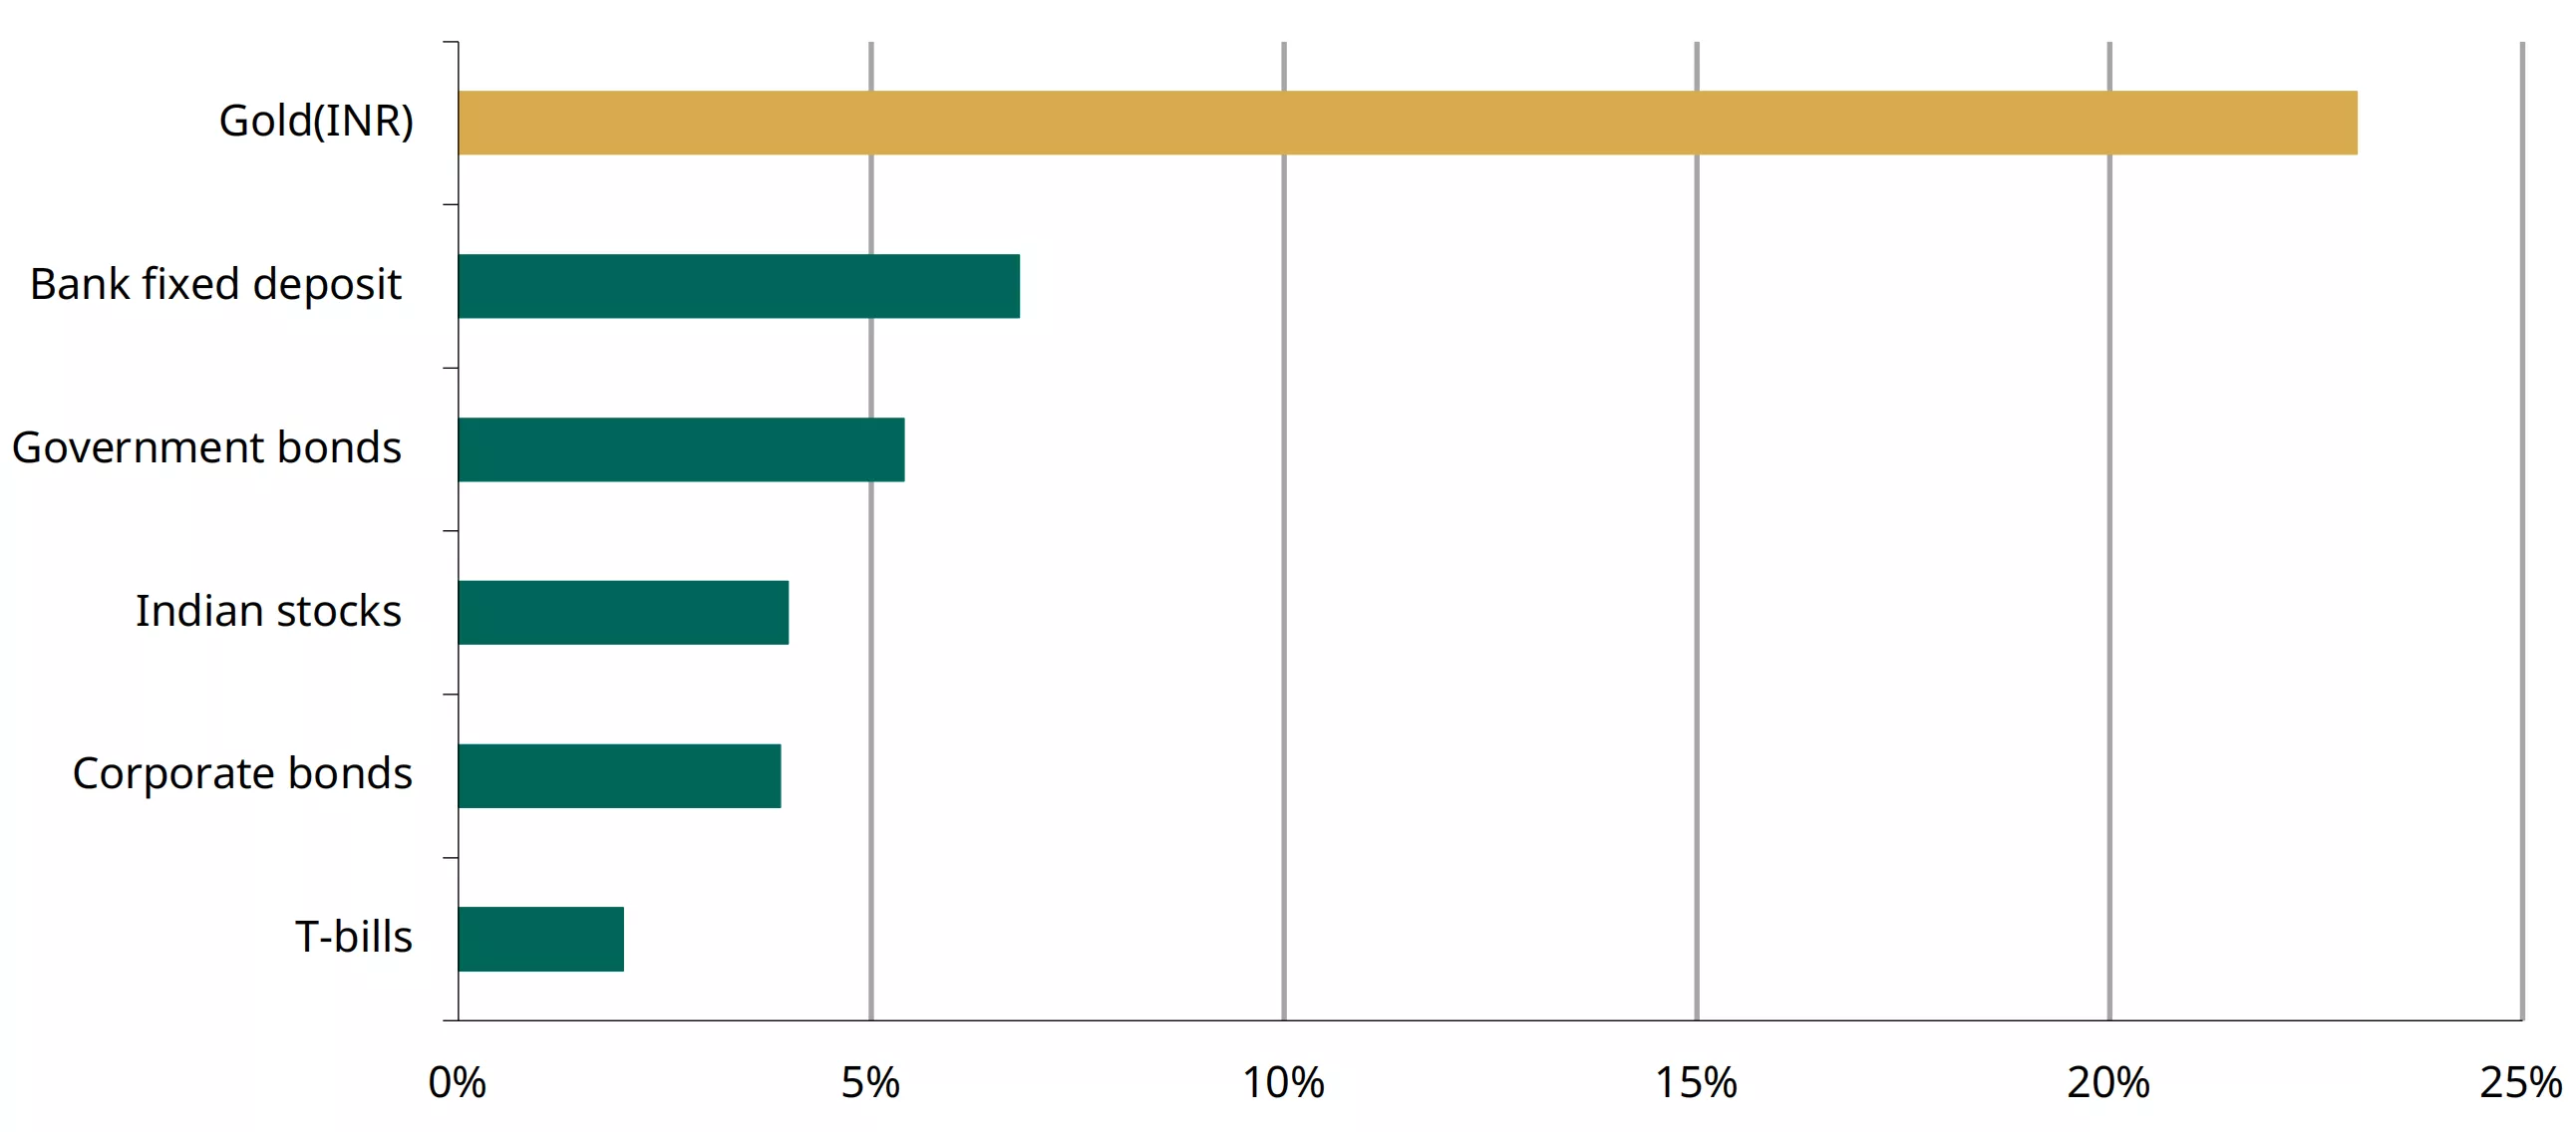
So far in 20252 the LBMA gold price PM in USD has climbed by US$583/oz or 22%, to US$3,192/oz. The Indian domestic spot gold prices3 have also followed a similar trajectory, rising 23% y-t-d to INR93,407/10g. Despite the recent decline, gold outshines other major asset classes on a y-t-d basis (Chart 2).
Chart 2: Gold dominates other asset classes
% year-to-date returns in INR *
*Data as of 14 May 2025. Indices used MCX Gold Index, CRISIL Corporate Bond Index, Nifty Total Return Index, Clearing Corp of India Liquidity Weight T-Bill Index, ICE BofA govt bond index.
Source: Bloomberg, World Gold Council
Festive demand paints a mixed picture
Gold jewellery sales in India during April and early May remained subdued, except on the day of Akshaya Tritiya, due to high and volatile gold prices coupled with broader economic uncertainties. Anecdotal evidence suggests that consumers were deferring their purchases, waiting for price stability, or opting for lighter-weight jewellery to accommodate fixed budgets and need-based buying.
The festival of Akshaya Tritiya, which traditionally drives gold purchases, fell on 30 April this year. Overall demand during the festival was restrained and mixed as per market reports. While large and corporate retailers reported higher footfalls and sales – largely driven by aggressive promotional and marketing campaigns - small and independent jewellers experienced sharp declines in demand. The bullion segment, bars and coins, performed better than jewellery, with low weight coins (especially 5g) proving popular. These were bought as ‘token’ purchases for the festival, with a notable share of sales occurring through online and e-commerce platforms. This behaviour highlights a growing consumer shift towards organised players and investment-oriented gold products.
Regional trends also varied. The southern states recorded stronger sales compared to the other parts of the country, given the greater significance of Akshaya Tritiya is the region. This was followed by a moderate performance in the western parts of the country.
Despite a likely year-on-year decline in the volume of gold sold during Akshay Tritiya, the overall value of sales is expected to have increased, reflecting the nearly 30% rise in gold prices since last year. This indicates a degree of resilience in Indian gold demand.
Additionally, the exchange and recycling of old gold jewellery remained a prominent trend.
Gold ETFs see heavy redemptions, but AUM and investor accounts continue to grow
For the second month in a row, Indian gold ETFs recorded net outflows in April. According to data from the Association of Mutual Funds in India (AMFI), redemptions hit a record high of INR 16.69bn (US$195mn) in April, suggesting profit-taking with gold prices touching fresh record highs during the month.
The momentum of inflows into Indian gold ETFs has slowed significantly since the strong activity seen in January and February. The gross inflows in April stood at INR16.63bn (US$194mn), marking a 50% decline from the average of the first two months of the year. Anecdotal reports suggests that elevated and volatile gold prices have kept many investors on the sidelines. Nevertheless, inflows in April were 58% higher than in March, partially offsetting the impact of the high redemptions. As a result, net outflows in April narrowed to INR0.06bn (US$0.7mn) from INR0.8bn (USD8.9mn) in March. These figures differ from our initial estimates, which were based on preliminary and partial data.4
Notwithstanding the net outflows, the cumulative assets under management (AUM) of gold ETFs rose to INR614bn (~US$7.2bn), up 4% m/m and 87% y/y, aided by the high gold prices. However, collective gold holdings across the 20 gold ETFs declined marginally by 0.07t from a month ago to 64.4t.
Investor interest in this asset class was upheld with 0.18mn new investor accounts (or folios) added during the month. This brought the total number of gold ETF investor accounts to a record 7.1mn.
Chart 3: Gold ETF outflows persist, though at a reduced pace
Monthly gold ETF fund flows in INRbn, and total holdings in tonnes*

*As of end April 2025.
Source: AMFI, ICRA Analytics, CMIE, World Gold Council
RBI’s gold purchases slow; domestic holdings rise
So far this year, the Reserve Bank of India (RBI) has scaled back its gold purchases after the significant additions made in 2024 (73t). In the first four months of 2025, it added a more modest 3.4t, compared to 24.1t during the same period last year. Even so, the RBI’s gold reserves remain at a historic high of 879.6t as of end April-unchanged from the previous month. In value terms, gold now makes up 12% (US$81.8bn) of India’s total forex reserves, marking a 4% increase from a year ago and the highest share on record. This underscores the growing strategic importance of gold in the management of forex reserves.
The RBI's approach to managing its gold reserves continues to evolve. As of March 2025, 58% of its gold – about 512t – is reportedly held domestically, up from 38% in March 2023. The remaining 40% (349t) is stored with international institutions such as the Bank of England and the Bank for International Settlements. Since September, 1.52t have been added to the domestic holdings, while 25t were added to the international holdings.
Chart 4: RBI’s gold stock holds steady at record levels
RBI’s monthly net purchase and reserves, tonnes *

*As of 2 May 2025.
Source: RBI, World Gold Council
Imports resilient amid price headwinds
Notwithstanding the surge in prices to unprecedented levels, gold imports in April remained modest but resilient.
Imports stood at US$3.1bn – nearly a third lower than March but above the January – February average of US$2.5 bn and 5% higher year-on-year, according to Ministry of Commerce data. This points to continued underlying demand, even in a high-price environment, given that gold imports into the country are on consignment basis by nominated banks and agencies. Based on our estimates, import volumes for the month were in the range of 30t – 36t, down from 51t in March and 40t a year ago.
Chart 5: Gold imports show resilience
Monthly gold imports in tonnes and US$bn*
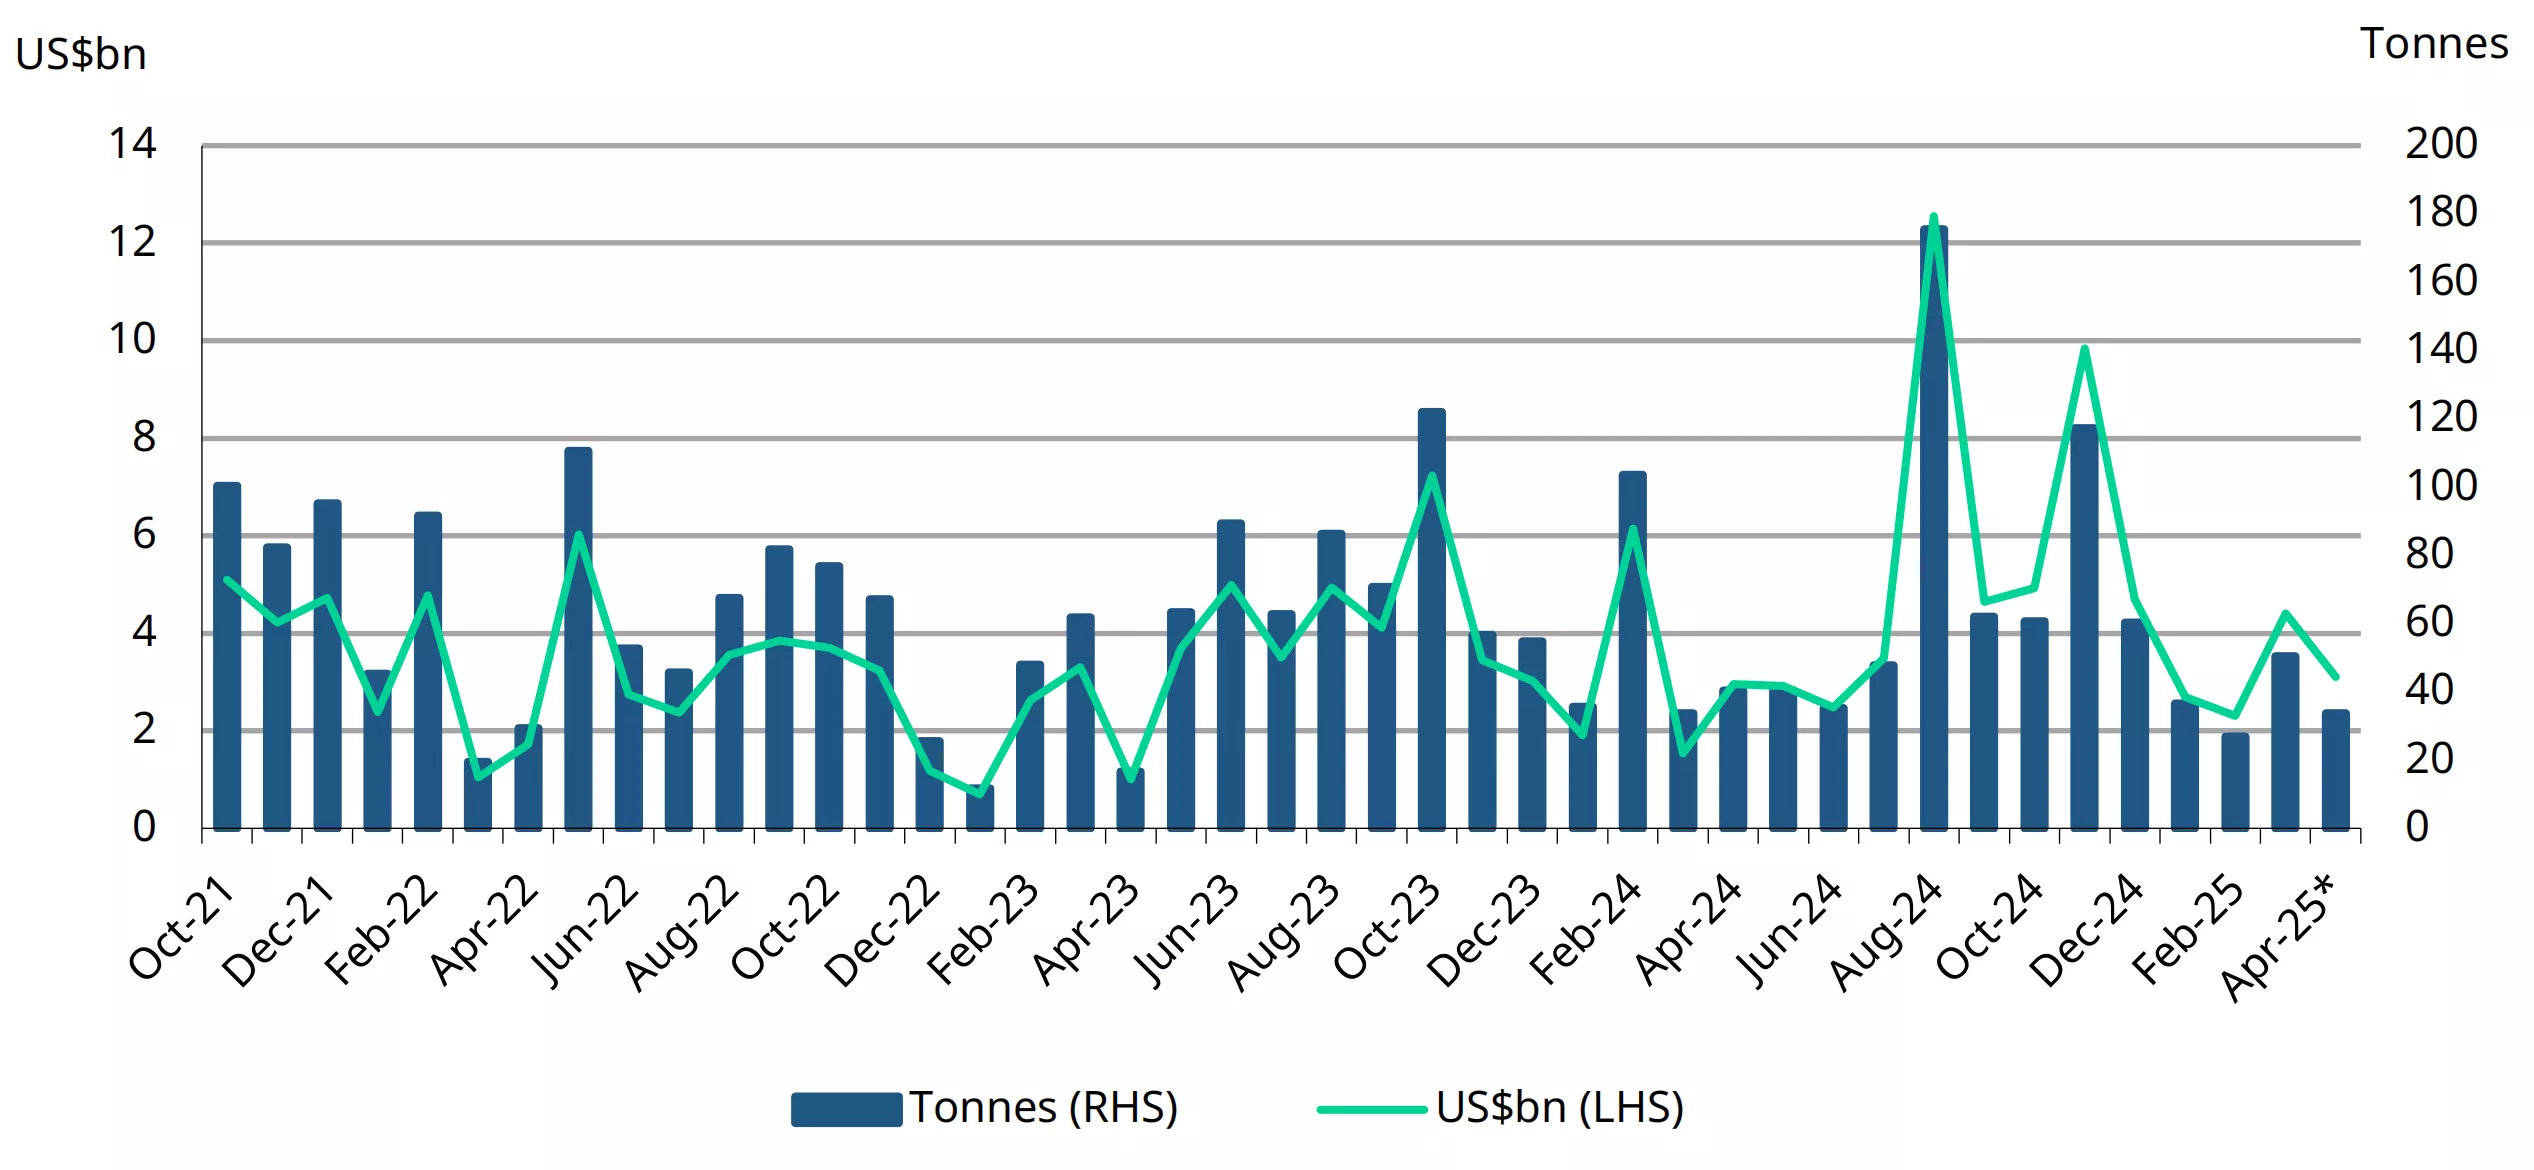
*Includes World Gold Council estimates.
Source: Ministry of Commerce and Industry, CMIE, World Gold Council
Footnotes
1As of 14 May 2025.
2As of 14 May 2025.
3MCX spot gold price.
4Our initial estimate based on partial information available at the time was inflows of US$182mn.
Disclaimer
Important information and disclaimers
© 2025 World Gold Council. All rights reserved. World Gold Council and the Circle device are trademarks of the World Gold Council or its affiliates.
All references to LBMA Gold Price are used with the permission of ICE Benchmark Administration Limited and have been provided for informational purposes only. ICE Benchmark Administration Limited accepts no liability or responsibility for the accuracy of the prices or the underlying product to which the prices may be referenced. Other content is the intellectual property of the respective third party and all rights are reserved to them.
Reproduction or redistribution of any of this information is expressly prohibited without the prior written consent of World Gold Council or the appropriate copyright owners, except as specifically provided below. Information and statistics are copyright © and/or other intellectual property of the World Gold Council or its affiliates or third-party providers identified herein. All rights of the respective owners are reserved.
The use of the statistics in this information is permitted for the purposes of review and commentary (including media commentary) in line with fair industry practice, subject to the following two pre-conditions: (i) only limited extracts of data or analysis be used; and (ii) any and all use of these statistics is accompanied by a citation to World Gold Council and, where appropriate, to Metals Focus or other identified copyright owners as their source. World Gold Council is affiliated with Metals Focus.
The World Gold Council and its affiliates do not guarantee the accuracy or completeness of any information nor accept responsibility for any losses or damages arising directly or indirectly from the use of this information.
This information is for educational purposes only and by receiving this information, you agree with its intended purpose. Nothing contained herein is intended to constitute a recommendation, investment advice, or offer for the purchase or sale of gold, any gold-related products or services or any other products, services, securities or financial instruments (collectively, “Services”). This information does not take into account any investment objectives, financial situation or particular needs of any particular person.
Diversification does not guarantee any investment returns and does not eliminate the risk of loss. Past performance is not necessarily indicative of future results. The resulting performance of any investment outcomes that can be generated through allocation to gold are hypothetical in nature, may not reflect actual investment results and are not guarantees of future results. The World Gold Council and its affiliates do not guarantee or warranty any calculations and models used in any hypothetical portfolios or any outcomes resulting from any such use. Investors should discuss their individual circumstances with their appropriate investment professionals before making any decision regarding any Services or investments.
This information may contain forward-looking statements, such as statements which use the words “believes”, “expects”, “may”, or “suggests”, or similar terminology, which are based on current expectations and are subject to change. Forward-looking statements involve a number of risks and uncertainties. There can be no assurance that any forward-looking statements will be achieved. World Gold Council and its affiliates assume no responsibility for updating any forward-looking statements.
Information regarding QaurumSM and the Gold Valuation Framework
Note that the resulting performance of various investment outcomes that can be generated through use of Qaurum, the Gold Valuation Framework and other information are hypothetical in nature, may not reflect actual investment results and are not guarantees of future results. Neither World Gold Council (including its affiliates) nor Oxford Economics provides any warranty or guarantee regarding the functionality of the tool, including without limitation any projections, estimates or calculations.
