Gold and COVID-19 have found themselves in the same sentence regularly over the last few weeks; the recent outbreak of the virus and subsequent elevation of the situation to a pandemic status by the World Health Organization (WHO) has rocked the global economy. My colleagues at the World Gold Council have blogged about a range of impacts of COVID-19 on gold this month, from the US Federal Reserve’s recent rate cut to the ongoing gold-backed ETF inflows. However, there is another aspect to gold’s role in our society which tends to receive much less attention: it is a critical component in many diagnostic test kits.
So why didn’t gold go up yesterday with all the market turmoil?
10 March, 2020 08:59
Gold’s hidden role in diagnosing disease; COVID-19
Trevor Keel
Consultant World Gold CouncilHaving worked in the healthcare sector for several years prior to joining the mining and metals industry, I have always enjoyed discussing the subtle (and often unknown) links between the two. I consider medical diagnostics to be one of the most important of these links; to cut a long story short, tiny spherical particles of gold have been used as “indicators” in lateral flow assays (LFAs) for over 40 years. You may not recognise the terminology, but ‘LFA’ technology is in everyday use all over the world in staggering numbers. To contextualise this statement, the WHO estimate that 412 million malaria LFAs were sold in 2018, with over 250 million of these purchased and distributed by National Malaria Programmes worldwide.1 Tests are produced for dozens of life-threatening illnesses, meaning that the total annual number of LFAs is likely to comfortably exceed half a billion. And the vast majority of these contain a tiny quantity of gold.2
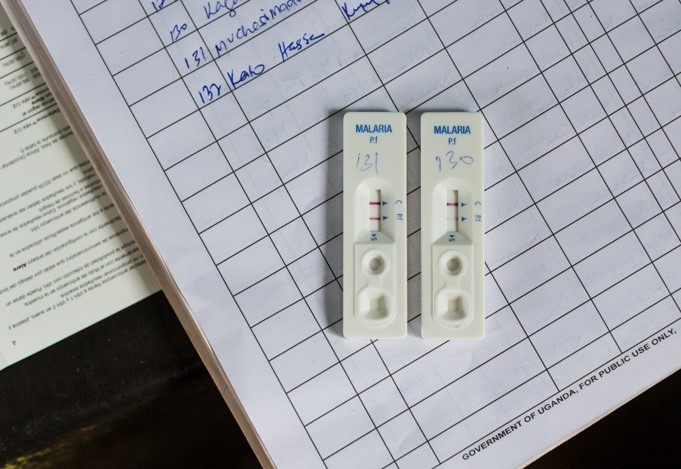
Malaria LFAs in use in Tanzania. LFAs are simple diagnostic tools, which provide a reliable yes/no determination within 15-20 minutes. Tests can be used in any setting, and do not require specialist equipment or administration. The gold particles travel down the test strip with the patient sample (in this case, a single drop of blood) and, if malaria is present, collect on the test line changing the colour to a deep purple. Without the gold, this colour change would not occur, making the outcome of the test impossible to determine visually.
But what has all of this got to do with COVID-19? Well, given the nature of the current pandemic, quick and accurate diagnosis is absolutely critical to help understand, track and tackle the outbreak. There is already a huge range of diagnostic tools available to governments around the world, but these can be limited by two key parameters: speed and cost. Almost all of them require samples to be taken and sent off to a centralised laboratory for analysis which can be slow and expensive, especially during times of crisis.
Fortunately, diagnostics firms have responded resolutely to this pandemic. At the time of writing, the Foundation for Innovative New Diagnostics’ (FIND) COVID-19 database details almost 200 diagnostics which are either commercially available or in development, and they have also announced two evaluation programmes which will help ensure data on the performance of the key tests are available to healthcare authorities worldwide.3 The majority of these tests are lab-based (so-called molecular diagnostics), but increasing numbers of first-generation biomarker LFAs are being registered and evaluated, many of which are gold-based. One of the first companies to do so was US-based BioMedomics, whose COVID-19 rapid test identifies the presence of biomarkers from the body’s immune response to COVID-19 instead of looking for the virus itself, and can help determine if a person has been infected with COVID-19 even after the virus is no longer present. This LFA was utilised in China at the beginning of the outbreak and has now received CE-mark certification for use in Europe,4 is under evaluation by the US Food and Drug Administration (FDA) in the USA5 and the company is reportedly in the process of supplying the Kuwaiti government with 400,000 kits for immediate deployment.6 Companies are also now developing LFAs which can identify the virus directly. For example, leading UK diagnostics firm Mologic recently announced receipt of a large grant from the UK government to develop a COVID-19 LFA.7 Larger companies like Mologic have strong partnerships and supply chains already in place, so the development, manufacture and delivery of new LFA diagnostics can be achieved quickly.
The availability of such diagnostic kits is determined on a country-by-country basis, and the speed to market generally depends on that country’s specific regulatory requirements. However, authorities worldwide appear to be accelerating the route to market for new COVID-19 diagnostics. The FDA, for example, has recently published guidelines to this effect.8
The financial sector has always regarded gold as a safe and stable store of value, particularly during times of stress. Similarly, gold has been the material of choice in the LFA diagnostics space for 40 years because of its unique physical properties, and gold particles are likely to be at the heart of many of the new COVID-19 LFAs we see certified for use around the world in the coming weeks and months. These diagnostics will help to complement lab-based testing, and further equip healthcare professionals and scientists to understand and track the pandemic across a broad range of settings.
Footnotes
1 WHO World Malaria Report 2019. https://www.who.int/publications-detail/world-malaria-report-2019
2 LFAs utilise gold in nanoparticulate form, meaning every test contains a minute quantity of metal. Demand for gold in the sector is effectively immaterial with respect to supply and demand in the wider gold market.
3 FIND, accessed 13 Mar 2020. www.finddx.org/covid-19/
4 Biomedomics webpage, accessed 19 Oct 2022. https://www.biomedomics.com/category/infectious-disease/
5 NCBC news article, accessed 16 Mar 2020. www.ncbiotech.org/news/biomedomics-seeks-fda-ok-covid-19-rapid-diagnostic
6 Kuwait News Agency report, accessed 16 Mar 2020. www.kuna.net.kw/ArticleDetails.aspx?id=2879288&language=en
7 Technology Network article accessed on 18 Oct 2022. https://www.technologynetworks.com/diagnostics/product-news/uk-government-awards-mologic-c1-million-to-develop-rapid-diagnostic-test-for-covid-19-331767
8 FDA COVID-19 update, accessed 16 Mar 2020. www.fda.gov/news-events/press-announcements/coronavirus-covid-19-update-fda-provides-more-regulatory-relief-during-outbreak-continues-help
Heavy selling has been seen across all four precious metals this morning. Gold has dropped
16 March, 2020 11:15
China’s gold market in February: physical demand down, safe-haven demand up
Ray Jia
Head of Research (Asia Pacific, ex-India) and Deputy Head of Trade Engagement (China) World Gold CouncilSummary
- Last month, the RMB Shanghai Gold Benchmark PM (SHAUPM) increased 5.7% compared to the 3% rise in the USD LBMA Gold Price AM.1
- The coronavirus (COVID-19) outbreak supported demand for gold as a safe-haven asset as stocks and commodities fell sharply, leading to:
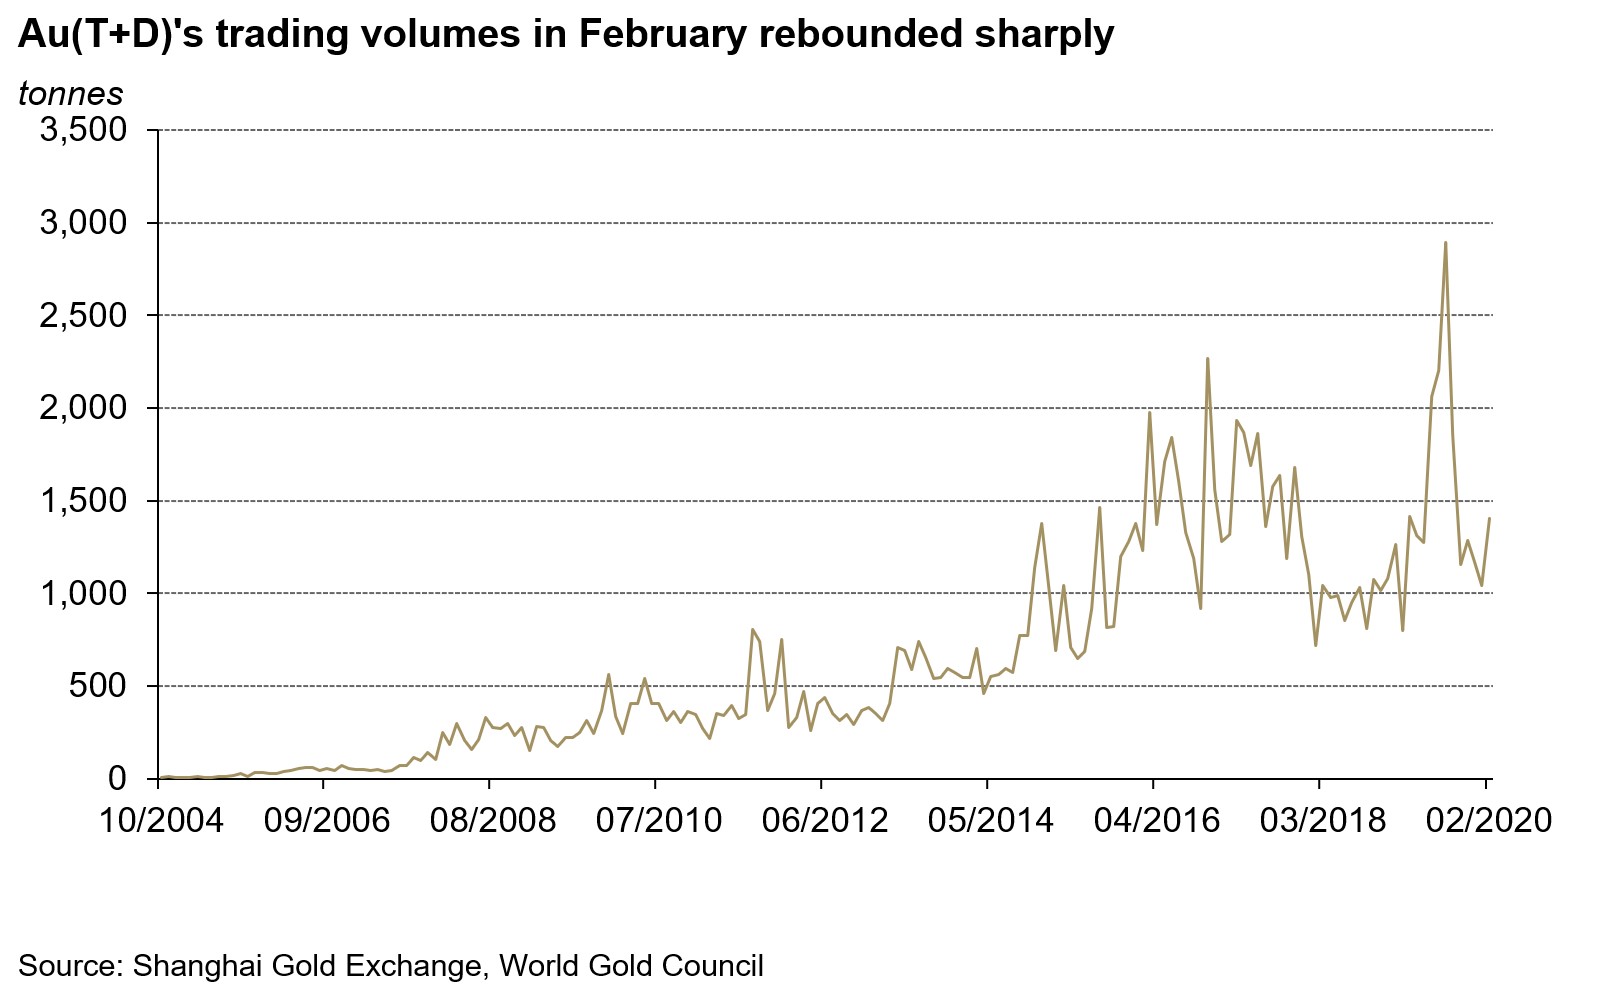
- Au(T+D)’s trading volumes of 70 tonnes (t) per day – the highest level since last September
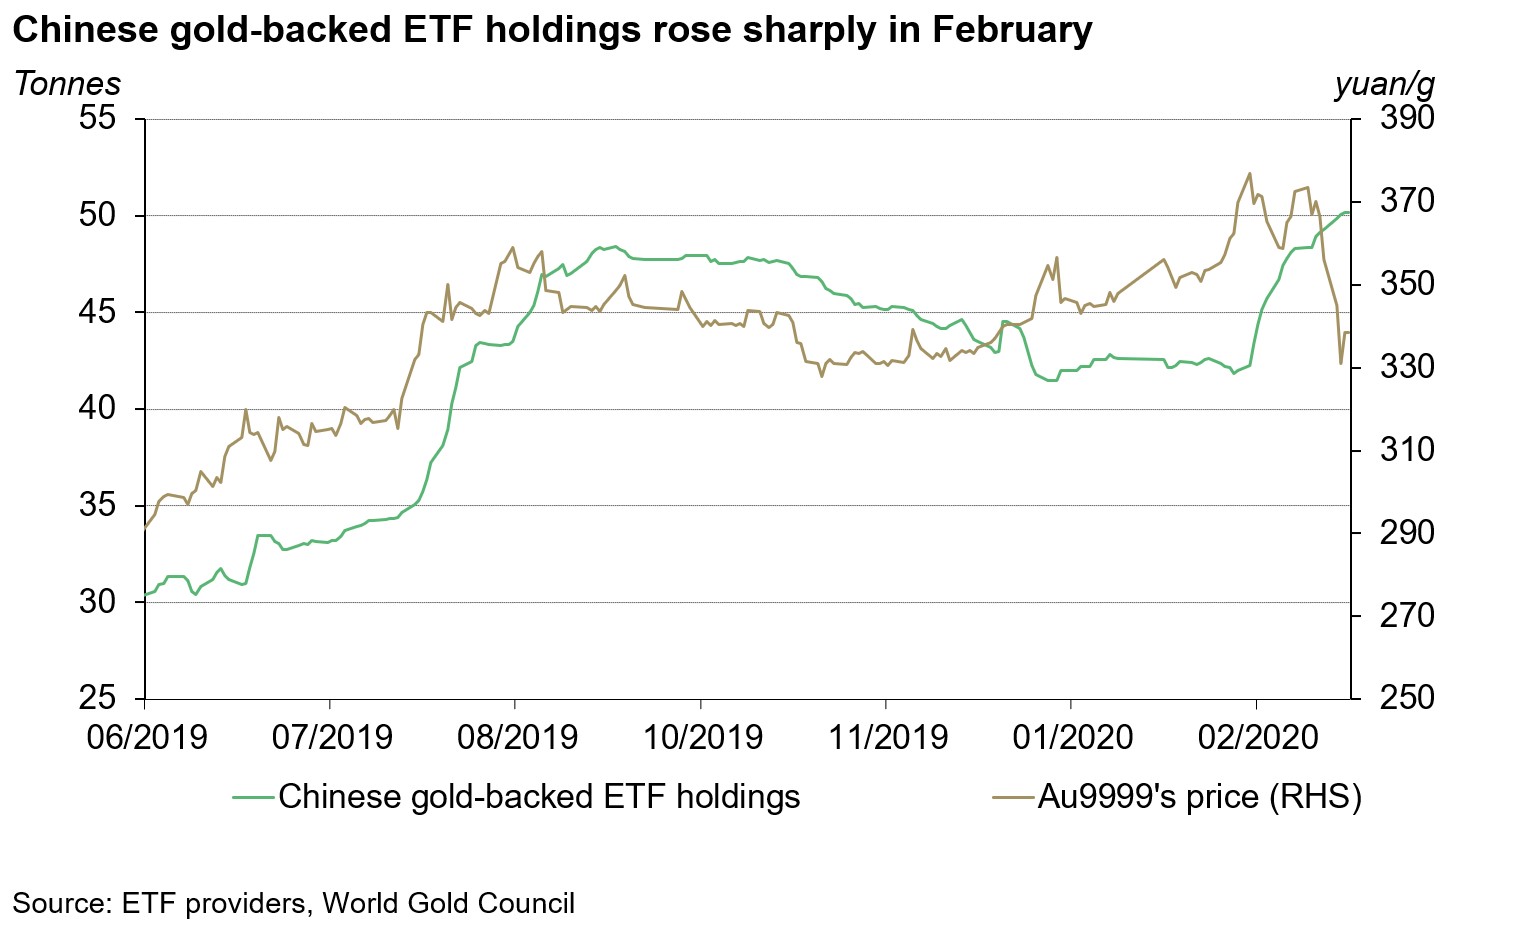
- An increase of more than 3t – or 7% – in holdings of Chinese gold-backed exchange-traded funds (ETFs) during the month. - Au9999’s trading volumes – usually seen as a proxy for physical gold demand – and gold withdrawals from the Shanghai Gold Exchange (SGE) both dropped significantly in February, whereas the Chinese local gold premium turned negative as physical gold demand faltered domestically due to COVID-19 and seasonality factors.2
- The People’s Bank of China (PBoC) kept its gold reserves unchanged at 1,948t in February.
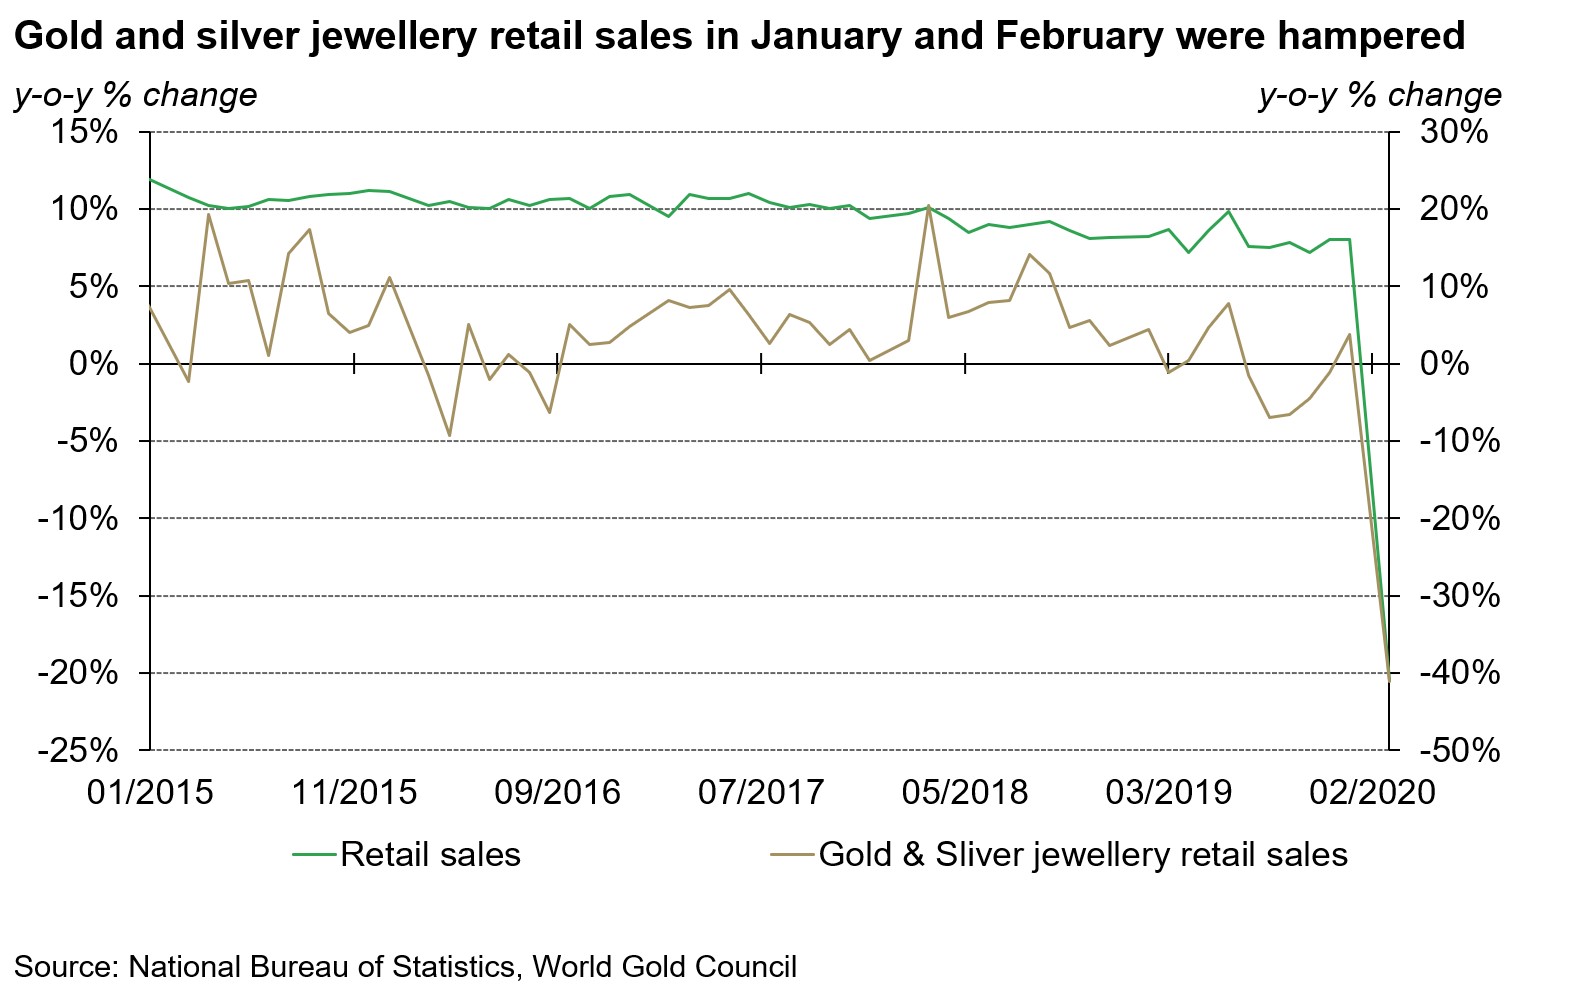
Safe-haven demand following the COVID-19 outbreak after the Chinese New Year (CNY) holiday boosted SHAUPM in February.3 An escalation in the coronavirus outbreak hampered high-risk assets as the Shanghai Stock Composite Index and the Wind Commodity Index both fell by over 3% in the month. As equity and commodity markets plunged, safe-haven demand fuelled the 5.7% rise in SHAUPM. The gold price in USD increased by 3% over this period as concerns about the impact of the coronavirus to the global economy grew and central banks around the globe implemented additional monetary policy measures.
The difference between rises in the SHAUPM and the LBMA Gold Price AM during the month can be explained by:
- In February, the CNY depreciated by nearly 1% against the US dollar;
- Chinese financial markets closed during the last week of January for the CNY holiday when the LBMA Gold Price AM rose nearly 2%.
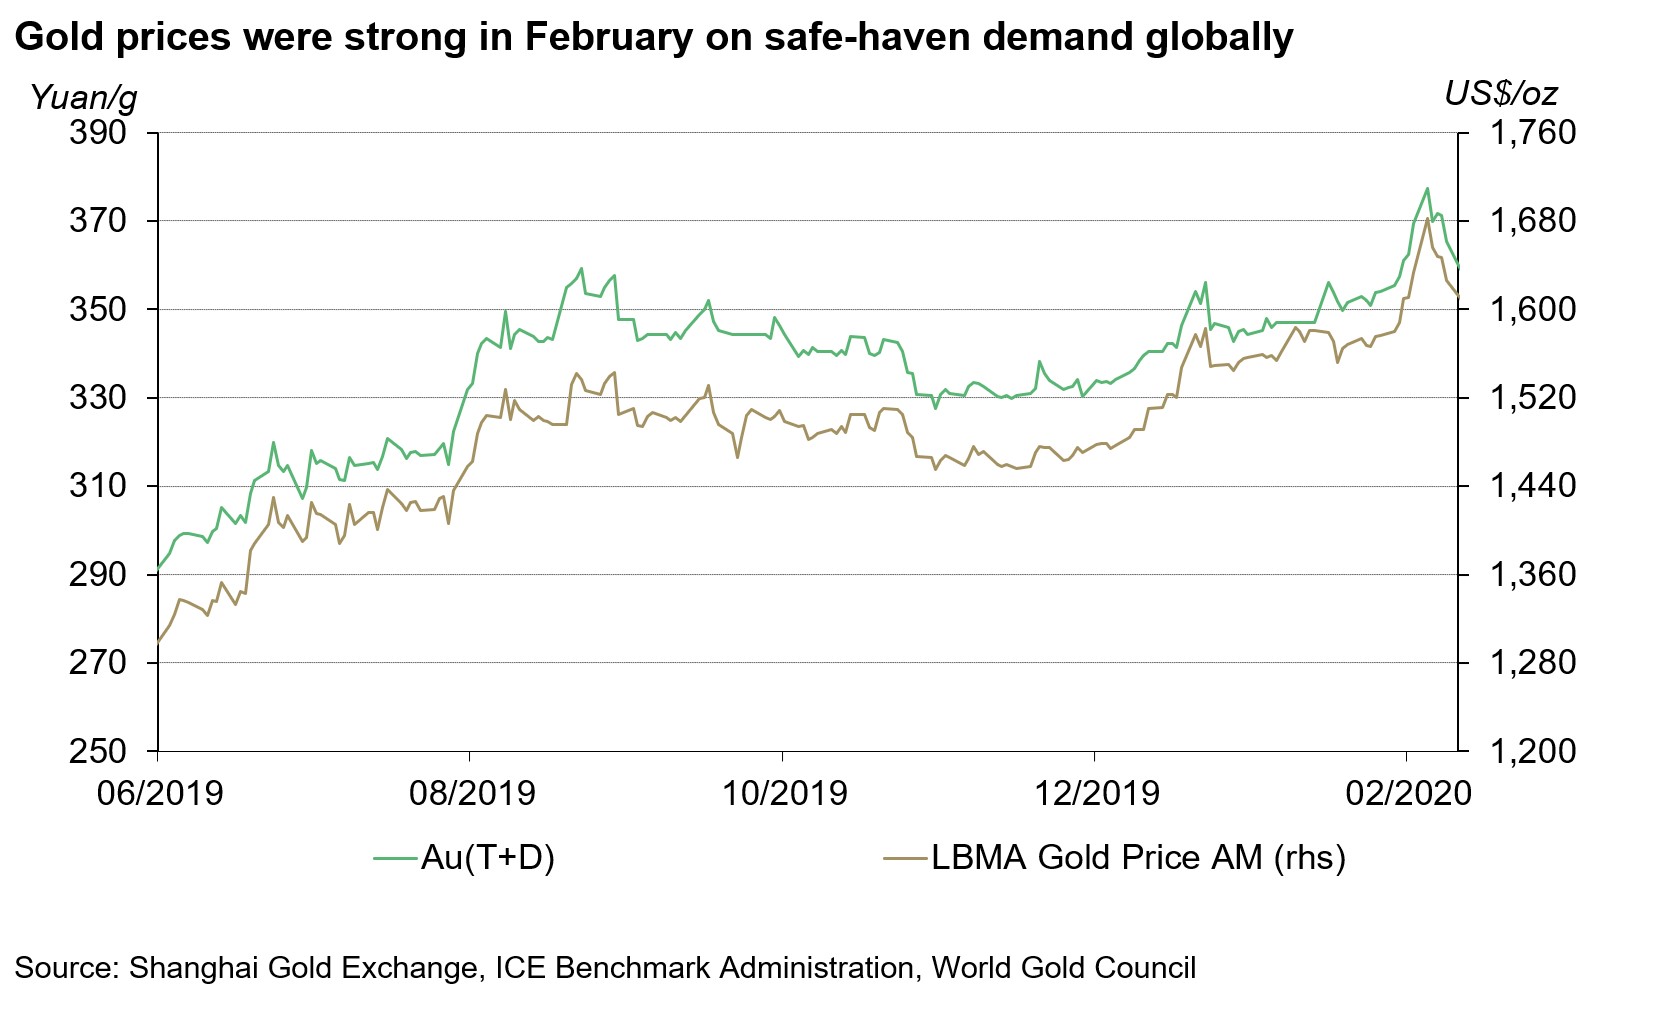
The COVID-19 outbreak clouded China’s economy.4 As the outbreak started to accelerate, China took strict containment measures, including sealing off cities, imposing travel restrictions and delaying the return to work following the CNY holiday.5 With most industries pausing and the public confined to their homes, key economic indicators such as manufacturing and service Purchasing Managers’ Indexes (PMIs), imports and exports were significantly weakened in February. And according to the National Bureau of Statistics, China’s overall retail sales dropped by 21% during the first two months of the year, whereas gold, sliver and gem jewellery sales plunged by 41%.6 The containment measures also caused a shortage in consumer staples, keeping China’s Consumer Price Index (CPI) above 5%, the highest level since 2011.
Investors’ interest in Au(T+D) ran high after the CNY holiday. Au(T+D)’s trading volumes in February totalled 1,402t, or US$3.6bn per day, the highest in five months. Safe-haven demand pushed up Chinese investors’ tactical positioning in February. And this trend has continued in March: investors’ interest in Au(T+D) averaged 198t per day, 1.8 times greater than in February.7
Chinese gold-backed ETF holdings increased by more than 3t in February on rising safe-haven demand, totalling 46t as of 28 February 2020.8 The plunge in equity and commodity markets after the CNY holiday prompted gold’s investment demand, leading not only to higher Au(T+D) trading volumes which tend to be tactical moves, but also to increased strategic allocation to gold ETFs. And Chinese gold-backed ETF holdings have already seen a 3.5t inflow in the first 18 days of March.
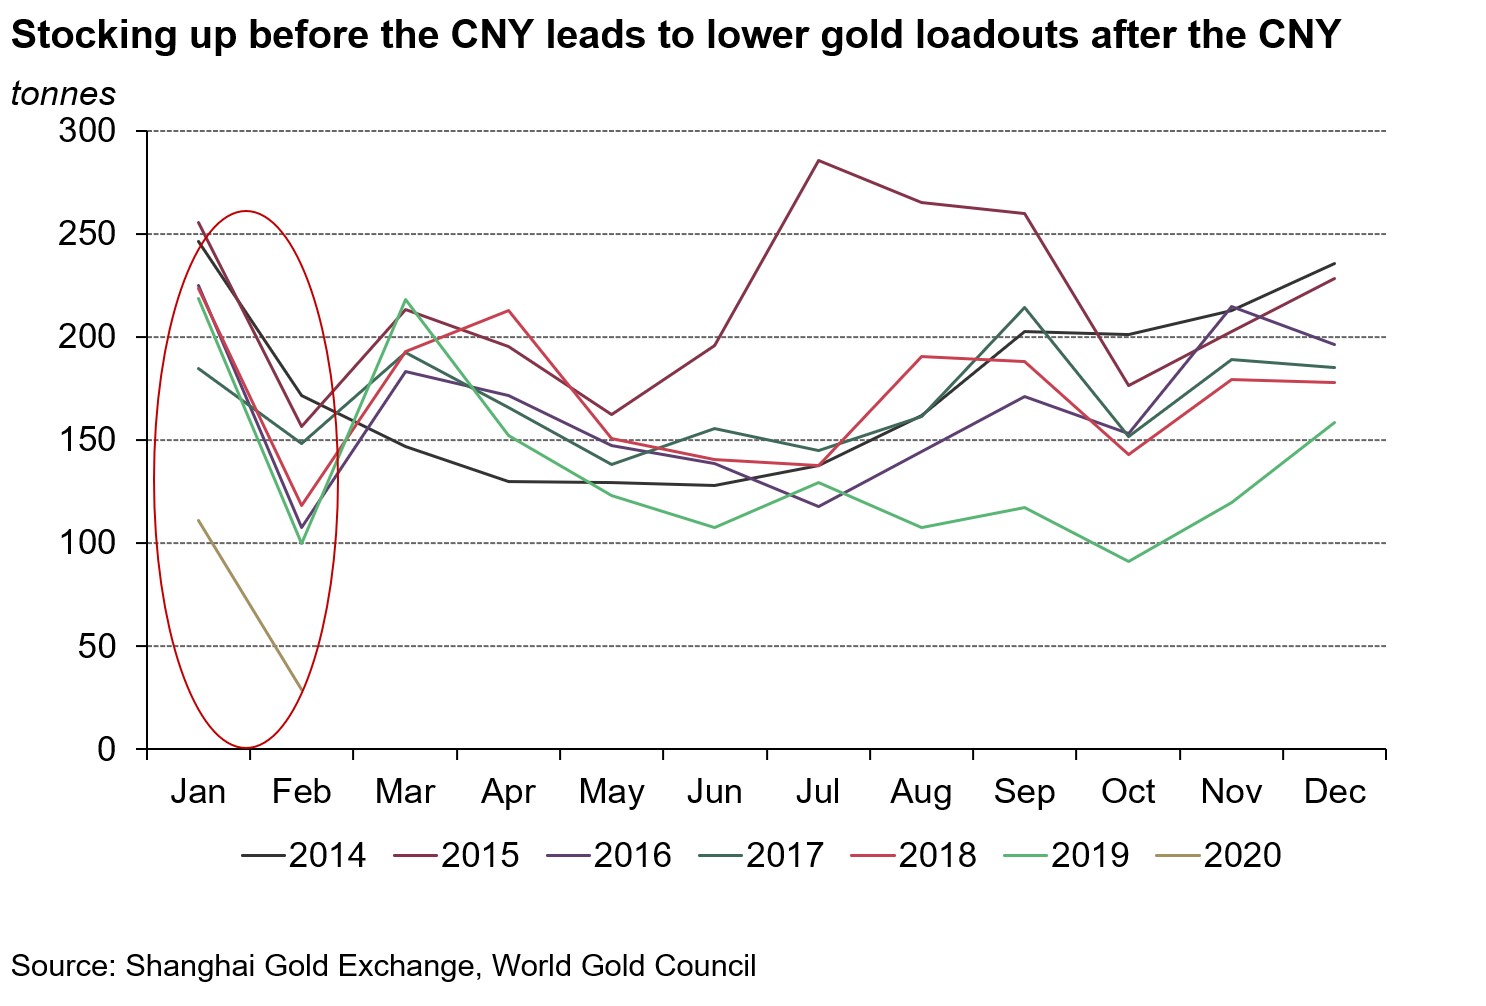
Trading activities of Au9999, a proxy for China’s physical gold demand, fell significantly last month.9 Trading volumes in February stood at 145t, 71% lower than February 2019, which also had fewer trading days.10 While this drop should be partially attributed to the sharp fall in gold retail sales as mentioned above, lower sales mean lower replenishment demand from the supply chain. The tradition of stocking up before the CNY holiday for the following month left retailers with ample inventories especially when the streets were emptied by the COVID-19 outbreak.
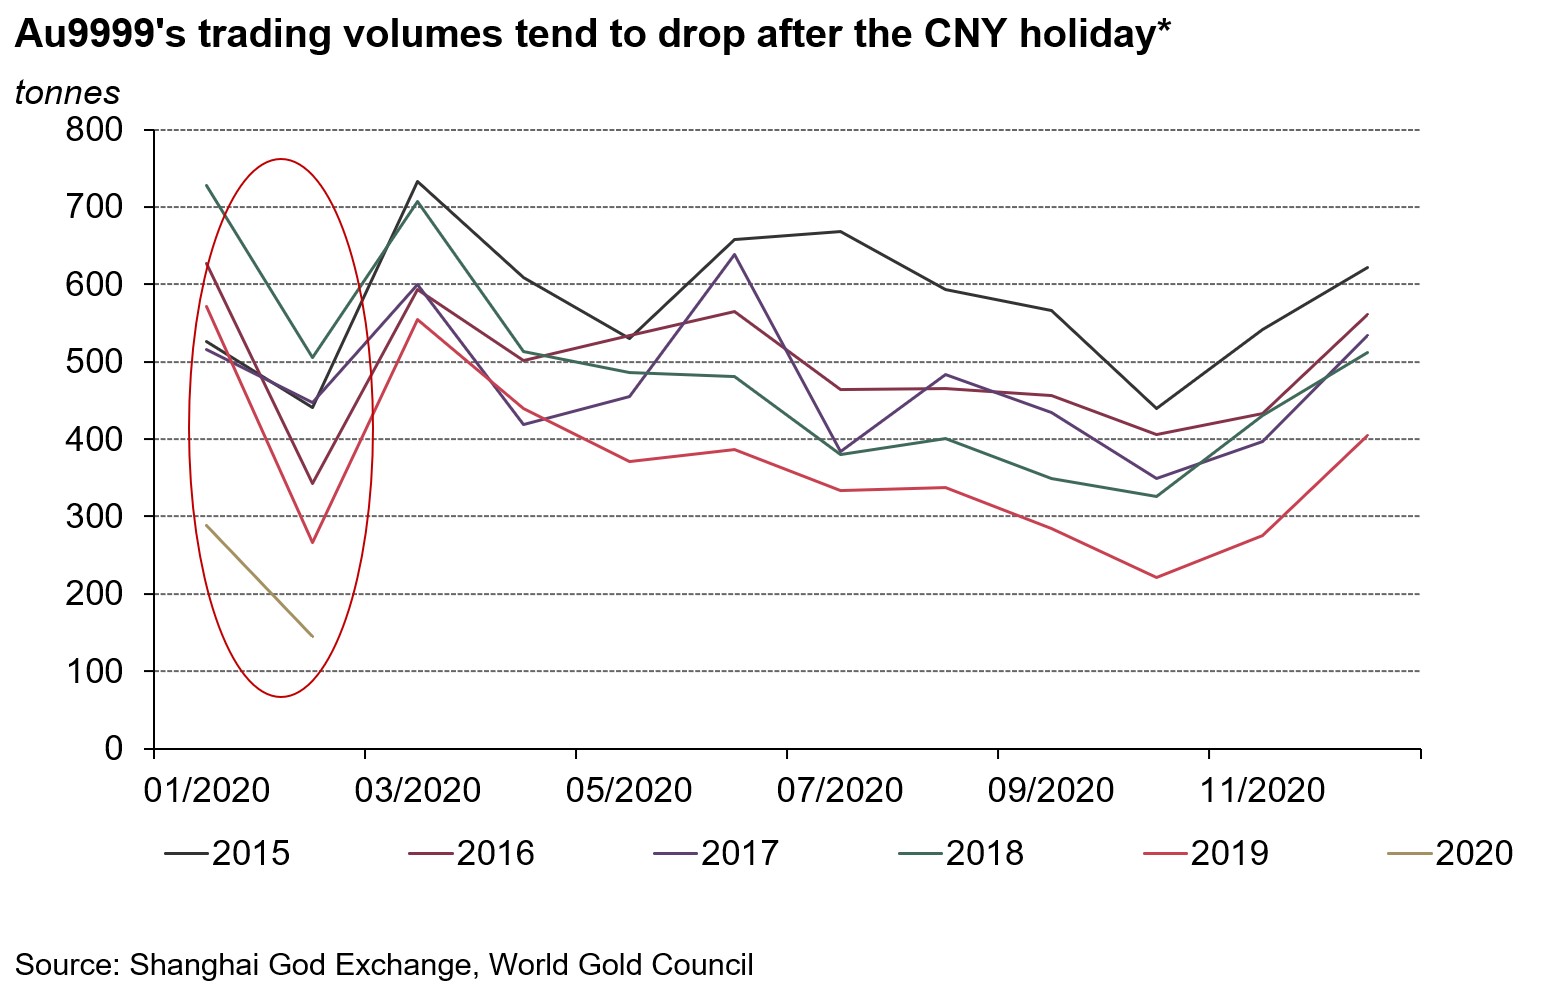
*The CNY holiday always occurs between mid-January and early February.
But there are signs of a rebound in Au9999’s trading volumes. So far in March, Au9999’s average daily trading volumes have amounted to 12t, 61% higher than February’s mean. As the virus is being effectively contained in China, more and more companies in the country’s gold industry are resuming normal operation, slowly improving the physical gold demand.
For the same factors suppressing Au9999’s trading volumes, gold withdrawals from the SGE only totalled 29t in February, 82t lower m-o-m and 89t lower y-o-y.
The Chinese local gold premium dropped sharply in February. Last month, SHAUPM was US$1/oz cheaper than LBMA Gold Price AM on average, the narrowest differential since May 2014. The severely hampered physical gold demand in China during the month was the fundamental factor leading to the local gold-price discount.
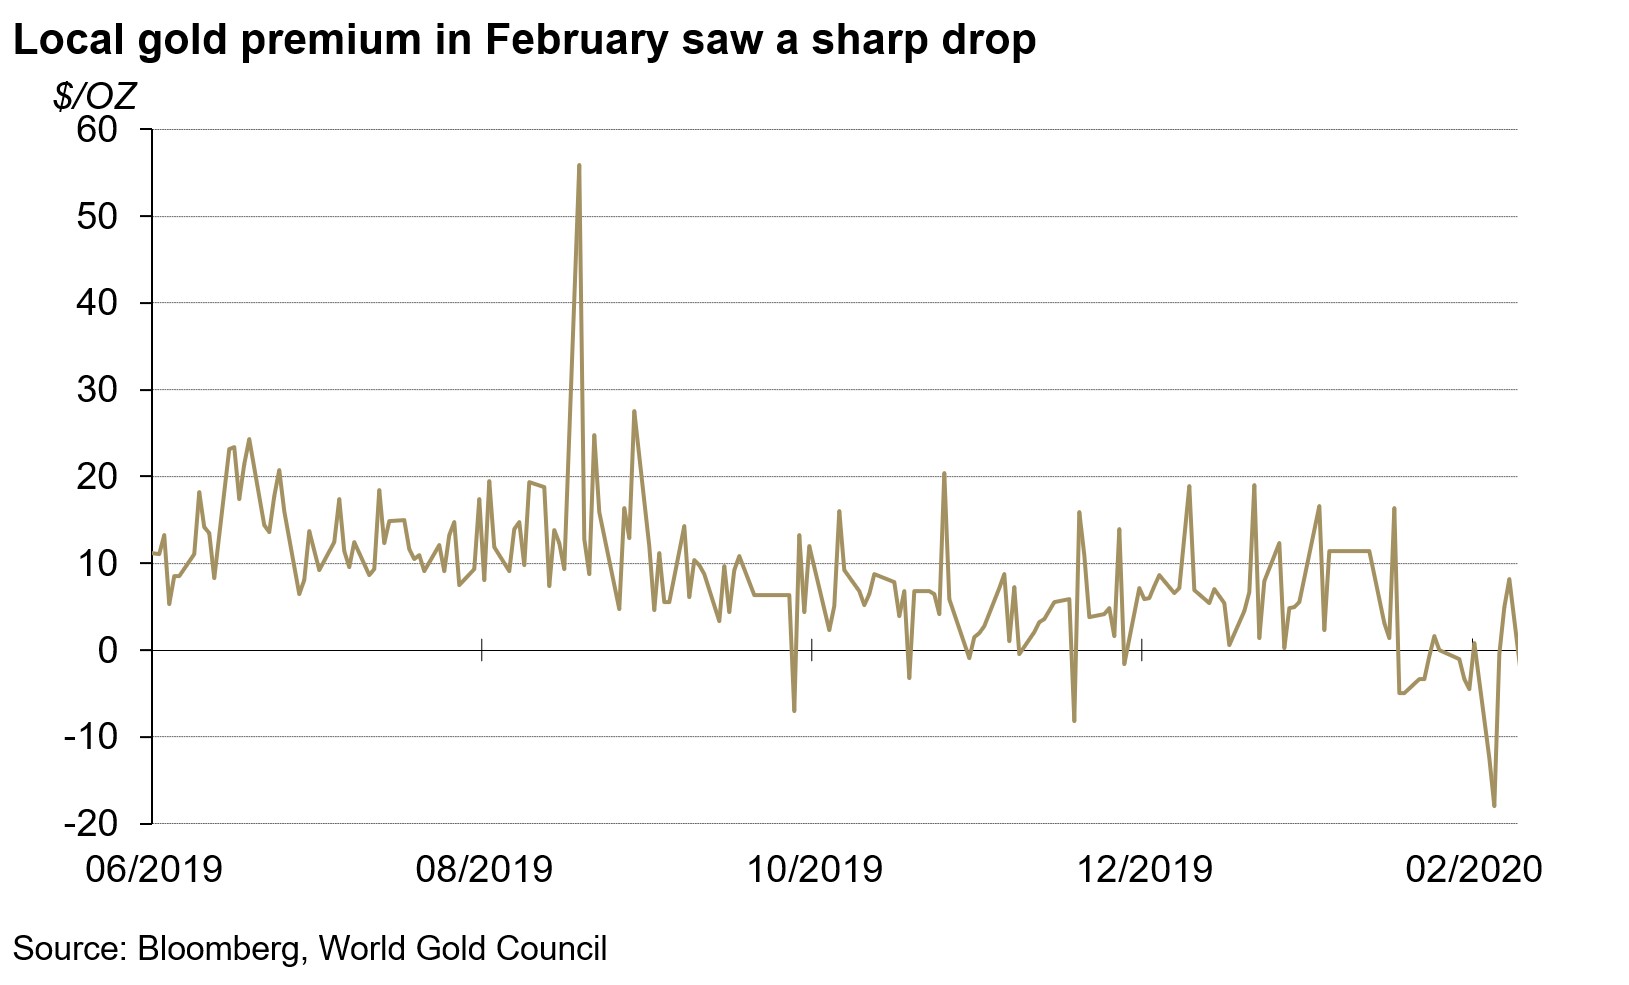
Note: SHAUPM vs LBMA Gold Price AM after April 2014; before that, it was Au9999 vs LBMA Gold Price AM.
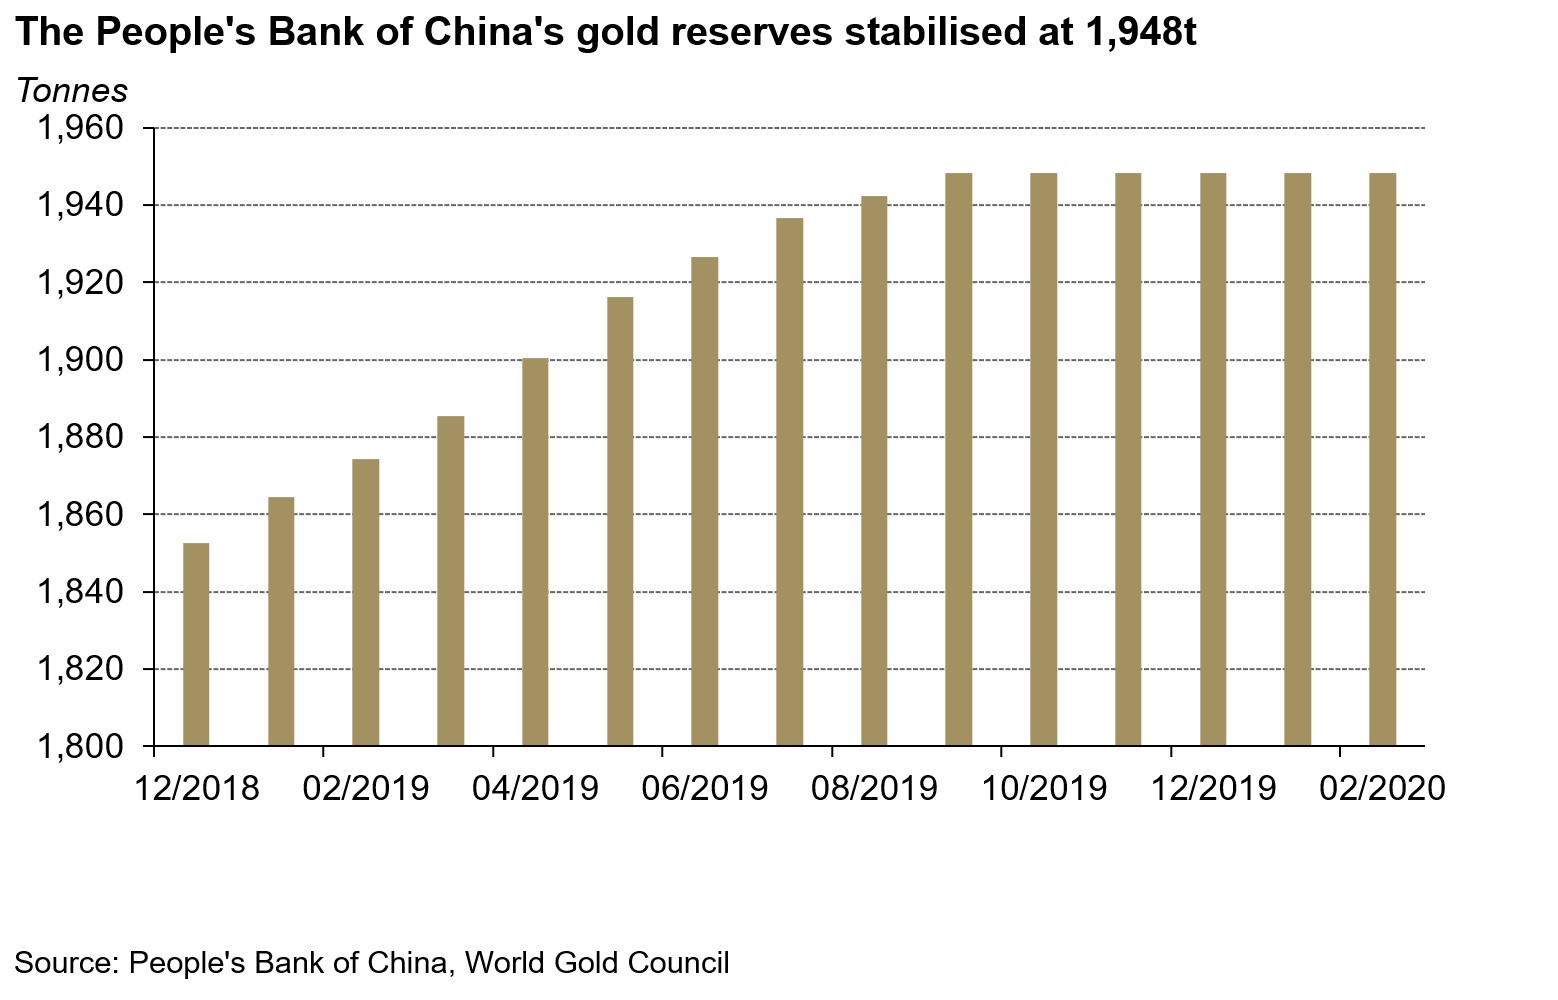
There was no change in the PBoC’s gold reserve in February. While there was a US$88mn decline in China’s total foreign exchange reserves, the gold reserve has remained at 1,948t (3.2% of total reserves) since September 2019.
Footnotes
1 We compare the LBMA Gold Price AM to SHAUPM because the trading windows used to determine them are closer to each other than those for the LBMA Gold Price PM. For more information about Shanghai Gold Benchmark Prices, please visit en.sge.com.cn/data_BenchmarkPrice
2 For more information about premium calculation, please visit www.gold.org/goldhub/data/local-gold-price-premiumdiscount
3 The CNY holiday occurred between 24 January and 2 February 2020.
4 Please visit www.chinadaily.com.cn/a/202001/27/WS5e2a95d9a310128217273202.html for more.
5 The 2020 CNY holiday should have ended on 3 February 2020, but due to virus containment measures, governments extended the holiday and most people chose to work from home. At the time of writing All industries in China are still not in full capacity yet and all schools are closed.
6 Please visit www.stats.gov.cn/english/PressRelease/202003/t20200317_1732694.html for the full retail sales data report.
7 As of 18 March 2020.
8 Excluding Bosera’s I & D shares as it only provides updates at the end of each quarter.
9 For the difference between Au(T+D) and Au9999, please visit www.gold.org/goldhub/gold-focus/2019/06/tale-two-contracts-speculative-investment-physical-demand-down
10 China’s financial markets were closed for the CNY holiday from 4 to 8 February 2019.
Good Morning. #Gold is trading just below $1490/oz on Monday morning in Europe, showing fu
23 March, 2020 08:06
Comex #gold premium to OTC gold has climbed sharply as this chart from Bloomberg shows.O
24 March, 2020 06:51
India’s gold market in February: Strong inflows in gold ETF amid weak consumer demand
Mukesh Kumar
Former Senior Analyst, India World Gold CouncilSummary
- The domestic gold price increased by 4.1% in February m-o-m and 8.4% higher than the end of 2019.
- Rising gold price and higher volatility in the market lured investors towards gold ETFs. With strong inflows of 3.8t in February, the total gold-holdings of Indian gold ETFs touched 20.4t at the end of February.
- Wedding season and stable price supported demand till 18th February, but demand faltered after the spike in domestic price after 18th February. With soft demand, the average discount in the local market widened to US$13-16/oz by the end of the month
Indian stock market plunged on COVID-19 fears
The Indian equity index S&P BSE SENSEX continued the downtrend for the second consecutive month in Februray 2020. The SENSEX plunged 6% over the month amid rising concerns over the spread of the COVID-19 outside China. The MCX iCOMDEX- India’s leading commodity index, followed the downward trajectory and also fell by 6% in February. The Indian rupee depreciated by 1% against the US dollar to a six month low of Rs 72.18/USD at the end of February. Against such a backdrop, foreign institutional investors (FIIs) continued to be net buyers of Indian equities in February but the inflows hit a six month low at Rs 18 billion (85% lower m-o-m). (Chart 1).
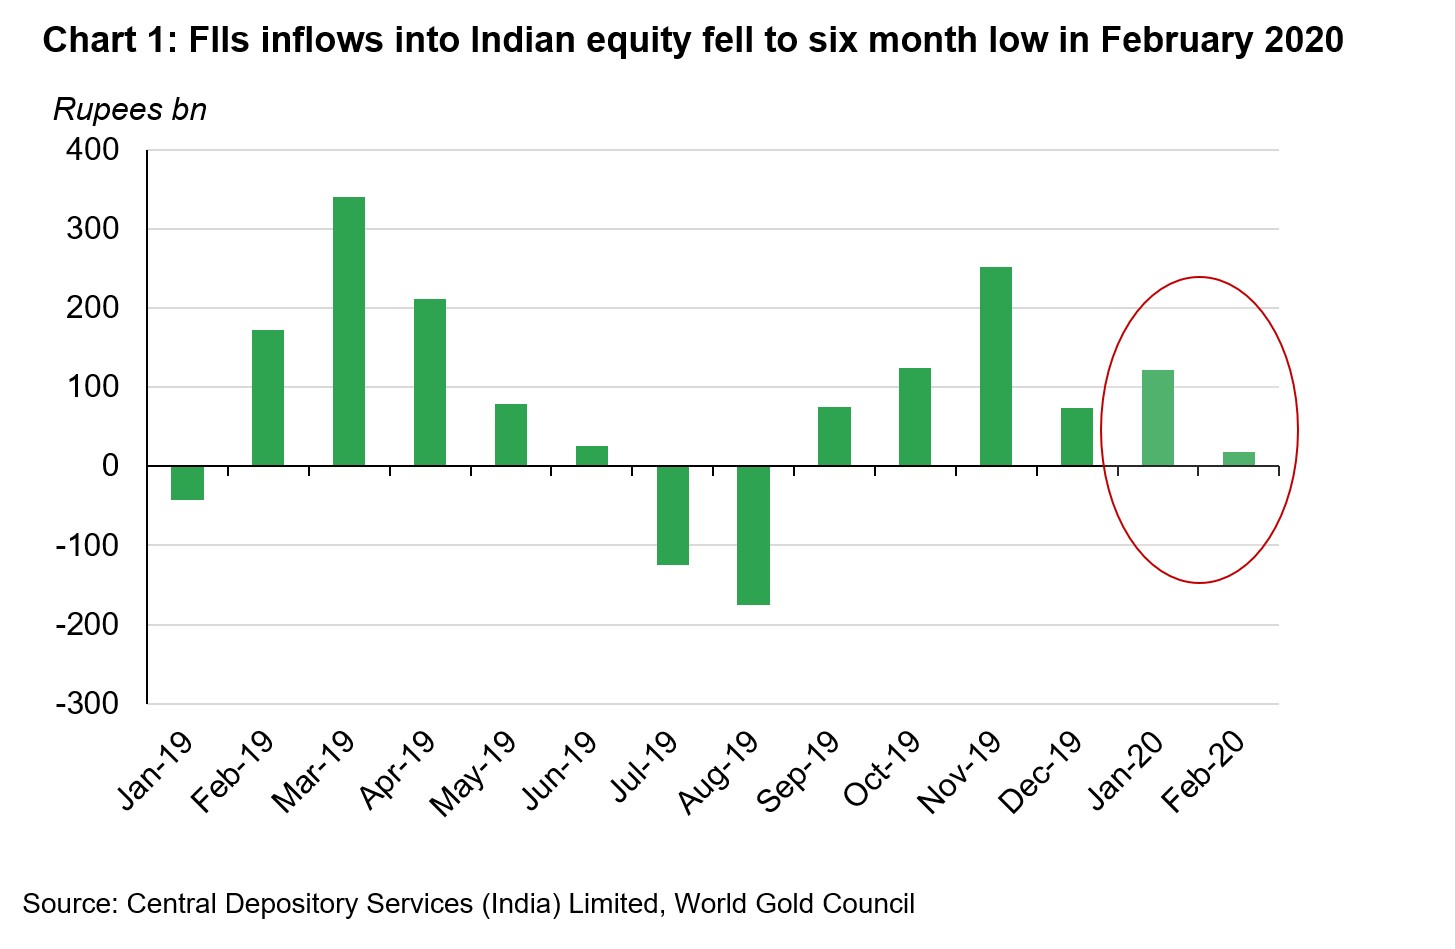
Rising gold price and volatility in the market lured strong inflows into gold ETFs amid weak consumer demand
The heightened US-Iran tensions and easing monetary policy stance by central banks in response to the virus outbreak supported the gold price. The MCX Gold Spot (995 fineness) in INR ended the month 4.1% higher than at the end of January, outperforming the LBMA Gold Price AM in USD (+2.9%) over the same period as the rupee weakened against the dollar.1
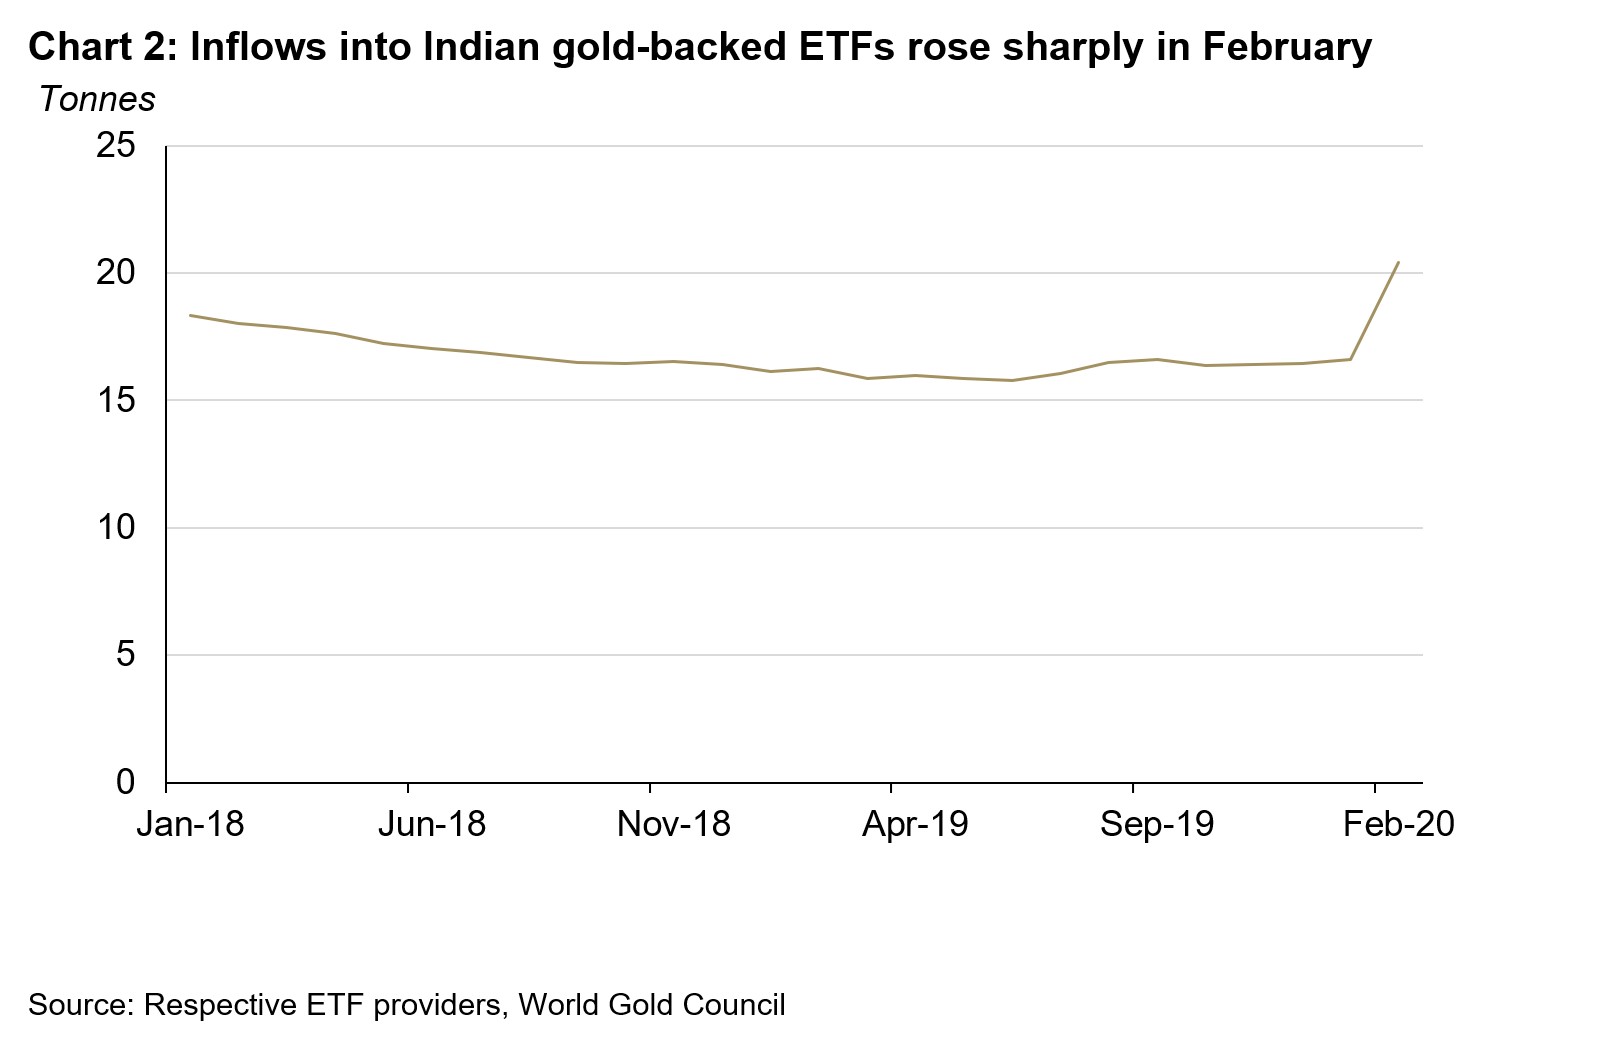
With the outbreak of COVID-19, the volatility index in the market rose sharply after middle of February jumping from 13.4% to 23.2% over the final two weeks.2 The rising volatility along with higher gold price lured investors towards gold-backed ETFs- a flight towards safe haven. Inflows into gold-backed ETFs rose by 3.8 tonnes in February ending at 20.4 tonnes in February (Chart 2).
MCX Gold Spot price (995 fineness) remained stable around Rs 40,700/10gm in first half of February. A stable gold price together with an active wedding season supported demand in the first two weeks of December. Demand started to falter after the sharp rise in gold price after 18th February where gold price increased by 3.4% by the end of the month.3 With the gold price rising, consumers preferred gold-to-gold exchange rather than fresh purchases. Gold-to-Gold exchange accounted for ~ 45-50% of the retail purchase volumes in February. The average gold price was 24% higher y-o-y in February, keeping a lid on retail gold volumes and consumer demand.
Sentiment at India International Jewellery Show (IIJS) Signature 2020 was weak T
he sentiment at India International Jewellery Show (IIJS) Signature 2020 (B2B event) held between 13-16 February was weak. For the domestic market, retailers placed orders for light-weight jewellery pieces (machine made bangles and necklaces) but orders for heavy and bridal jewellery were muted. For the exports market, manufacturers who received orders from retailers in UAE and Turkey confirmed a rising number of order cancellations due to sudden spike in gold price and outbreak of COVID-19.
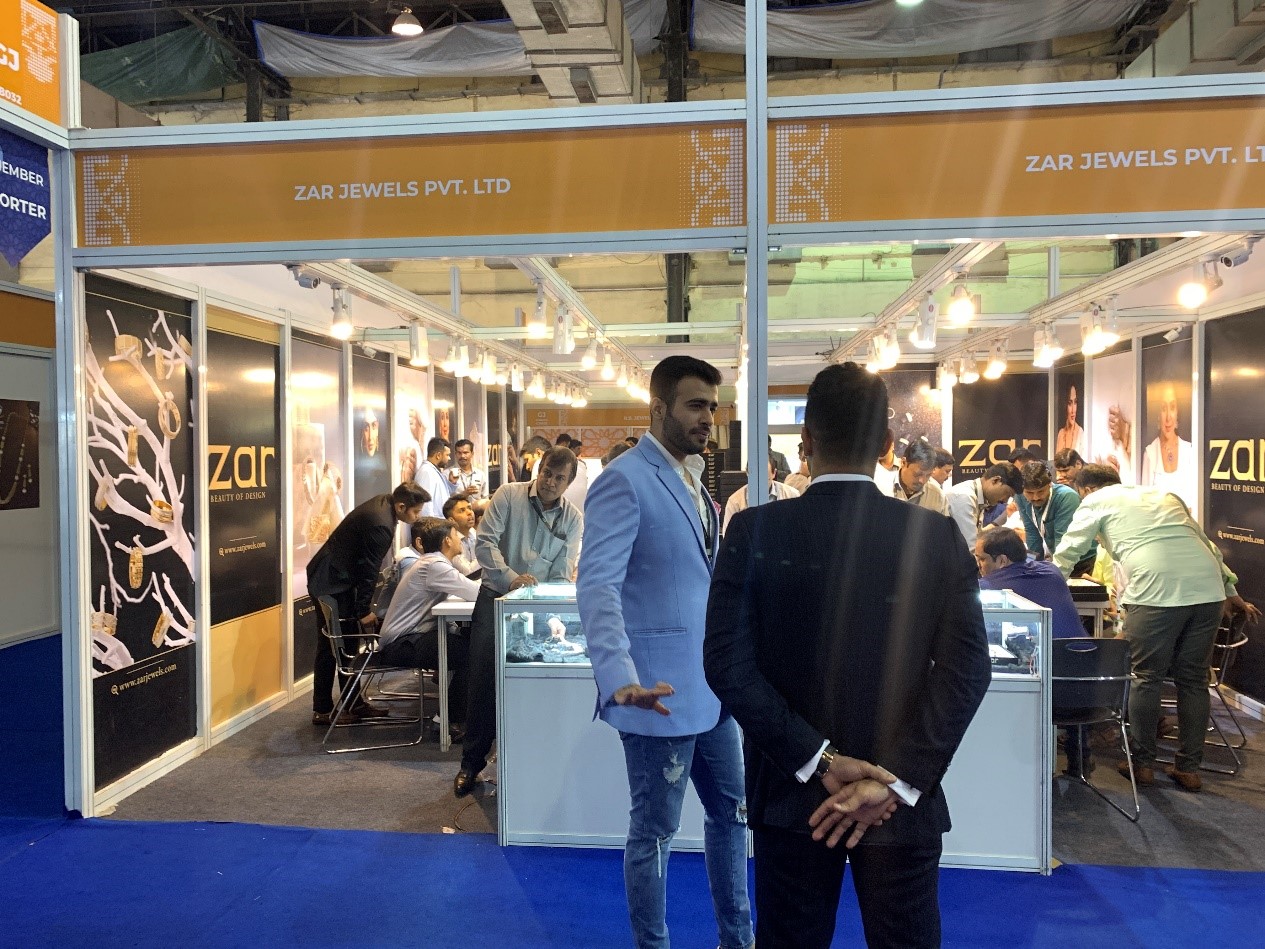
ZAR Jewels Pvt. Ltd booth at IIJS Signature 2020. ZAR Jewels Pvt Ltd is a leading manufacturer and exporter of machine-made bangles
Discount in the local market widened in the month
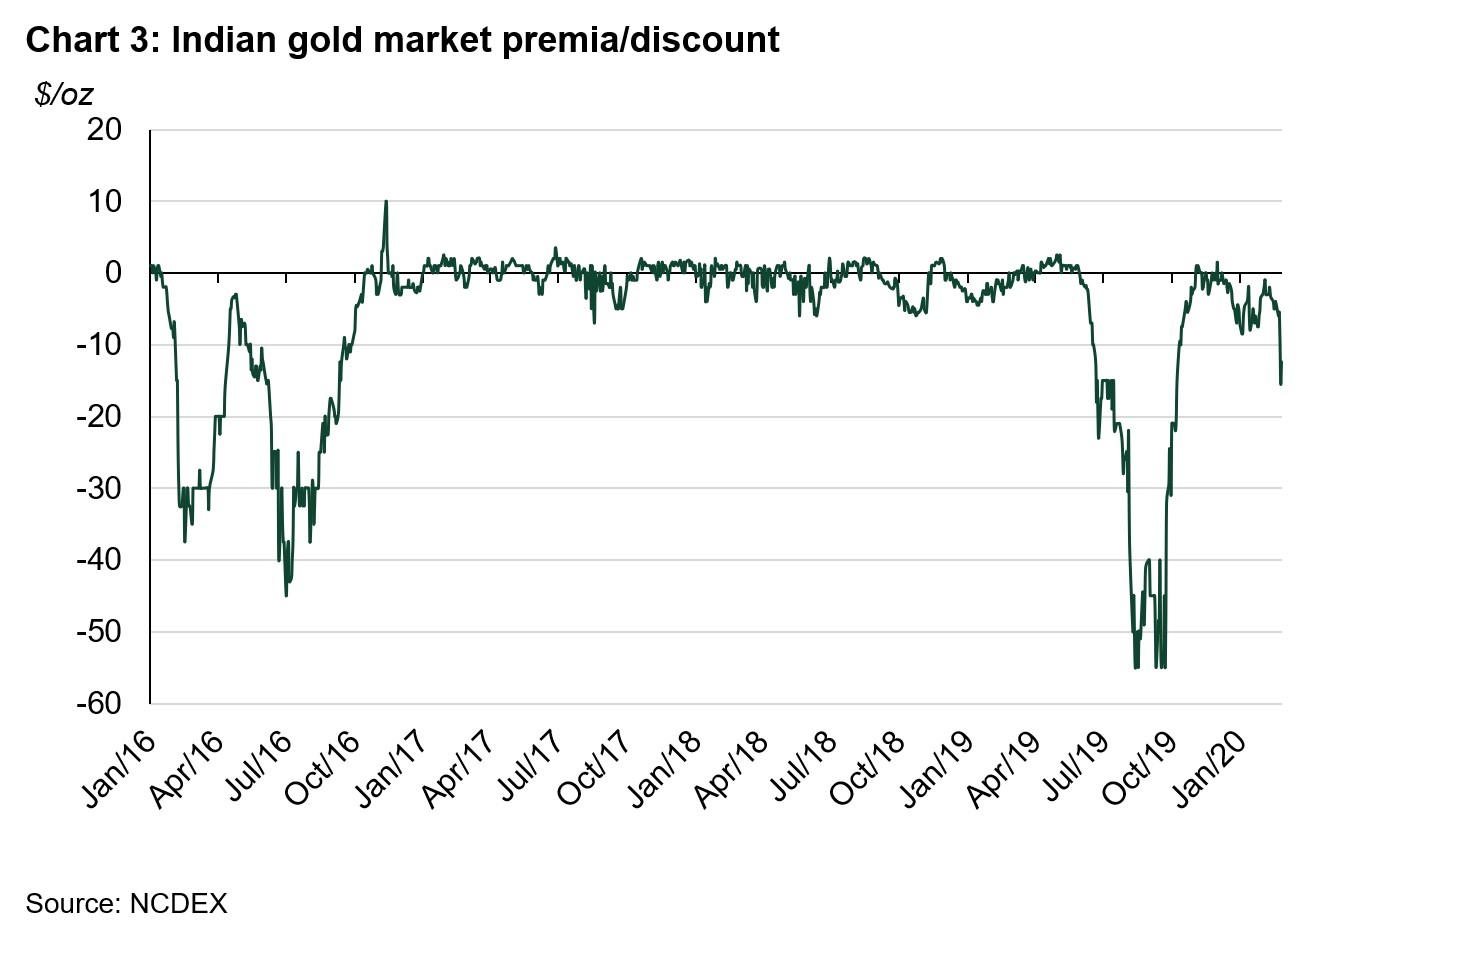
With rising gold price and lower number of wedding days after 18th February, physical demand started to gradually weaken until the end of the month. The discount in the local market widened to US$13-16/oz by end of February from an average discount of US$3/oz before the 18th February 2020 (Chart 3).
Imports were higher m-o-m
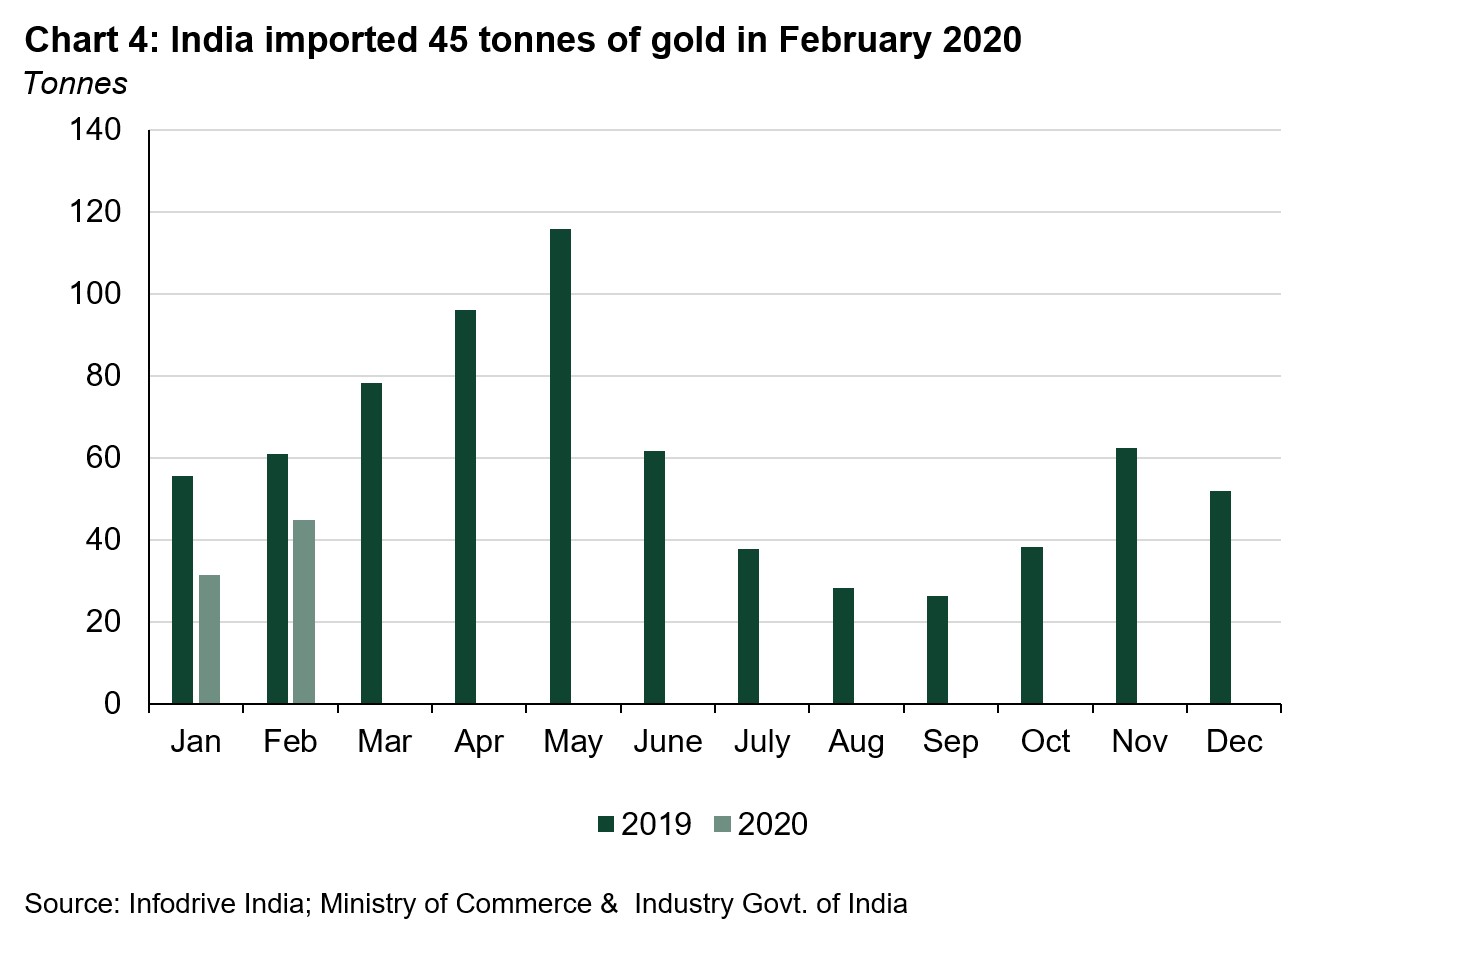
Indian gold imports totalled 44.8t in February 2020 – 42% higher m-o-m but 26% lower y-o-y (Chart 4). A total of 9 banks, nominated agencies and exporters imported 25.4t of bullion during the month, 15 refineries imported 19.4t of gold doré (fine gold content).
Footnotes
1 We compare the LBMA Gold Price AM with MCX Gold Spot price as their trading hours are closer to each other than the most commonly referenced LBMA Gold Price PM.
2 India VIX (NSE) is volatility index based on NIFTY Index option prices.
3 As per Hindu wedding dates, there were 9 auspicious wedding dates in February. There were 6 wedding dates from 3rd to 18th February and only 3 wedding dates were after 18th February.
Gold ETF assets realised their largest ever quarterly gain in Q1 2020
Adam Perlaky
Former Senior Analyst, Americas World Gold CouncilToday we released our analysis on gold-backed ETF flows for the first quarter of 2020, as well as the month of March.
Q1 2020 highlights
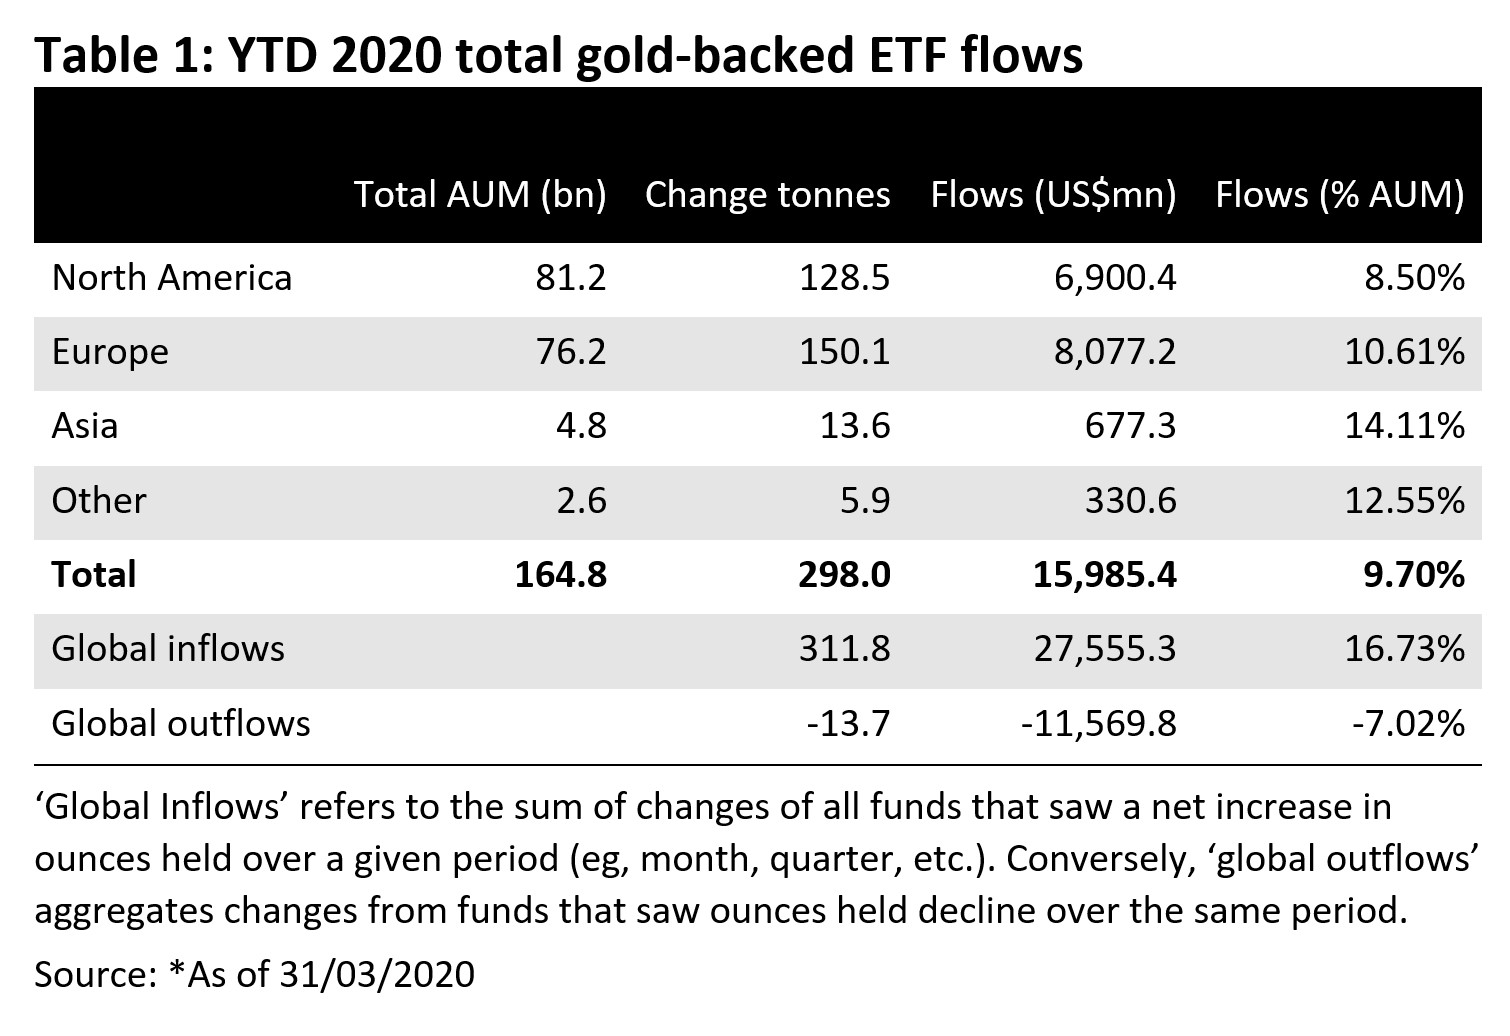
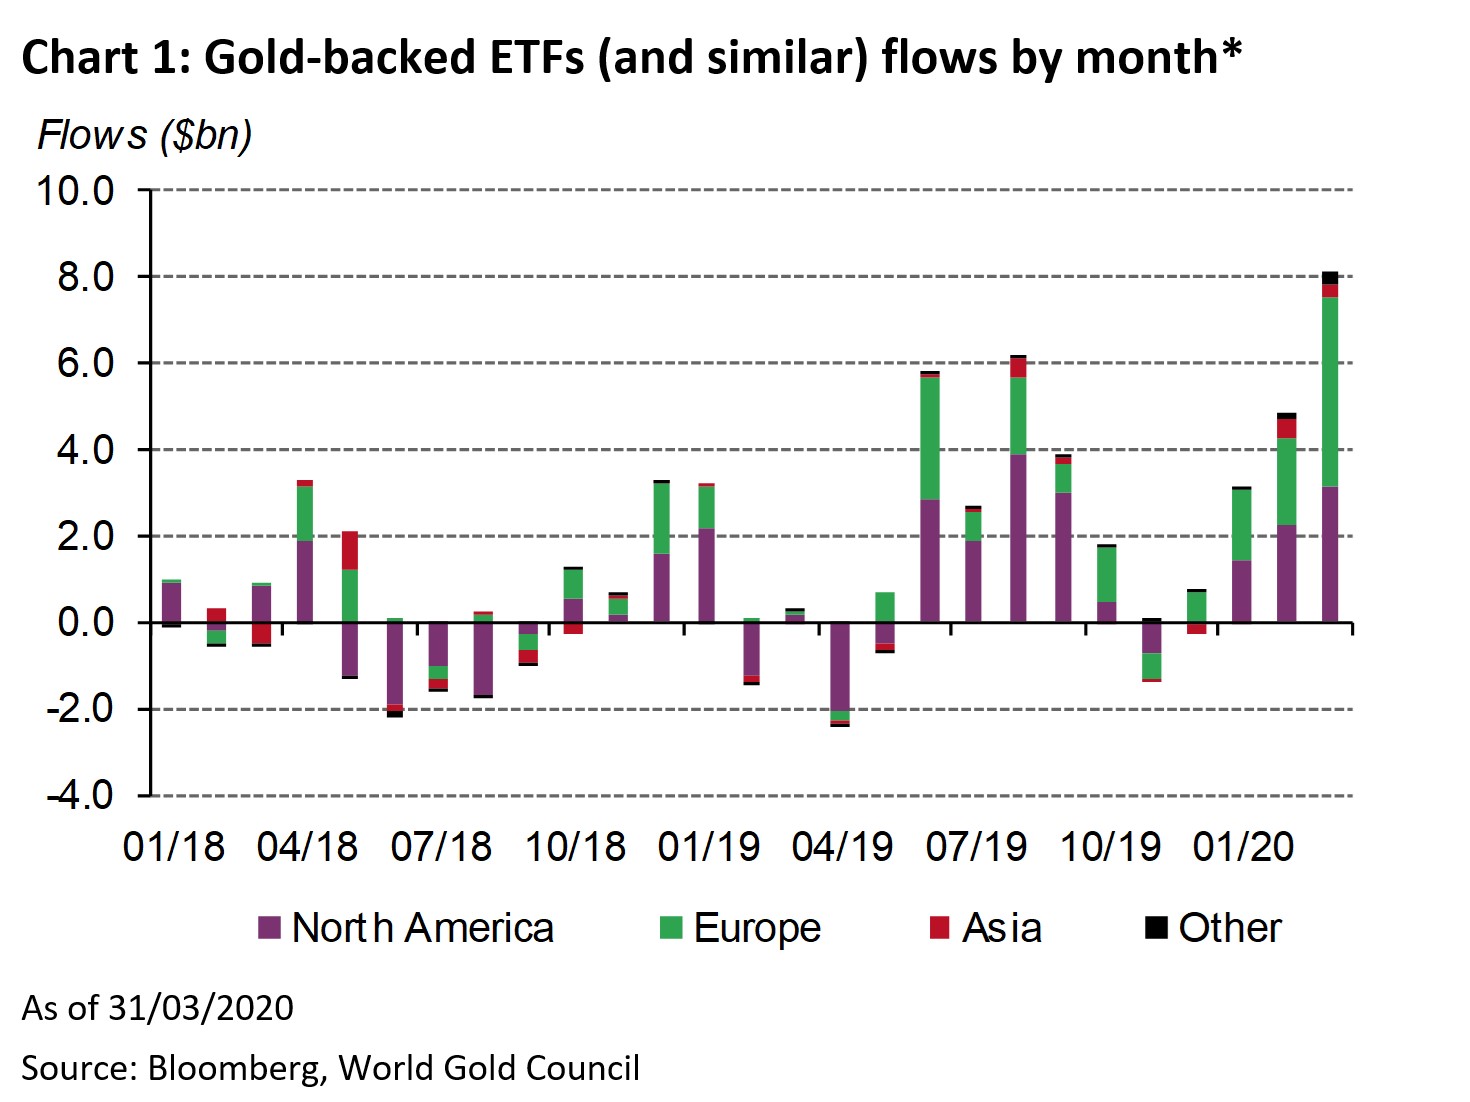
- Global gold-backed ETFs (gold ETFs) and similar products added 298 tonnes(t), or net asset growth of US$23bn, across all regions in the first quarter of 2020 – the highest quarterly amount ever in absolute US dollar terms and the largest tonnage additions since 2016.
- During the past year, gold ETFs added 659t, the highest on a rolling annual basis since the financial crisis, with assets under management (AUM) growing 57% over the same period.
March highlights
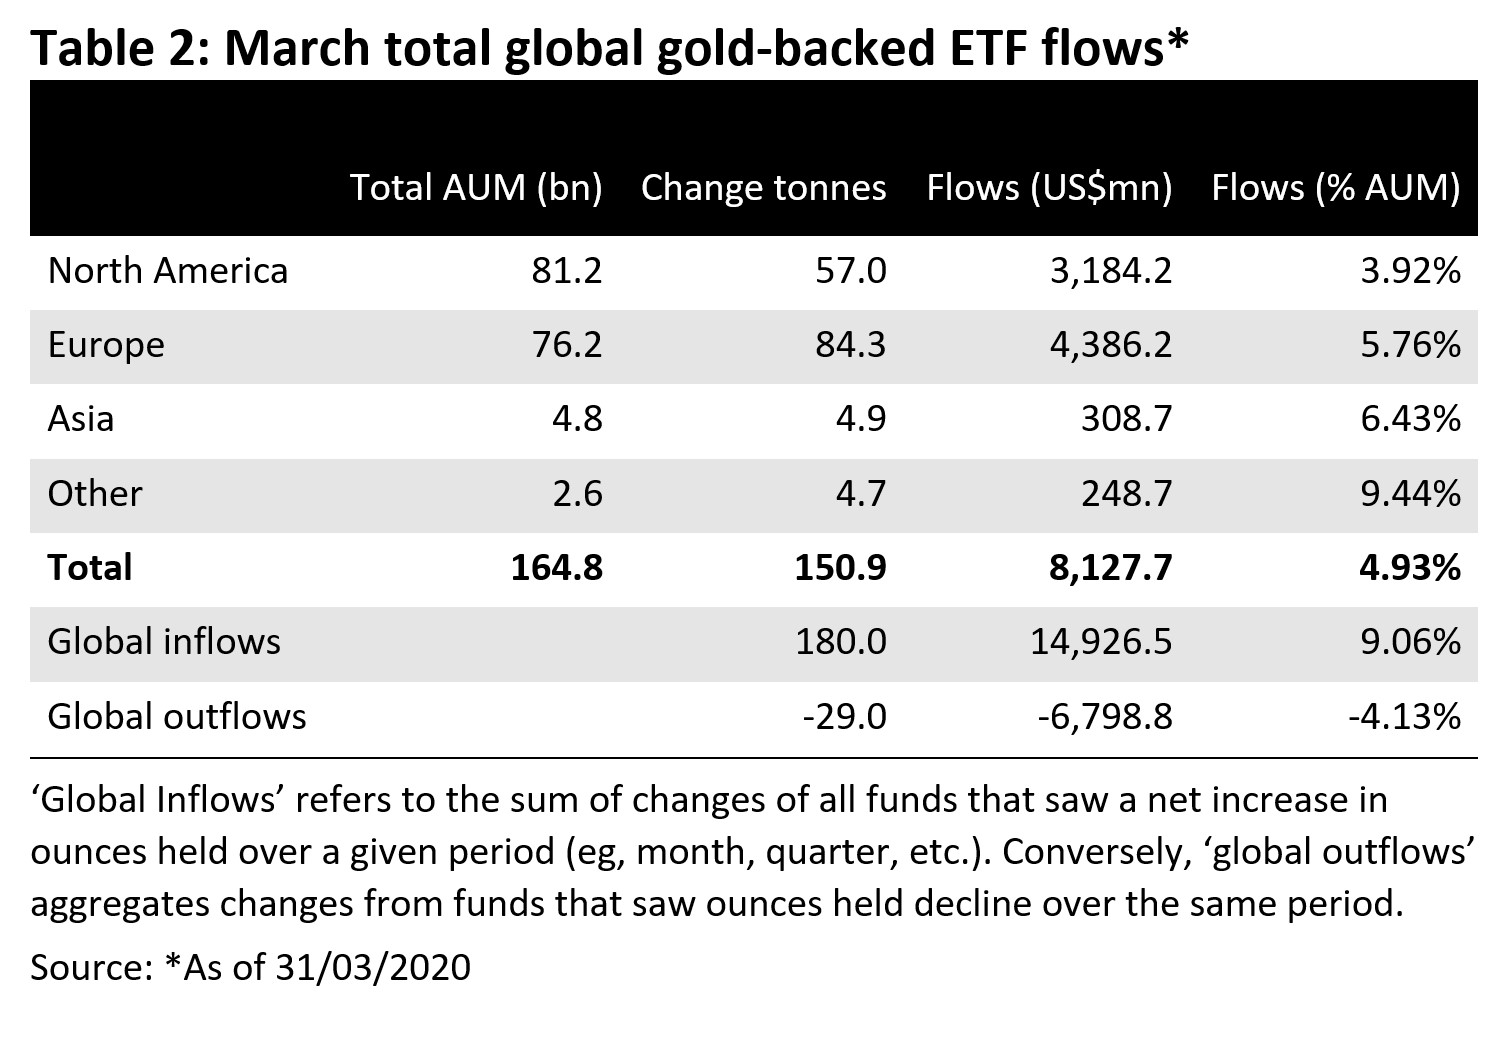
- Globally, gold ETFs added 151t – net inflows of US$8.1bn (+5%) – in March,
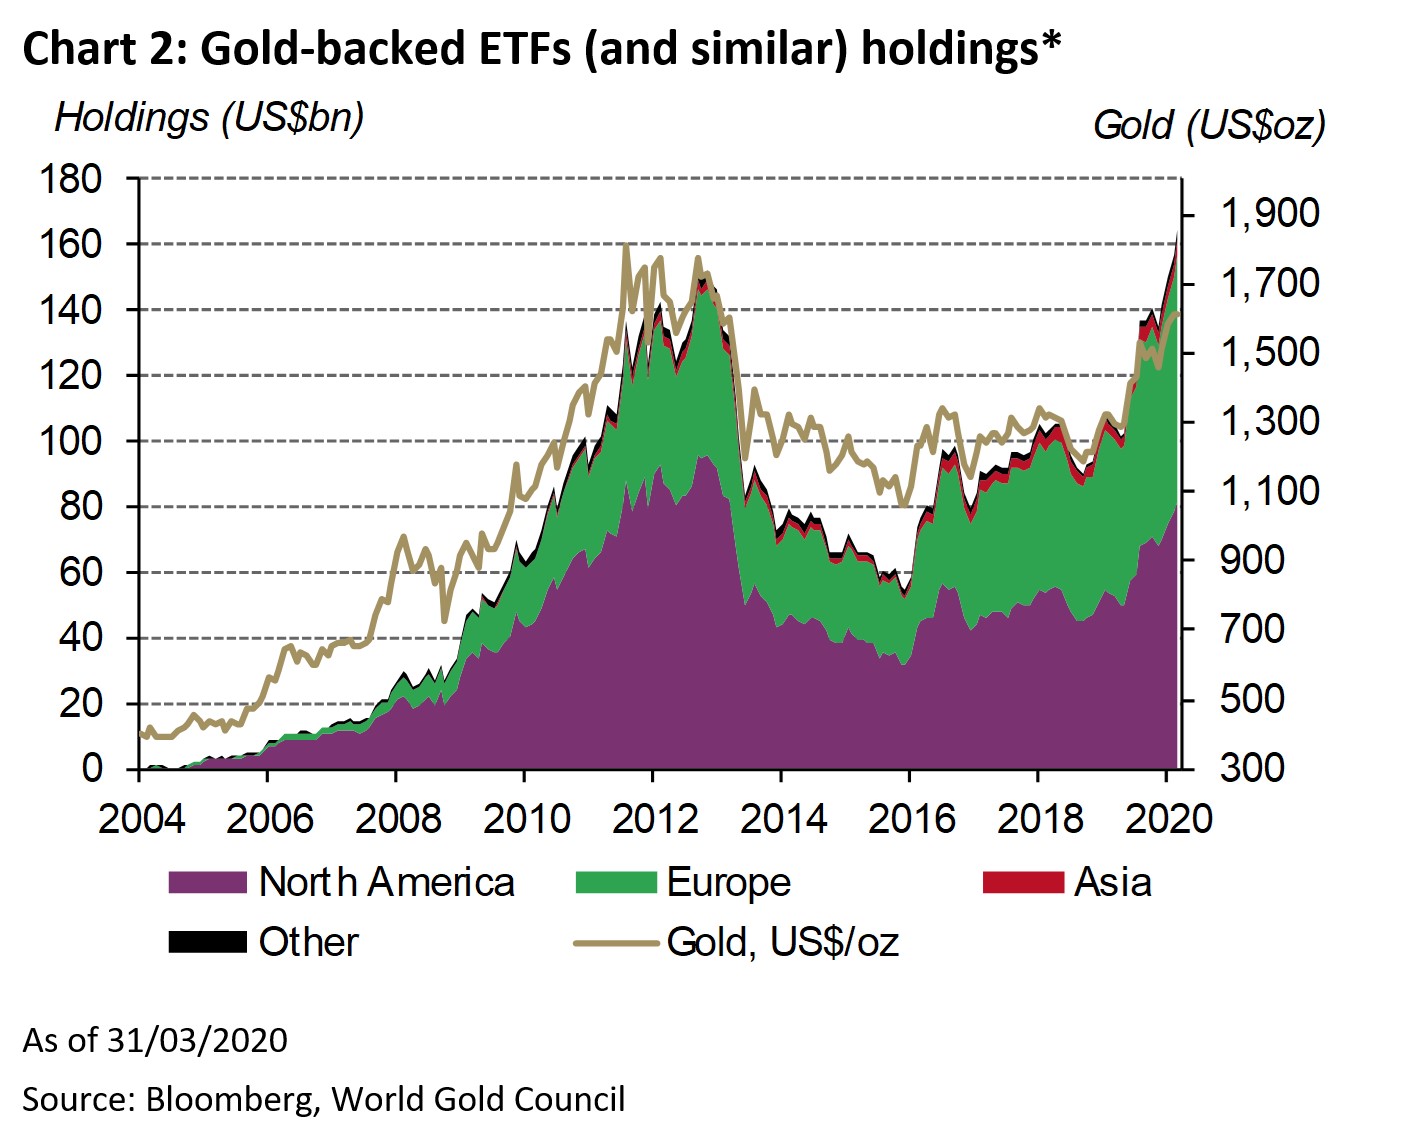
- New all-time highs of holdings at 3,185t.
- Gold ETFs continued their growth outside of the US
Price performance
- Gold price behaviour was similar to the financial crisis where capital requirements initially hurt liquid and outperforming assets like gold.
- Much like 2008, when QE was announced, gold rallied back strongly and finished the month mostly unchanged at US$1,609/oz, as the realised volatility of gold across tenors rivalled levels last seen during the European credit crisis in 2011 and the implied volatility – or how much investors expected gold would move across tenors – reached levels last seen during the global financial crisis.
Looking forward
- Recent drivers of investment demand are expected to continue namely, widespread market uncertainty and the improved opportunity cost of holding gold as yields move lower
- In the three years following the 2008 Lehman bankruptcy and subsequent QE, gold rallied over 600% from peak to trough and gold ETFs grew their holdings by over 100%
- If the trend mirrors the financial crisis, we could see significant inflows in gold ETFs over the coming months, which has been the case to begin the month of April.
To read the full analysis please click here
Latest research
Looking for insight and analysis on gold? Our team of experts produce market-leading research and macroeconomic commentary on gold.
