Summary
- Shanghai Gold Benchmark PM increased by 3.6% while the LBMA Gold fixing AM climbed 4.5% in December. Even so, the Chinese local gold premium jumped during the month, supported by higher physical gold demand prior to Chinese New Year in January.
- The rising demand also pushed Au9999’s trading volume and gold withdrawals from the Shanghai Gold Exchange (SGE) up further last month. And a lower gold price volatility dragged Au(T+D)’s trading volume down on a m-o-m basis.
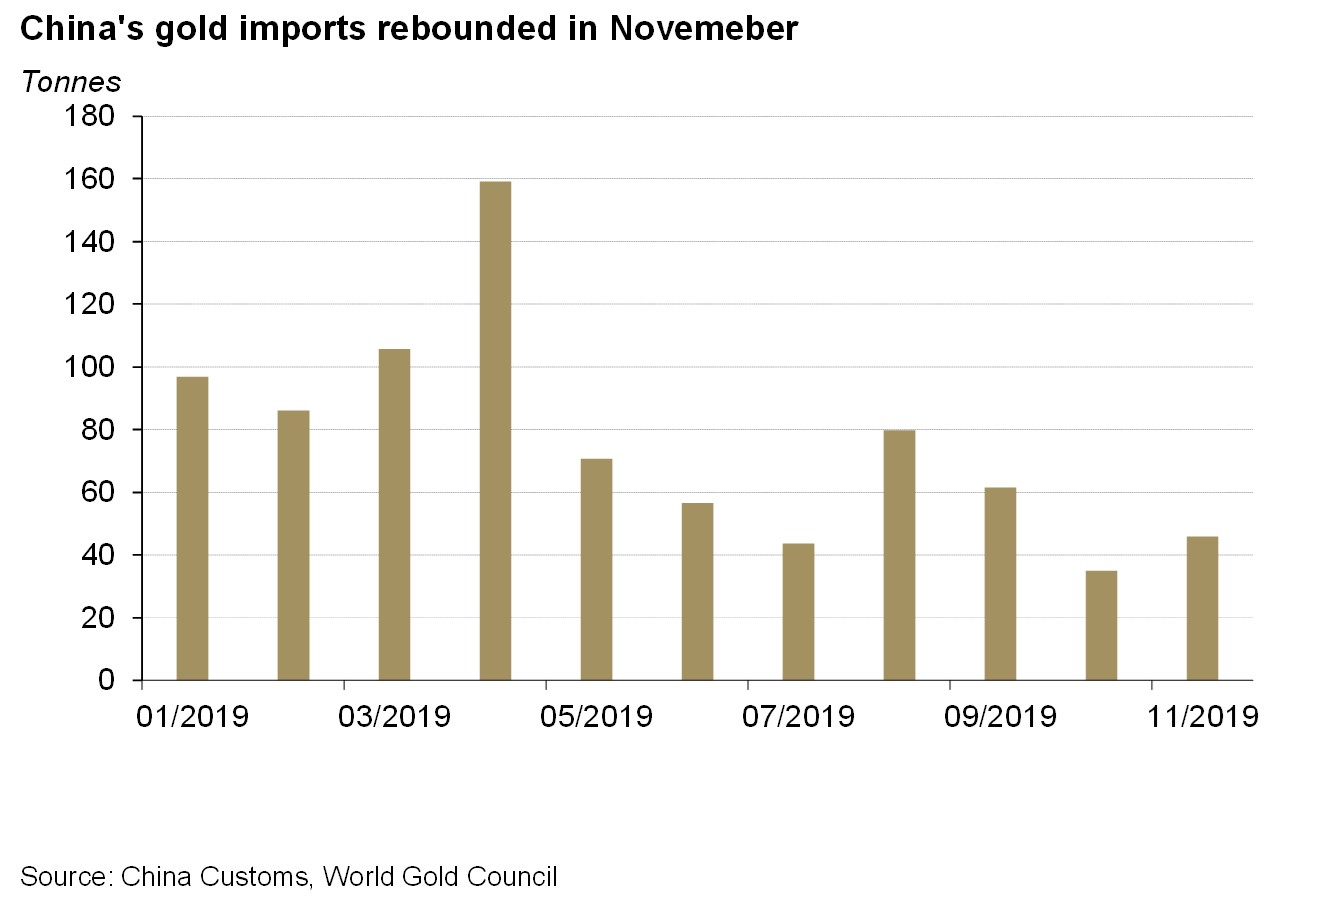
- China’s gold imports totalled 46t in November, 11t higher than October.
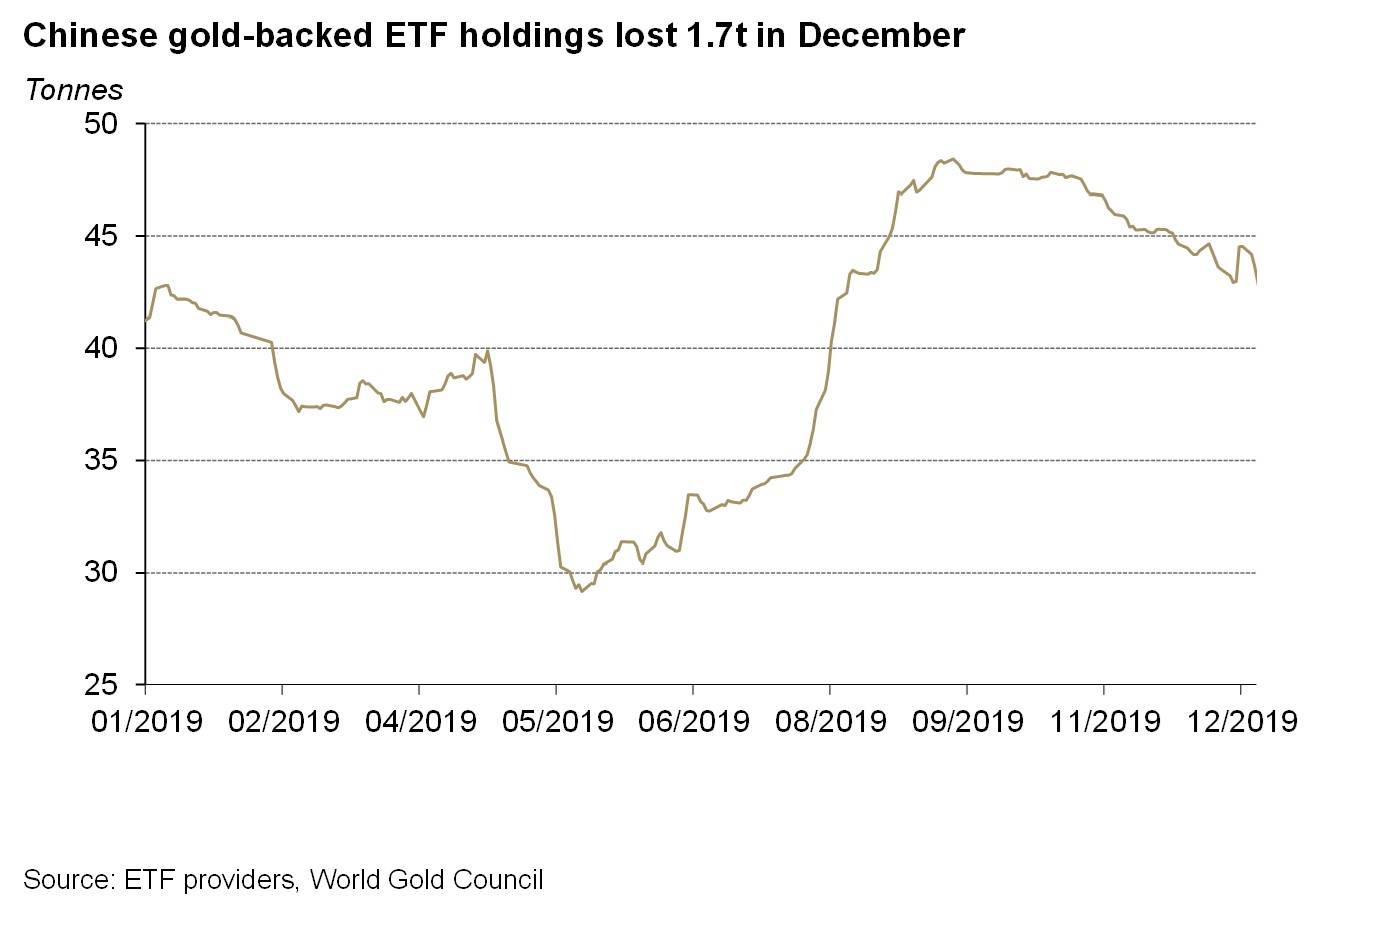
- Profit taking resulted in a 1.7t loss in holdings of Chinese gold ETFs in December, leaving the total amount at 43.64t, 2.3t higher on a y-o-y basis.
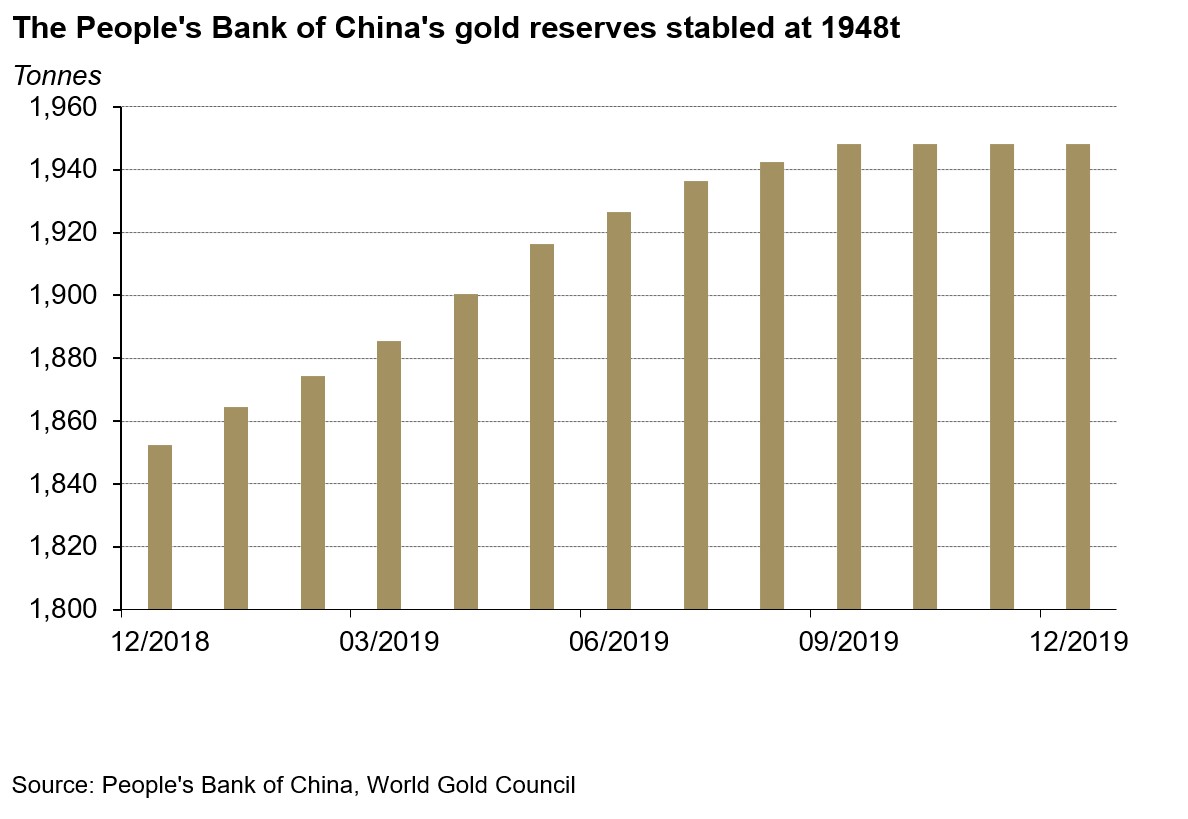
- The People’s Bank of China (PBoC) left its gold reserve unchanged at 1,948t in December.
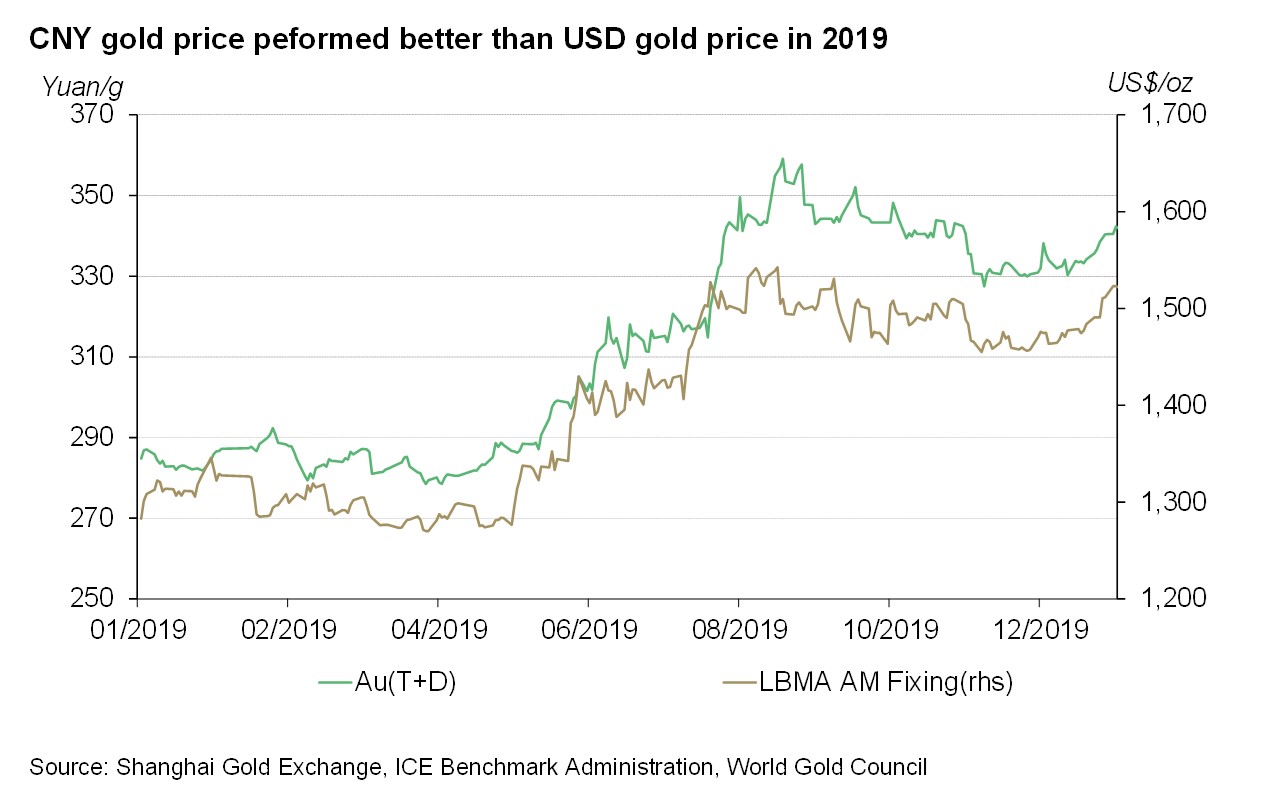
Gold prices rebounded in December, concluding 2019 as the best year for CNY-denominated gold in nine years. Driven by factors such as the bullish positioning by investors and increased geopolitical risks, the Shanghai Gold Benchmark (PM) and the LBMA Gold fixing AM rose by 3.6% and 4.5% respectively in December. And the almost 1% appreciation in CNY against the US dollar during the month was responsible for the difference in CNY and USD denominated gold prices.
Au(T+D), the most liquid gold contract at the SGE, managed to close the year with a 21% price increase, the largest since 2010. The low interest rate environment, increase in negative-yielding debt and rising geopolitical tensions were contributing factors.
China’s first exchange-traded gold future’s option was listed on 20th December 2019 at the Shanghai Futures Exchange. One month after the launch, the option’s daily trading volume averaged 70 million yuan, or US$10 million. And because of heightened geopolitical uncertainties, the daily open interest for calls was 90% higher than puts.
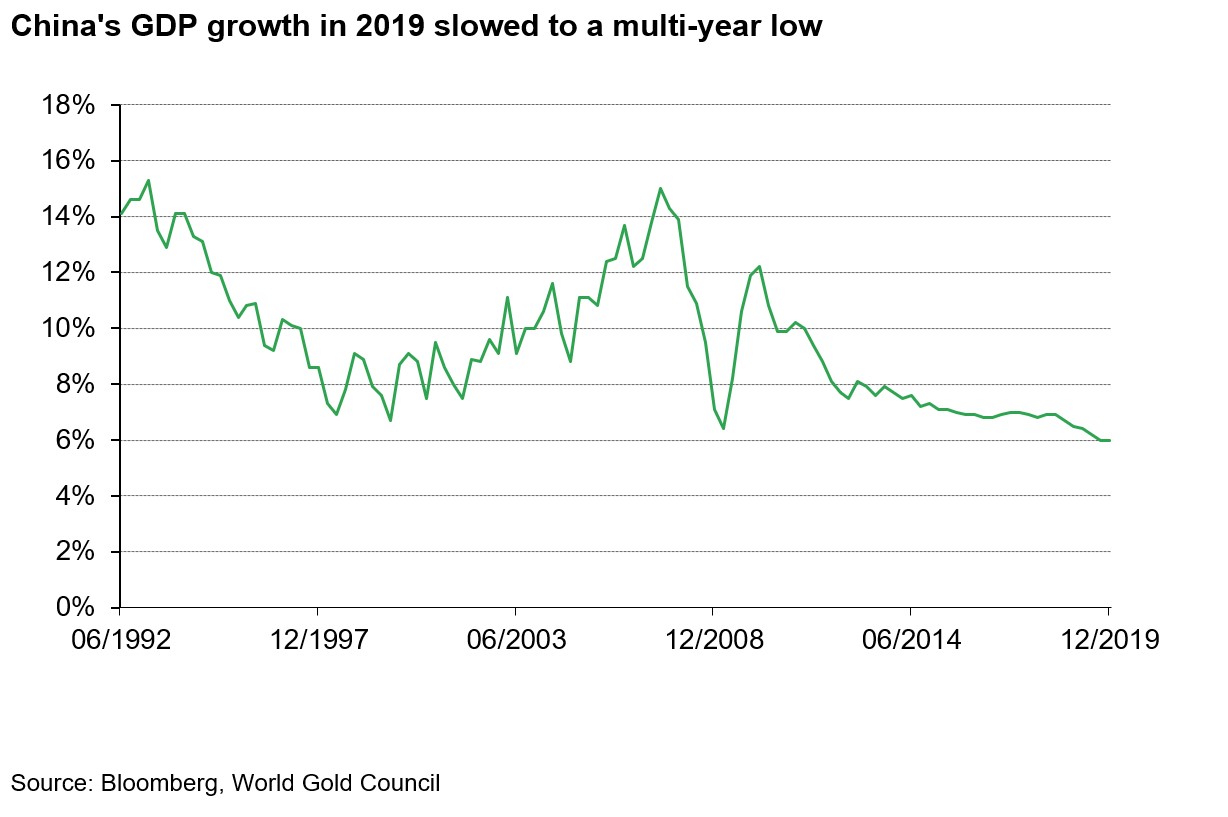
China’s economic growth slowed in 2019. Primarily, the long-term structural transformation from a fast-growing economy to a high-quality and green one, as well as the China-US trade dispute, exerted downward pressure.1 Consequently, China’s GDP growth in Q4 2019 sank to 6%, the lowest in 27 years. Meanwhile, impacted by higher staples’ prices such as pork in 2019, China’s CPI soared to 4.5% in November, the highest in eight years.
But in December, there were signs of stabilisation. Firstly, imports and exports improved significantly after China and US agreed the first phase of a trade deal.2 Furthermore, growth of key indicators such as retail sales, industrial-added value and manufacturing PMI stabilised, and in some cases, rebounded, in December.
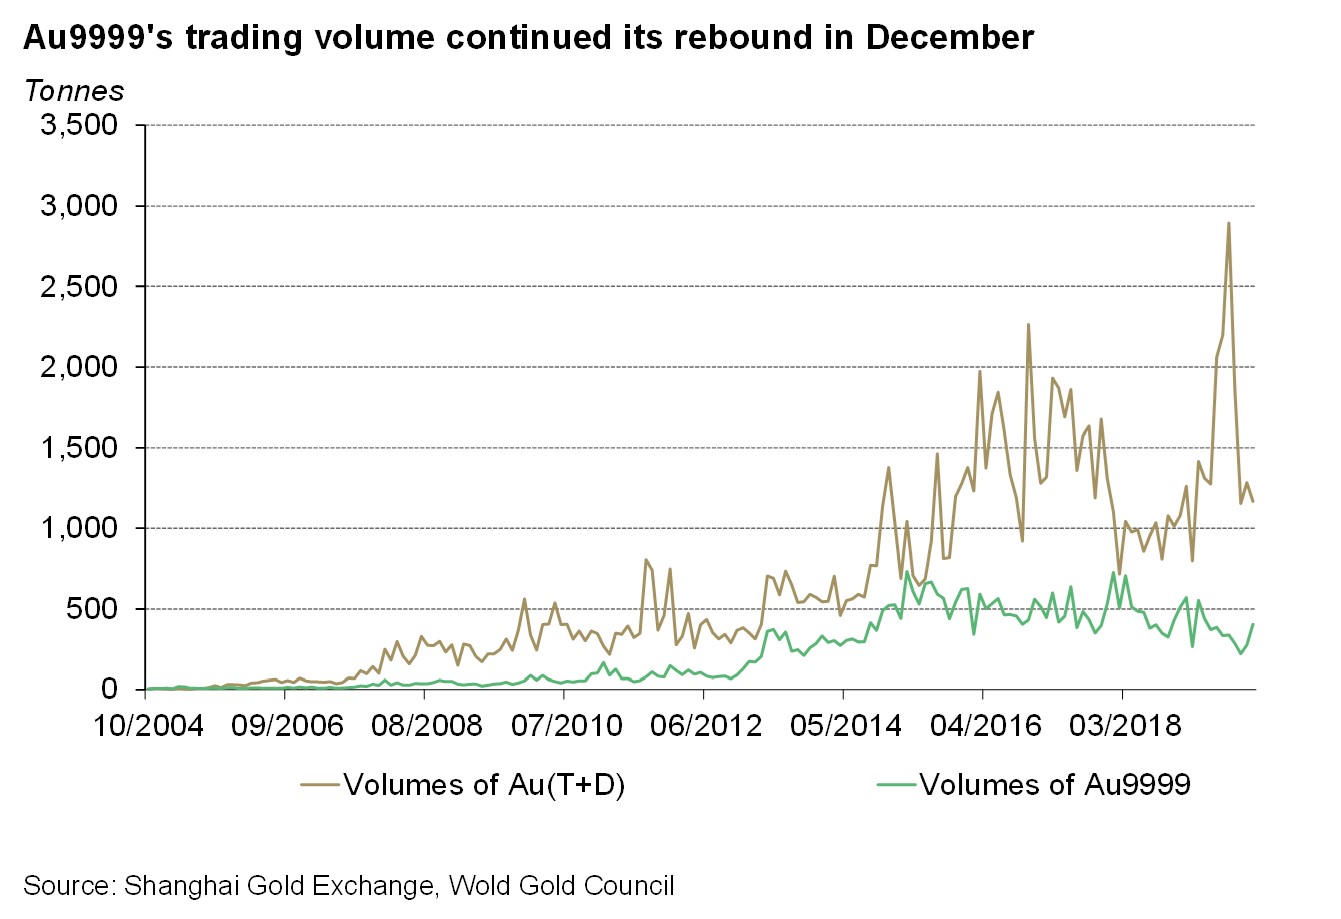
As mentioned in a blog I recently wrote, physical gold demand tends to get higher ahead of Chinese New Year, extending the rise in Au9999’s trading volume from November. Au9999’s trading volume in December reached 405t, 47% higher than November. However, a weaker physical demand overall during the year – as noted in our Gold Demand Trends – has led to a 24% y-o-y decline in Au9999’s average monthly trading volume in 2019.
Investors’ interest in Au(T+D) was tepid last month but remained well above 2018’s average throughout 2019. Dominated by shorter-term investment demand, slightly lower gold price volatility in December resulted in a 118t m-o-m drop in Au(T+D)’s trading volume, totaling 1166t. In 2019, driven by the bullish gold price momentum and elevated volatility, Au(T+D)’s trading volume averaged 1,556t per month in 2019, 60% higher than 2018.
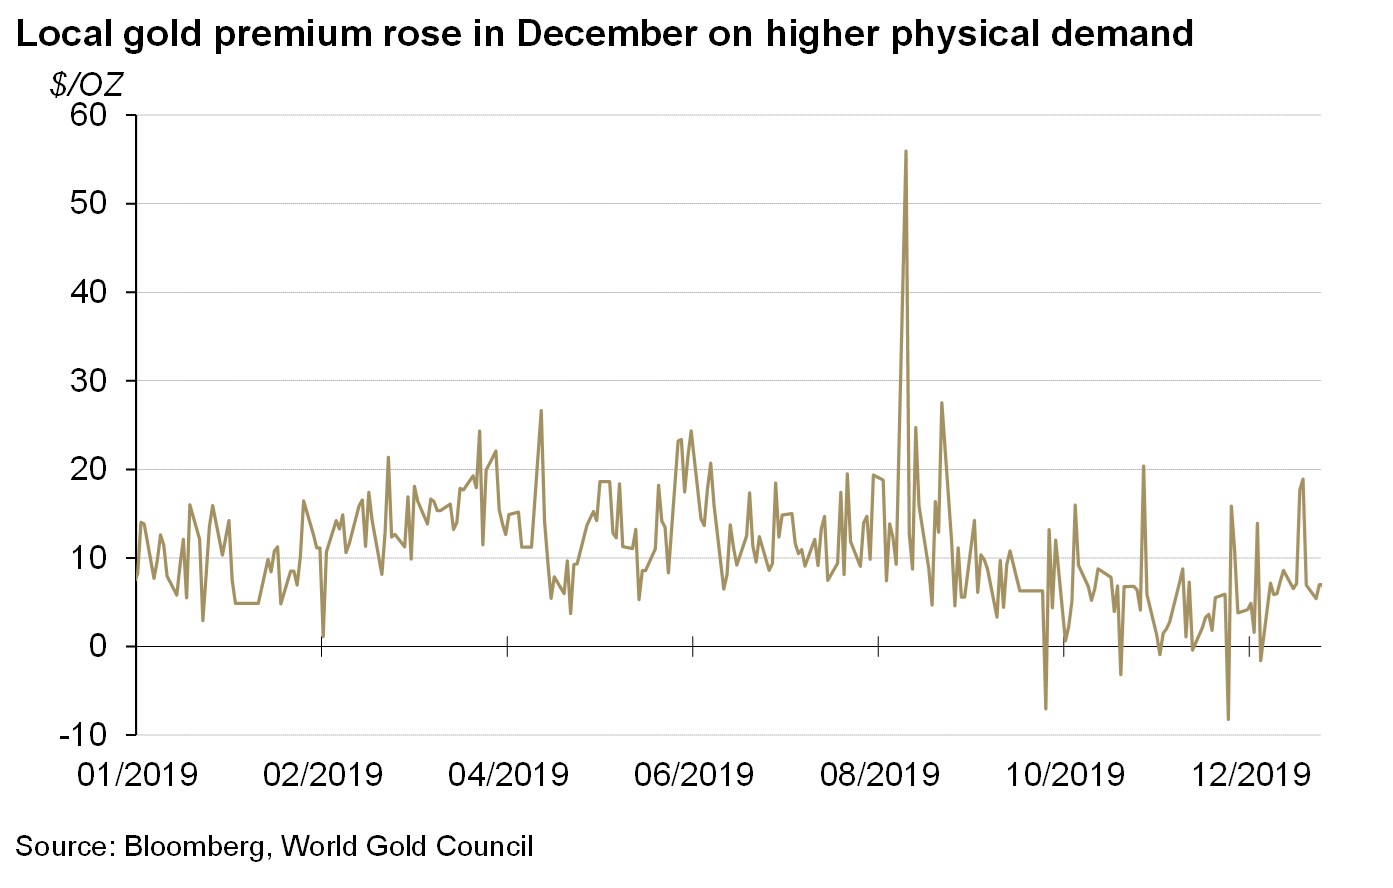
The rising physical gold demand before Chinese New Year pushed the local gold premium higher. Even though CNY gold prices were weaker than USD-denominated gold price in December, Chinese local gold premium rose to US$7.1/oz on average, 53% higher than November. Our research indicates that local gold premium tends to rise as Chinese Lunar New Year approaches, mainly driven by higher physical gold demand before the festival.
Note: SHAU PM VS. LBMA Fixing AM
China’s gold imports in November rebounded. In November, China imported 46t of gold, 11t higher m-o-m.3 And as of November 2019, China’s gold imports totalled 841t, 42% lower y-o-y.
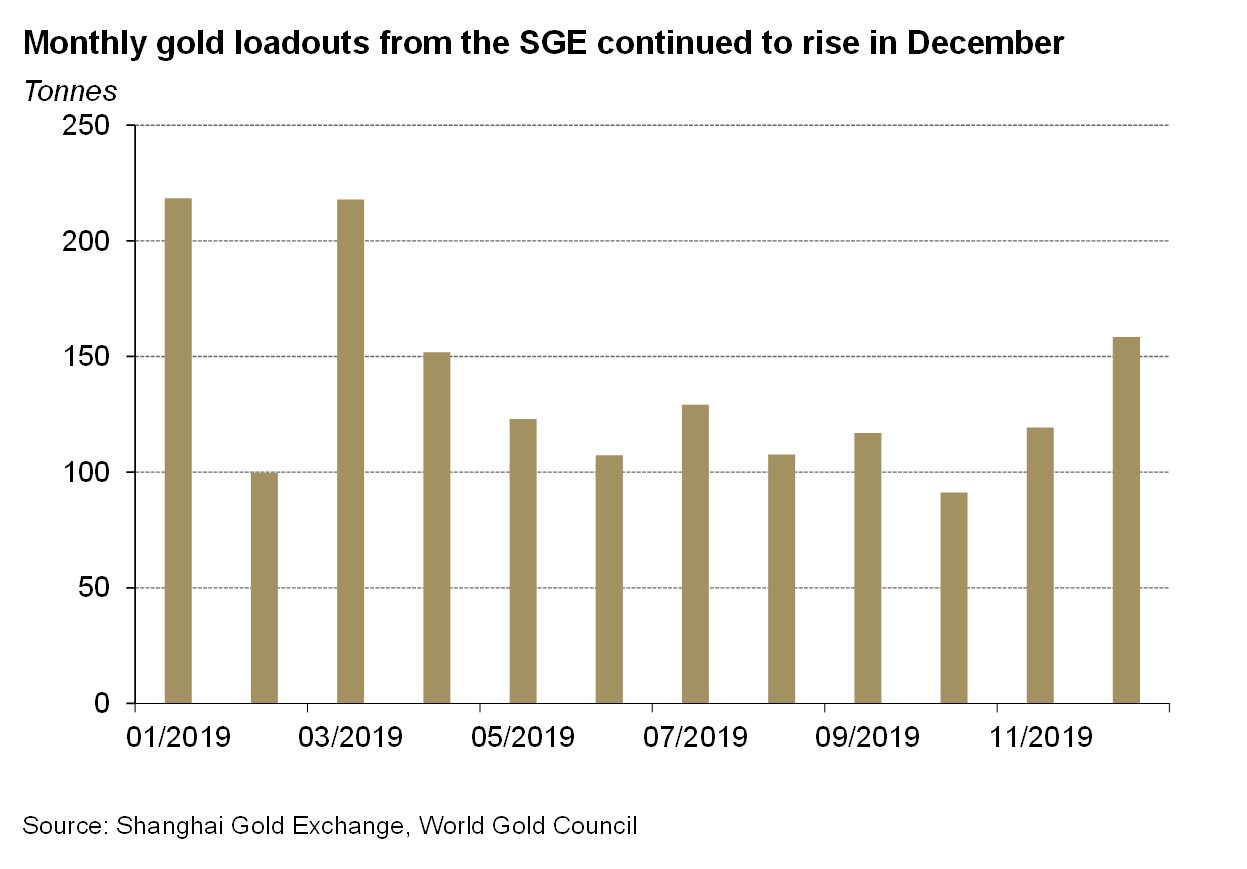
Gold withdrawals from the SGE continued to increase in December, totalling 159t, a 39t rise m-o-m. The industry’s stocking up before Chinese New Year has been the major reason for the loadouts’ increases in November and December.
In 2019, gold loadouts from the SGE averaged 137t per month, 21% lower y-o-y. As discussed in our Gold Demand Trends, not only the slowing economy growth and the rising inflation squeezed consumers’ budgets on luxury items, the stubbornly high gold price also hampered physical gold demand in 2019.
Chinese gold ETFs’ holdings recorded another retreat in December. Total Holdings of Chinese gold ETFs stood at 43.6t on 31st December 2019, 1.7t lower than end-November level.4 Profit taking could be the main reason for the drop as the gold price performed well during the month. And in 2019, the four major Chinese gold ETF products’ holdings expanded by 2.3t.
There was no change in the PBoC’s gold reserve in December. After nine consecutive months of gold purchases, the PBoC’s gold reserve has remained at 1,948t (3% of total reserves) since September. In 2019, China has added 95.8t of gold to its reserve assets.
Footnotes
1 For more information on China’s structural transformation, please visit: www.chinadaily.com.cn/opinion/2017-11/06/content_34175592.htm and https://www.chinadaily.com.cn/a/201911/26/WS5ddc8d78a310cf3e3557a072.html
2 For more information on China-US phase one deal, please visit: www.chinadaily.com.cn/a/202001/19/WS5e23ebcba310128217271fab.html
3 Please refer to gold imports under HS code 7108 which includes gold (Including Gold Plated with Platinum), unwrought or In semi-manufactured forms, or In powder form
4 Excluding Bosera’s I & D shares as they only provide updates at the end of each quarter.