I have spent the past few days at the Singapore Bullion Market Association’s annual Asia Pacific Precious Metals Conference in Singapore. An excellent event with good attendance from across the region, including attendees from Vietnam, Myanmar, Malaysia, Australia, China and India. As with most conferences, a key benefit is being able to get the main players from the region in one place to engage, learn and do business.
Gold in Islamic finance – The rise of robo-advisers
Takeaways from the SBMA's annual Asia Pacific Precious Metals Conference
Alistair Hewitt
Former Head of Market Intelligence World Gold Council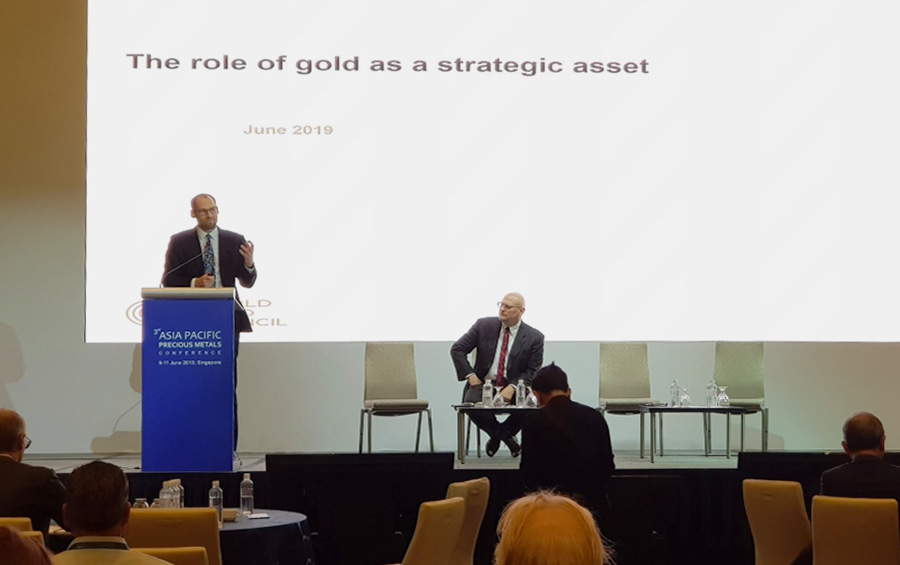
But the content of the conference was good, too. Three themes stood out to me:
- Digital innovation: A fascinating session focused on technology and its interlinkages with gold, the impressive pace of innovation, and the role that Singapore is playing in nurturing the development of the market. A key message that leapt out to me is that while physical gold demand may be healthy, it is a mature market which needs to keep one eye on tomorrow’s investors and, in the words of the Dillon Gage (the US bullion dealer), “adapt, adopt and digitise”
- ESG: Last year, Paul Fisher’s key note speech focused on environmental, social and governance (ESG) issues, highlighting institutional investors’ focus on climate change as posing a potential threat to the global gold market. This year, on a panel chaired by Terry Heymann, our CFO, the industry debated the impact of ESG and responsible sourcing guidelines on the industry and their importance to the gold investment and jewellery markets
- China: Roland Wang, our Managing Director for China, noted the country only exported 4.6t of gold jewellery to ASEAN countries in 2018, yet regional jewellery demand was just shy of 100t. With China’s fabricating ability and innovative jewellery designs he felt there were opportunities to cooperate and promote gold trade in the region
Beyond this, there were interesting conversations about developments in Myanmar, Vietnam, and OTC and exchange trading. I’ll be spending the two days following the conference in Vietnam to learn more about how the market is performing.
All the slides used in the conference will be uploaded on to the SBMA’s website in the next week or so, including the slides I presented on the investment case for gold masterclass I hosted with Bart Melek from TD Securities.
South African production: important but no longer globally significant
Krishan Gopaul
Senior Analyst, EMEA World Gold CouncilI’ve recently seen several headlines highlighting the fall of a mining giant. South Africa, for so long the dominant source of gold for the market, is now no longer Africa’s premier producing nation. That title now goes to Ghana. But how globally significant is this? Well, not very I would argue; that is, it doesn’t signal anything new in terms of global gold supply and market dynamics.
South African gold output has been declining for several decades now. From a peak of around 1,000t in 1970, the nation’s gold output fell to 130t in 2018. A combination of closure, maturing assets and industrial strife has created an inhospitable operating environment. Even the leading gold miners headquartered in South Africa are now focusing elsewhere. (Although, according to the US Geological Survey, the country still has 6,000 tonnes of gold reserves.)1
But all this reminds me of a chart we published almost a decade ago (see below).2 While the decline of South African production has been a feature of the gold market for several decades, so has the emergence of new sources of gold. Geographically-speaking, gold mine production is more diversified that ever. (Not much has changed since 2010 in terms of gold production’s geographic split.) And this is a key strength of the gold market. Given the global spread of gold mining, supply to the market is less susceptible to regional shocks and therefore far more stable than in some other metals. The top six gold producing nations only account for 45% of global gold production (compared to platinum, for example, which sources 98% of its new supply from the top five producing nations).345

What has this meant for global production levels? Well, despite South Africa no longer producing several hundred tonnes of gold each year, global gold production has been increasing. In fact, it has hit record levels in the last couple of years.6 Stable or increasing production – due to higher gold prices and a very diverse set of projects developed over the last decade – has more than offset the loss from South Africa.

South Africa no longer being Africa’s top gold producer might be a symbolic milestone, but it isn’t as significant when it comes to global gold production levels in 2019.
Find our latest mine production statistics here.
Read our latest Gold Demand Trends report.
[1] prd-wret.s3-us-west-2.amazonaws.com/assets/palladium/production/s3fs-public/atoms/files/mcs-2019-gold.pdf
[2] www.gold.org/goldhub/research/evolving-structure-gold-demand-and-supply
[3] The top six gold producing countries in 2018 were: China, Australia, Russia, United States, Canada and Peru
[4] The top five platinum producing countries in 2018 were: South Africa, Russia, Zimbabwe, Canada and United States
[5] Metals Focus Gold Focus 2019
[6] www.gold.org/goldhub/research/gold-demand-trends/gold-demand-trends-full-year-2018/supply
Gold OTC trading volume is 50% higher this month
Adam Perlaky
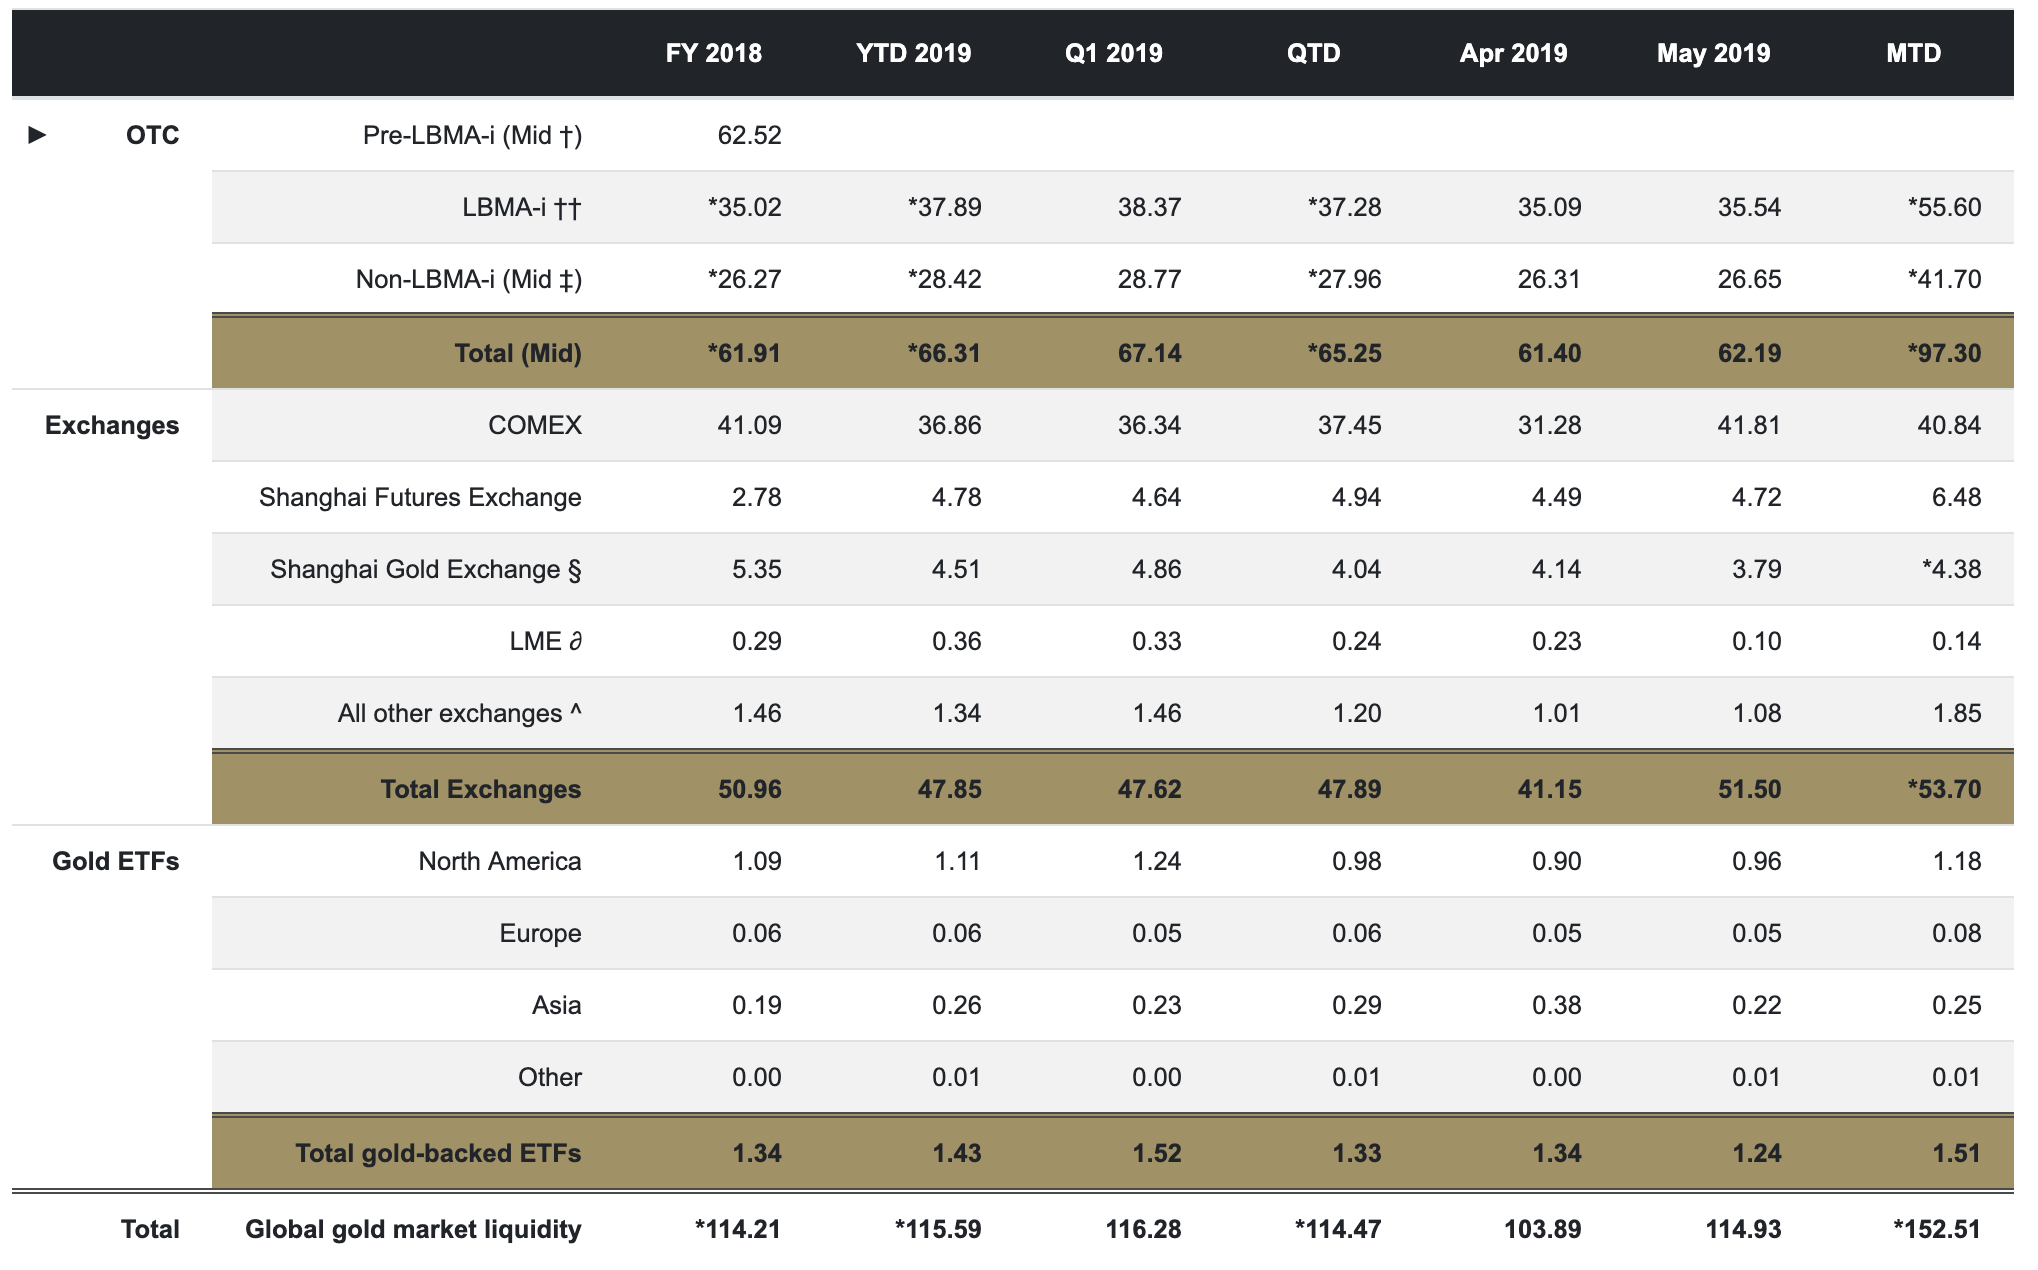
Former Senior Analyst, Americas World Gold Council- With the recent rally, Gold trading volumes have increased significantly in June ($151bn vs ytd average of $115bn), particularly in the LMBA OTC market, which has seen averages increase 50% this month.
Gold trading volumes
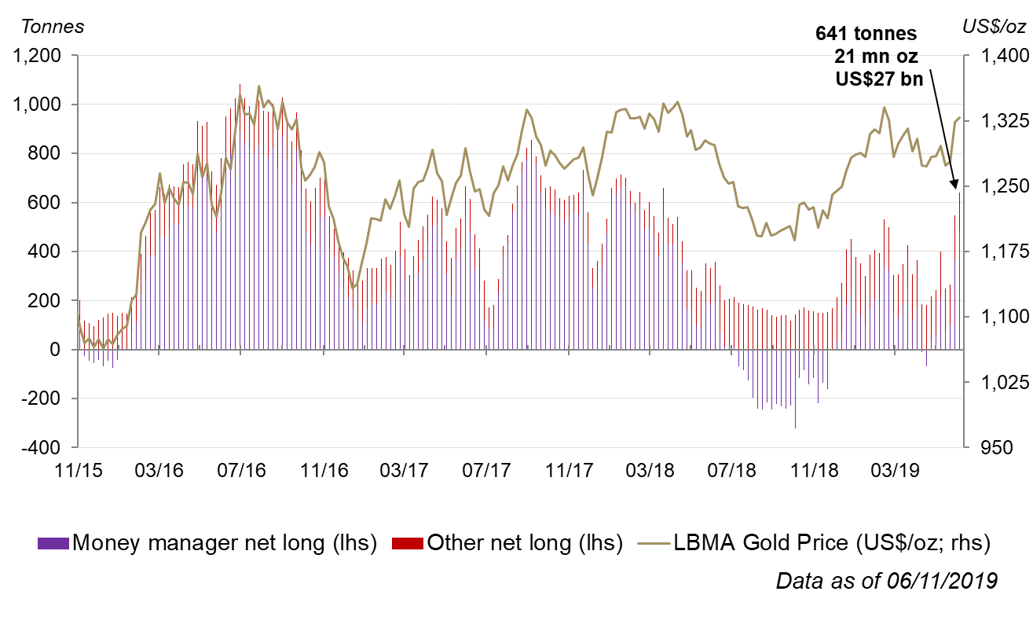
- COMEX net longs continued to increase meaningfully to 641t, a level not seen in over a year, highlighting the bullish shift in sentiment.
- Options and volatility – Bullish sentiment is very much reflected in the pricing of gold options, particularly as it related to options skew. Put skew, or the premium an investor wants to pay for bearish exposure is nearing 5-year lows (people are effectively not paying a premium for downside protection). Call skew remains rich as investors pay for upside exposure. Implied volatility has risen to ytd highs with the move higher in the price of gold, as well as bullish sentiment, however, realized volatility does remain somewhat low.
3-month gold put skew
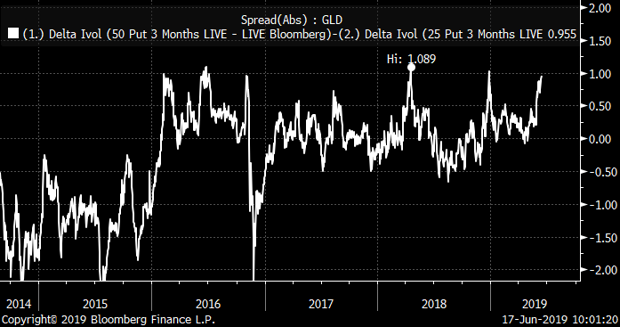
Source: Bloomberg
- Gold-backed ETF flows - US funds continue to have inflows, increasing assets last week by $490mn. Month-to-date, global gold-backed ETFs have added nearly 3% to assets or $3bn, driven by the US and Europe. YTD, flows in North America are close to turning positive again with outflows of only $300mn. Inflows globally are $2.5bn, driven entirely by European funds.
- Technicals – Gold tried to break above the important level of $1,365 on Friday, but ultimately settled closer to around the $1,350 level. A pause in the price would likely be positive for a continued push higher as the price is somewhat overbought from a relative strength index perspective.
Gold: Yesterday, India’s Ministry of Commerce released May trade data. India’s gold imports
18 June, 2019 13:14
Are global trade tensions undermining US jewellery sales?
Louise Street
Senior Markets Analyst World Gold CouncilGlobal luxury brand, Tiffany & Co, recently announced a sharp drop in US sales to overseas tourists. Sales to tourists visiting the US in Q1 2019 dropped by 25% from the same period in 2018. Notably, the drop was even more pronounced among tourists from China.
In Q1 2018, the US and China took their first steps towards protectionism before a series of rapidly escalating retaliatory measures led to an all-out trade war later that year. The data suggests that Chinese tourists were apparently very quick to vote with their feet…and their wallets.
The number of Chinese tourists visiting the US dropped in Q2 of last year and has been in a downtrend ever since. Which contrasts sharply with the bigger picture: overall outbound Chinese tourist numbers have been on a rising trend for the last five years.1
Chinese outbound tourist numbers

Source: Bloomberg; China Outbound Tourism Research Institute
It could be argued that the simultaneous strengthening of the US dollar played a role – by reducing the spending power of Chinese visitors and pushing up the cost of their trip in renminbi.
But research by global consumer research agency Nielsen suggests otherwise. According to its 2017 survey, Chinese tourists are far less influenced by affordability than by other factors such as tourist attractions, the travel experience and the beauty, uniqueness and safety of their destination. When choosing an overseas travel destination, cost was the fifth highest priority among Chinese tourists, far lower than among non-Chinese tourists, who ranked it the second highest consideration.

Source: Outbound Chinese Tourism and Consumption Trend: 2017 Survey, Nielsen
We are currently running a large-scale consumer research programme that will shed light on the buying decisions of global jewellery consumers. We are surveying jewellery buyers in China, India and the US – including whether they bought a jewellery piece from a global luxury brand such as Tiffany’s, whether they bought it overseas, and how much they spent on it. And we can compare these responses with how confident consumers say they are feeling about their personal financial situation, against the political and economic background. So the results should give us an indication of whether jewellery consumers in China – and other key markets – are reacting to the global geo-political environment.
And this is just the tip of the iceberg in terms of the insights we will uncover through the research. We will be investigating the purchase journey for jewellery buyers, their key buying occasions, as well as where gold jewellery performs particularly well….and where it doesn’t. The insights will help industry to understand the drivers of behaviour among a swathe of jewellery consumers that together account for over 60% of global annual gold jewellery demand.
[1] Source: Bloomberg; China Outbound Tourism Research Institute (COTRI)
Gold: Trading at about $1407/oz after failing to hold onto the highs just shy of $1440/oz seen o
26 June, 2019 11:00
The tale of two contracts: speculative investment up, physical demand down
Ray Jia
Head of Research (Asia Pacific, ex-India) and Deputy Head of Trade Engagement (China) World Gold CouncilIn May, against a backdrop of stock market turbulence and a weak CNY, the Shanghai Gold Benchmark price rose by 2.8%. Beyond the price appreciation, there is an interesting story in the two most popular gold contracts traded on the Shanghai Gold Exchange:
- Trading volume of Au(T+D), a margin-traded and the most liquid gold contract traded on the Shanghai Gold Exchange (SGE), reached 1276t in May1, 286t higher y-o-y. It rose almost 50t from the start to the end of the month.
- Trading volume of Au9999, a physical-traded gold contract on the SGE, amounted to 371t in May. This was a 115t decline y-o-y and the fourth lowest monthly accumulated volume in three years2. Also, the volume decreased by 10t from May 6th to May 31st.


To understand why the volumes moved in different directions, we need to take a step back and ask, who’s trading these contracts?
Au(T+D) and Au9999
Demand for Au(T+D) tends to be investment-related, while Au9999 reflects physical demand. This is due to their different contract specifications: the minimum margin requirement for Au(T+D) is only 7% of the contract’s value, whereas to trade Au9999, requires 100% of the contract value in cash or the physical product (1kg, 99.99% purity gold bars).
The two contracts also differ in settlement and delivery modes. Au(T+D) allows traders to trade gold on margin and without delivery of the physical products. It is also marked to market. Therefore, investors usually choose Au(T+D) to magnify expected returns.
On the other hand, the Au9999 contract is designed to meet physical demand. For instance, buyers (fabricators, banks etc) need to prepare the full value of the contract and sellers (refineries etc.) should have the physical gold products to trade, and ownership of the gold must be transferred from seller to buyer once a trade is complete.

What happened in May?
In light of the stock market turbulence and weakening currency, Chinese investors looked to diversify, driving the volume of Au(T+D) – the more investor-friendly gold contract – significantly higher.
On the other hand, May’s AU9999 trading volume was weak due to a large industry inventory that had built up earlier in the year. Jewellers, refineries and other entities had been piling up on stocks in March to gain extra tax credits just before the VAT cut. reducing future physical demand. As a result, loadouts from the SGE in May dropped 95t compared to March and Au9999’s trading volume plummeted3.
The physical premium also reflected the reduced interest in the Au9999 contract as it turned negative at the end of May.

Conclusion
The divergence in Au9999 and Au(T+D)’s trading volumes in May was largely a result of the different needs they serve. Au9999 volumes were soft because of the large gold industry inventory built up in March while Au(T+D) was boosted by speculative investor demand.
[1] - Accumulative daily volumes from May 6th to May 31st (markets were closed between May 1st -May 5th for a national holiday)
[2] - From May 2016 till May 2019
[3] - Loadouts: the amount of gold leaving the Shanghai Gold Exchange’s vault
Latest research
Looking for insight and analysis on gold? Our team of experts produce market-leading research and macroeconomic commentary on gold.
