China gold market update: Unseen investment passion
14 May, 2025
Highlights
- Gold’s rally continued. The Shanghai Benchmark Gold Price PM rose 6.9% - its fifth consecutive monthly gain – and the LBMA Gold Price PM was up by 6%, witnessing positive returns for four consecutive months
- Jewellers, banks and other market participants withdrew 153t gold from the Shanghai Gold Exchange (SGE) in April, notably higher m/m and y/y
- Chinese gold ETFs added RMB49bn (US$6.8bn, 65t) in April, the strongest month ever. Their total assets under management (AUM) and collective holdings both surged to month-end peaks – but it is worth noting that inflows slowed at the start of May. Gold futures volumes at the Shanghai Futures Exchange (SHFE) also soared to a record high in April and remained elevated in early May
- The People’s Bank of China (PBoC) reported its sixth consecutive monthly gold purchase in April, adding 2.2t to its gold holdings, which now stand at 2,295t, 6.8% of total reserve assets
- The most recent information suggests tepid gold imports in March and a weak Q1 total. We believe this is due to lower gold price premiums – sometimes discounts – and cooling gold jewellery demand.
Looking ahead
- We expect gold jewellery consumption, in tonnage terms, to remain tepid as it enters its off season after the five-day Labour Day Holiday, although the recent price adjustment could provide some support
- Gold investment demand may also cool in the near term possibly due to profit taking, the range-bound price movements and cooling US-China trade tensions. But in the longer term, gold’s investment demand should be well supported amid its attractive performance, lingering global economic and geopolitical risks, as well as institutional allocations from Chinese insurers.
April saw continued gold price strength
Global gold prices kept rising in April (Chart 1). Our model shows that a weaker dollar, elevated geopolitical/economic uncertainties and strong gold ETF inflows drove gold up. While the LBMA Gold Price PM in USD saw its strongest April since 2011, the SHAUPM in RMB recorded its highest April return in 19 years.
Chart 1: The gold price rally extended into April
Monthly returns of the SHAUPM in RMB and the LBMA Gold Price PM in USD*
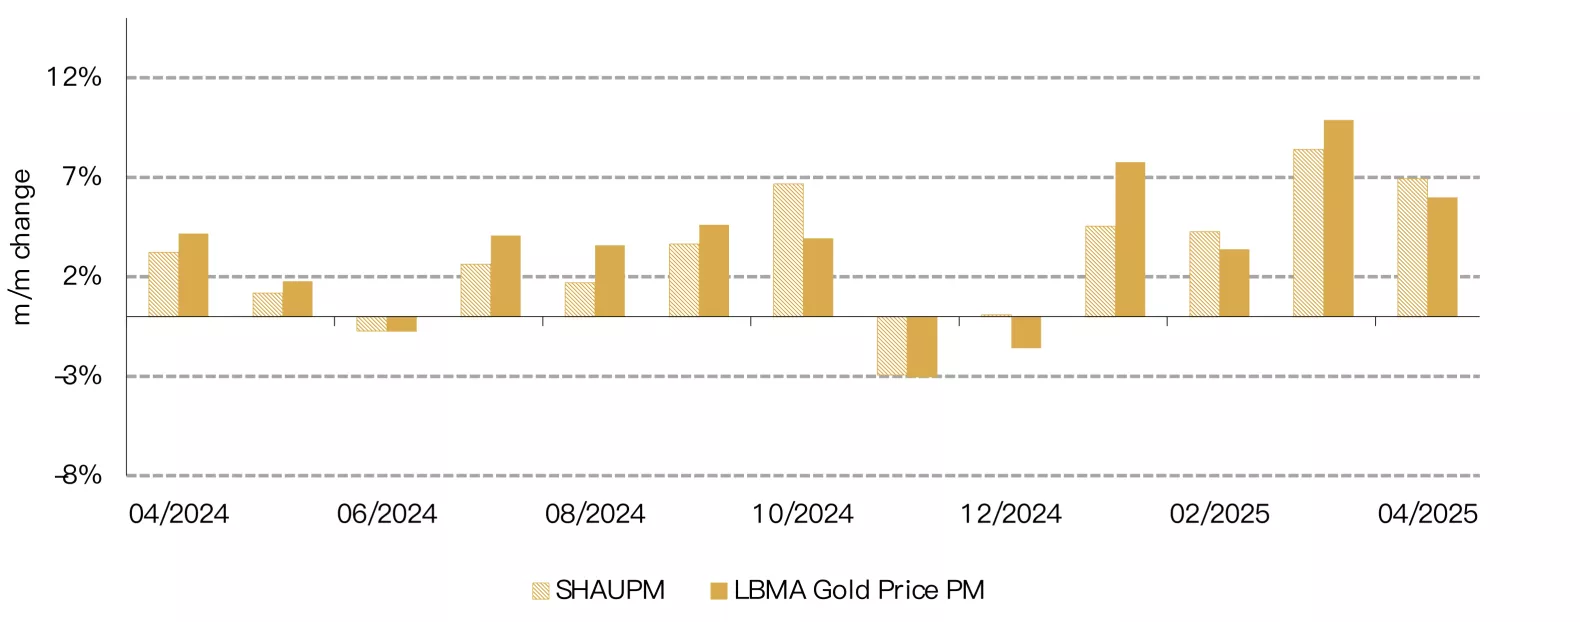
*Data as of 30 April 2025.
Source: Bloomberg, World Gold Council
Over the past four months, the RMB gold price has witnessed a cumulative return of 24%, the strongest January to April performance on record (Chart 2). And the LBMA Gold Price PM soared 27% during the same period. The difference is mainly a result of a stronger RMB, which has appreciated 1% so far in 2025.
Chart 2: Gold prices saw unprecedent y-t-d returns
Y-t-d returns of the Au9999 in RMB and the LBMA Gold Price PM in USD*
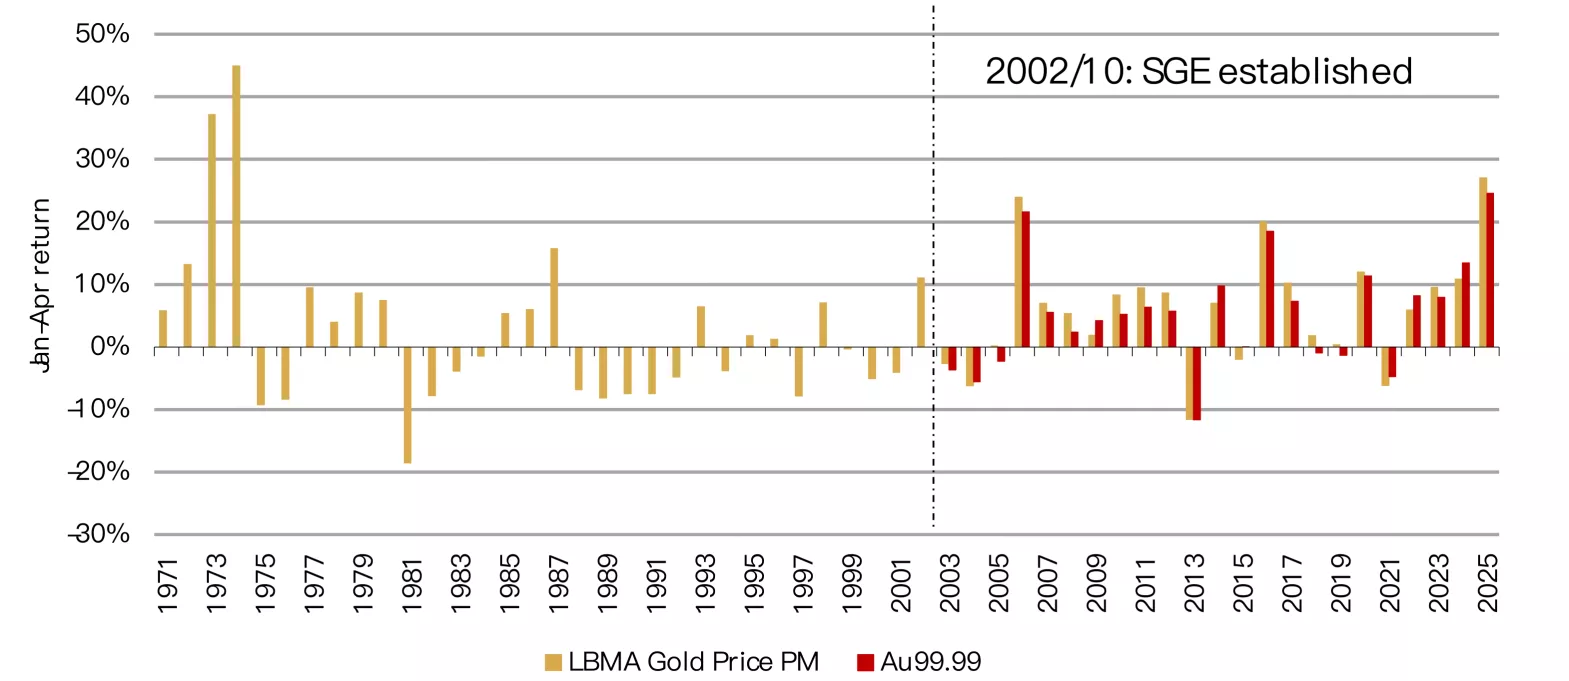
*We use Au99.99 – the main spot gold contract at the SGE – and the gold price in RMB as it has a longer history than SHAUPM.
Source: Bloomberg, World Gold Council
Wholesale demand continued to rebound
The industry withdrew 153t gold from the SGE, a rise of 27% m/m and 17% y/y (Chart 3). The improving wholesale gold demand is also reflected in the rising local gold price premium, which averaged US$37/oz in April, significantly higher than March’s US$2/oz.
We believe the following factors underpinned the April strength:
- Continued robustness in bar and coin sales amid strong investor buying: gold remains a top-performing asset in China as US-China trade tensions intensified
- Jewellers re-stocking for the early May Labour Day Holiday following Q1 withdrawals that were lower than usual.1
Chart 3: Wholesale demand improved in April
Gold withdrawals from the SGE*
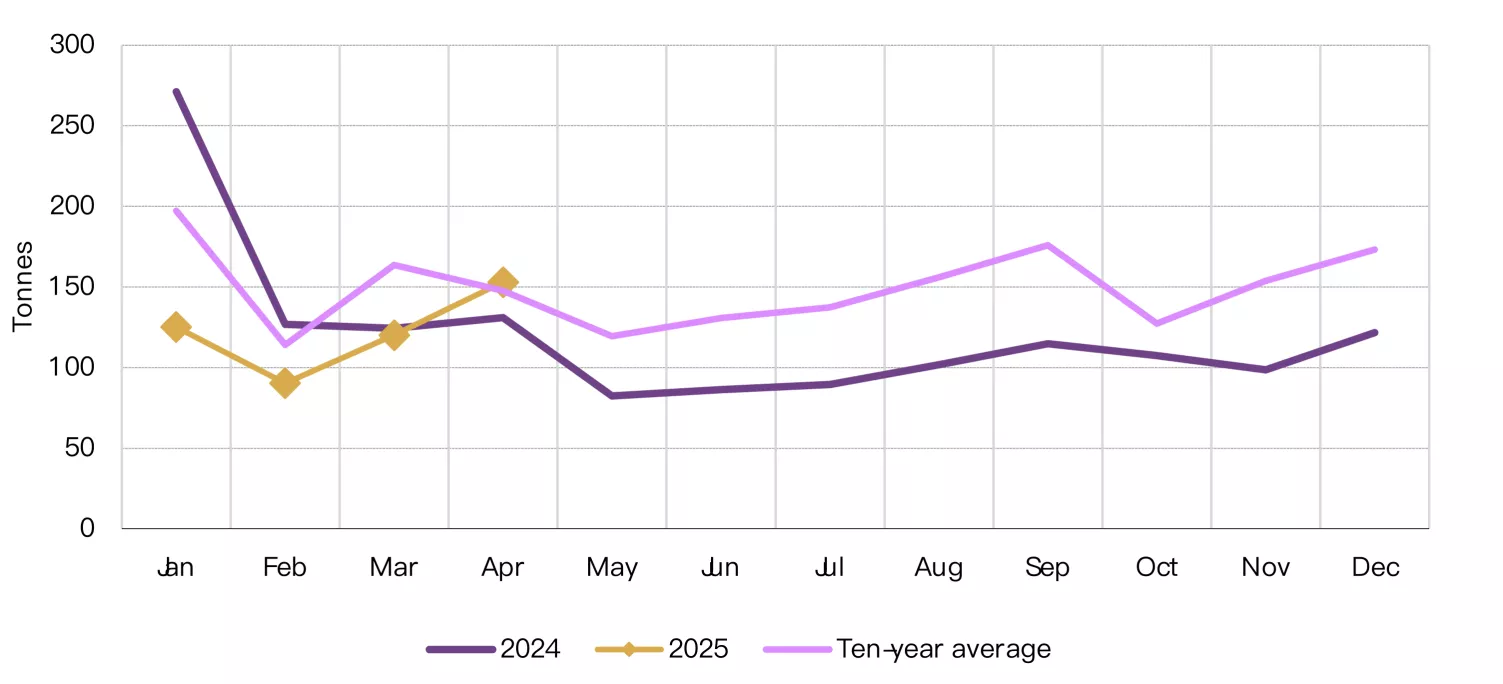
*As of April 2025.
Source: Shanghai Gold Exchange, World Gold Council
Surging gold ETF demand in April
Chinese gold ETFs recorded their strongest month on record, adding RMB49bn (US$6.8bn) (Chart 4). The third consecutive monthly inflow and the continued surge in the gold price lifted their total AUM to RMB158bn (US$22bn); a rise of 57% in April and the highest month-end value ever. Meanwhile, holdings surged by 65t to 203t, also a record high.
This unprecedented demand surge was mainly driven by the attractive local gold price performance, US-China trade war concerns and falling local bond yields amid intensified easing expectations. During the first four months of 2025 Chinese gold ETFs’ total AUM and holdings have jumped by 125% and 77%, respectively.
As we enter May, ETF demand in China remains positive yet slows notably compared to April. This is, likely due to investors having mostly priced in previous trade uncertainties – which have eased following the US-China Geneva trade talk – and a stabilisation of the local gold price.2
Chart 4: The strongest monthly gold ETF demand on record
Collective holdings and monthly demand of Chinese gold ETFs*
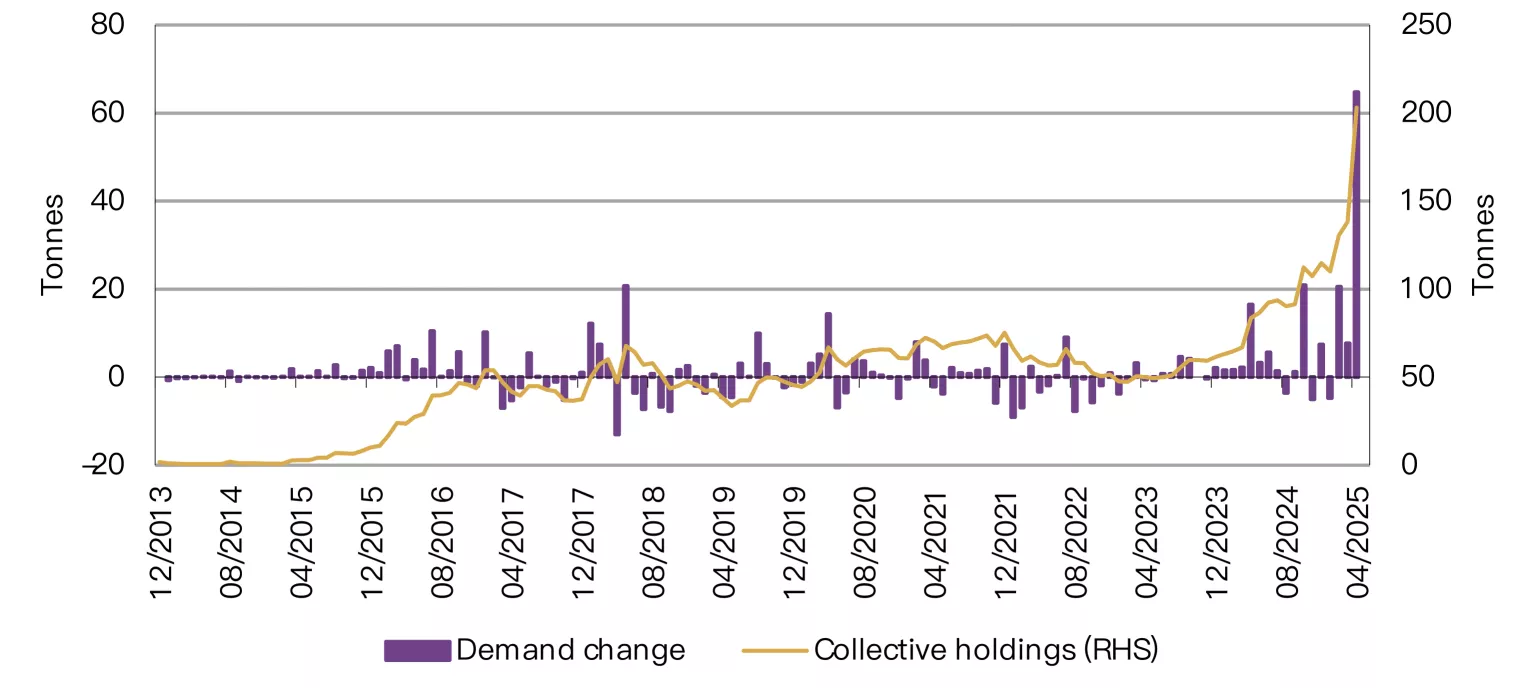
*As of 30 April 2025.
Source: Company filings, World Gold Council
Chinese investor interest in gold futures also reached unseen levels in April (Chart 5). The average daily trading volume of SHFE’s gold futures doubled m/m to reach a record 859t. We believe amplified gold price volatility and the strong gold price performance attracted trader attention, pushing volumes of gold futures notably higher.
Although gold futures trading activities cooled mildly in early May, the average volume during the first five trading days stays near the record high at 756t/day.3 This marks traders’ continued enthusiasm in gold futures despite the price adjustment recently.
Chart 5: Active gold futures trading amidst the strong gold price rally
Average daily trading volume of SHFE gold futures*
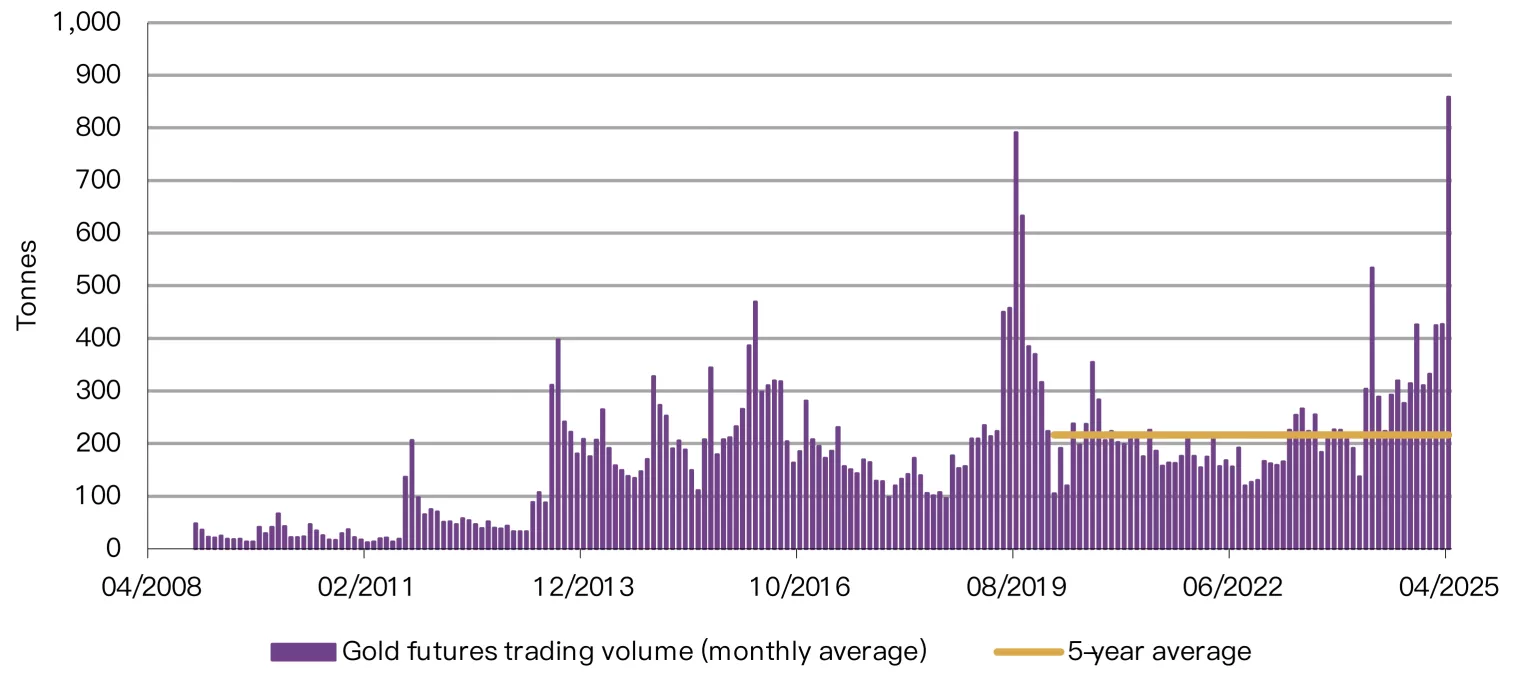
*As of 30 April 2025.
Source: Shanghai Futures Exchange, World Gold Council
The PBoC reported another gold purchase in April
The PBoC’s gold purchasing streak has now extended to six months. Reported gold reserves in China rose 2.2t in April, lifting the total to 2,295t, or 6.8% of overall reserve assets (Chart 6). In value terms, China’s gold reserves rose to US$243.6bn, 6% higher m/m. So far in 2025 China has announced an increase of 14.9t in its official gold holdings.
Chart 6: China reported official gold holdings increase for the sixth consecutive month
Reported official gold holdings and gold as a percentage of total foreign exchange reserves*
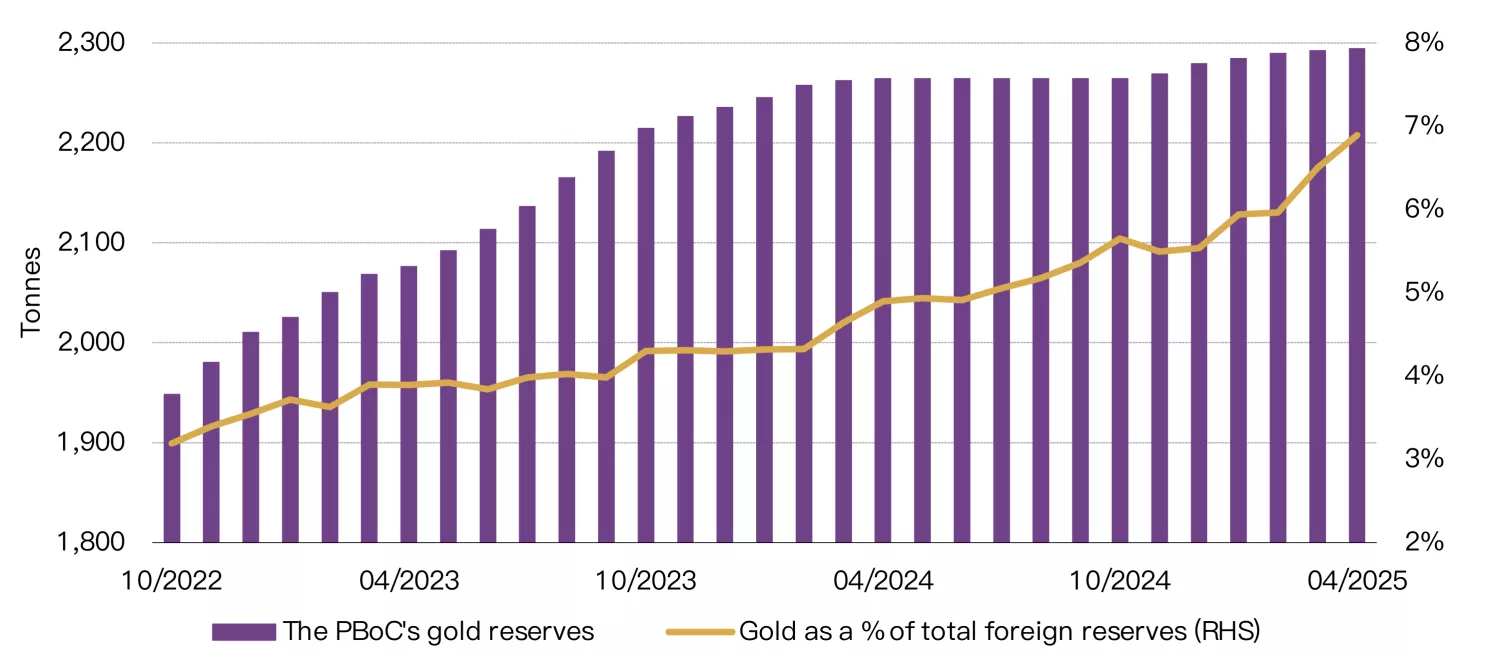
* As of 30 April 2025.
Source: Administration of Foreign Exchange, World Gold Council
Imports remained tepid at the start of 2025
According to the latest data, China imported 46t of gold on a net basis in March (Chart 7). Despite a 14t m/m rebound, this was well below last March’s 183t. And Q1 total imports amounted to 73t, the lowest since 2021 when COVID-related restrictions limited imports, and far below the 545t level in Q1 2024.
Weaker gold jewellery demand during the quarter was a key reason for the slowdown as it helped squeeze the local gold price premium, at times pushing it to a discount, which further discouraged gold importers.
Chart 7: Imports remained tepid in March
7108 gold imports under various regimes*
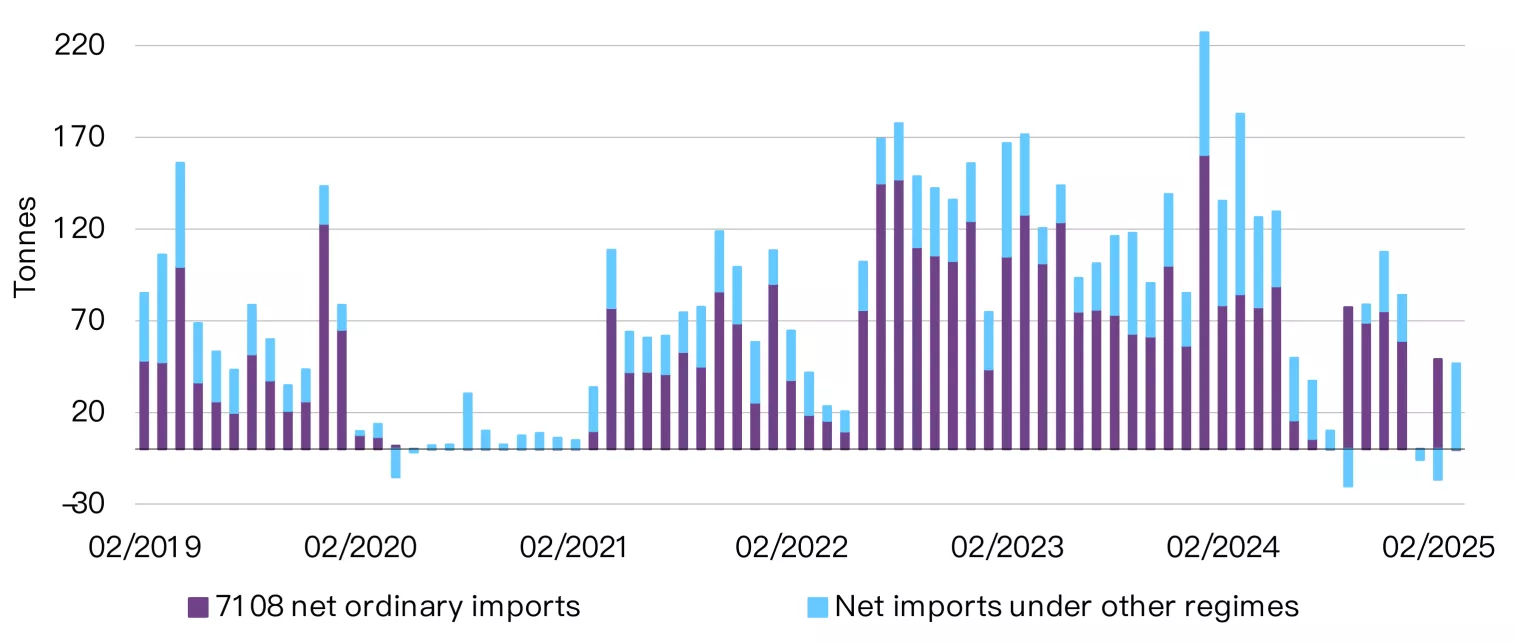
*Based on the latest data available. Data to March 2025.
Source: China Customs, World Gold Council
Footnotes
1The 2025 Labour Day Holiday was between 1 and 5 May.
2See: Joint Statement on U.S.-China Economic and Trade Meeting in Geneva – The White House, 12 May 2025.
3Based on average daily trading volumes of SHFE’s gold futures between 6 and 12 May 2025. 1 – 5 May was the Labour Day Holiday.
Disclaimer
Important information and disclaimers
© 2025 World Gold Council. All rights reserved. World Gold Council and the Circle device are trademarks of the World Gold Council or its affiliates.
All references to LBMA Gold Price are used with the permission of ICE Benchmark Administration Limited and have been provided for informational purposes only. ICE Benchmark Administration Limited accepts no liability or responsibility for the accuracy of the prices or the underlying product to which the prices may be referenced. Other content is the intellectual property of the respective third party and all rights are reserved to them.
Reproduction or redistribution of any of this information is expressly prohibited without the prior written consent of World Gold Council or the appropriate copyright owners, except as specifically provided below. Information and statistics are copyright © and/or other intellectual property of the World Gold Council or its affiliates or third-party providers identified herein. All rights of the respective owners are reserved.
The use of the statistics in this information is permitted for the purposes of review and commentary (including media commentary) in line with fair industry practice, subject to the following two pre-conditions: (i) only limited extracts of data or analysis be used; and (ii) any and all use of these statistics is accompanied by a citation to World Gold Council and, where appropriate, to Metals Focus or other identified copyright owners as their source. World Gold Council is affiliated with Metals Focus.
The World Gold Council and its affiliates do not guarantee the accuracy or completeness of any information nor accept responsibility for any losses or damages arising directly or indirectly from the use of this information.
This information is for educational purposes only and by receiving this information, you agree with its intended purpose. Nothing contained herein is intended to constitute a recommendation, investment advice, or offer for the purchase or sale of gold, any gold-related products or services or any other products, services, securities or financial instruments (collectively, “Services”). This information does not take into account any investment objectives, financial situation or particular needs of any particular person.
Diversification does not guarantee any investment returns and does not eliminate the risk of loss. Past performance is not necessarily indicative of future results. The resulting performance of any investment outcomes that can be generated through allocation to gold are hypothetical in nature, may not reflect actual investment results and are not guarantees of future results. The World Gold Council and its affiliates do not guarantee or warranty any calculations and models used in any hypothetical portfolios or any outcomes resulting from any such use. Investors should discuss their individual circumstances with their appropriate investment professionals before making any decision regarding any Services or investments.
This information may contain forward-looking statements, such as statements which use the words “believes”, “expects”, “may”, or “suggests”, or similar terminology, which are based on current expectations and are subject to change. Forward-looking statements involve a number of risks and uncertainties. There can be no assurance that any forward-looking statements will be achieved. World Gold Council and its affiliates assume no responsibility for updating any forward-looking statements.
Information regarding QaurumSM and the Gold Valuation Framework
Note that the resulting performance of various investment outcomes that can be generated through use of Qaurum, the Gold Valuation Framework and other information are hypothetical in nature, may not reflect actual investment results and are not guarantees of future results. Neither World Gold Council (including its affiliates) nor Oxford Economics provides any warranty or guarantee regarding the functionality of the tool, including without limitation any projections, estimates or calculations.
