Gold Demand Trends Q1 1997
The assaying and refining of gold - a guide for the gold jewellery producer
Gold Demand Trends Q4 1996
Unearthed: U.S. Politics, Economics, and Gold Markets: A Look Ahead, ft Robert Armstrong
Unearthed Podcast
World Gold CouncilIn this episode of Unearthed, co-hosts Joe Cavatoni and John Reade, Senior Market Strategists for the World Gold Council, are joined by Robert Armstrong, US financial markets editor at the Financial Times and author of the Unhedged newsletter. Filmed on 15th January 2025, together they explore how shifts in US fiscal policy, geopolitical uncertainty, and changes in bond yields are influencing financial markets and the gold industry.
Armstrong shares his perspective on key economic themes, including the resilience of the US economy, contrasting global economic challenges, and the dynamics of gold demand from central banks and investors. The trio looks into potential policy changes under the new Republican administration, examining tariffs, tax reforms, and immigration policy—as well as their implications for inflation and broader economic stability. As we publish this episode, just over a month later, it’s remarkable to see how the gold market and gold price have shifted and how the global picture has already changed.
Disclaimer
Important information and disclaimers
© 2025 World Gold Council. All rights reserved. World Gold Council and the Circle device are trademarks of the World Gold Council or its affiliates.
All references to LBMA Gold Price are used with the permission of ICE Benchmark Administration Limited and have been provided for informational purposes only. ICE Benchmark Administration Limited accepts no liability or responsibility for the accuracy of the prices or the underlying product to which the prices may be referenced. Other content is the intellectual property of the respective third party and all rights are reserved to them.
Reproduction or redistribution of any of this information is expressly prohibited without the prior written consent of World Gold Council or the appropriate copyright owners, except as specifically provided below. Information and statistics are copyright © and/or other intellectual property of the World Gold Council or its affiliates or third-party providers identified herein. All rights of the respective owners are reserved.
The use of the statistics in this information is permitted for the purposes of review and commentary (including media commentary) in line with fair industry practice, subject to the following two pre-conditions: (i) only limited extracts of data or analysis be used; and (ii) any and all use of these statistics is accompanied by a citation to World Gold Council and, where appropriate, to Metals Focus or other identified copyright owners as their source. World Gold Council is affiliated with Metals Focus.
The World Gold Council and its affiliates do not guarantee the accuracy or completeness of any information nor accept responsibility for any losses or damages arising directly or indirectly from the use of this information.
This information is for educational purposes only and by receiving this information, you agree with its intended purpose. Nothing contained herein is intended to constitute a recommendation, investment advice, or offer for the purchase or sale of gold, any gold-related products or services or any other products, services, securities or financial instruments (collectively, “Services”). This information does not take into account any investment objectives, financial situation or particular needs of any particular person.
Diversification does not guarantee any investment returns and does not eliminate the risk of loss. Past performance is not necessarily indicative of future results. The resulting performance of any investment outcomes that can be generated through allocation to gold are hypothetical in nature, may not reflect actual investment results and are not guarantees of future results. The World Gold Council and its affiliates do not guarantee or warranty any calculations and models used in any hypothetical portfolios or any outcomes resulting from any such use. Investors should discuss their individual circumstances with their appropriate investment professionals before making any decision regarding any Services or investments.
This information may contain forward-looking statements, such as statements which use the words “believes”, “expects”, “may”, or “suggests”, or similar terminology, which are based on current expectations and are subject to change. Forward-looking statements involve a number of risks and uncertainties. There can be no assurance that any forward-looking statements will be achieved. World Gold Council and its affiliates assume no responsibility for updating any forward-looking statements.
Information regarding QaurumSM and the Gold Valuation Framework
Note that the resulting performance of various investment outcomes that can be generated through use of Qaurum, the Gold Valuation Framework and other information are hypothetical in nature, may not reflect actual investment results and are not guarantees of future results. Neither World Gold Council (including its affiliates) nor Oxford Economics provides any warranty or guarantee regarding the functionality of the tool, including without limitation any projections, estimates or calculations.
You asked, we answered: Is the threat of US tariffs moving the gold market?
Juan Carlos Artigas
Regional CEO (Americas) and Global Head of Research World Gold CouncilJohn Reade
Senior Market Strategist World Gold CouncilKey highlights
- The gold market has seen a significant rise in COMEX gold inventories, along with a widening of the spread between futures and spot prices, sparked by tariff uncertainty
- This, combined with reports of falling inventories in London, has fuelled speculation about stability in the gold market
- Events like these have happened before and the market has normalised
- As such, we believe that the disruptions will likely ease… although the current environment of elevated geoeconomic risks could result in intermittent spikes
- Most importantly, despite all the noise, the gold spot market has remained well behaved – and has generally benefited from flight-to-quality flows.
Gold bullion flows West amidst tariff uncertainty
In late 2024 COMEX inventories started to rise as concerns grew that tariffs could impact gold imports.1 This surge of gold imports into the US caught many gold market observers by surprise, as the country is (more or less) self-sufficient in its gold needs, being both a significant producer and a consumer.2 While gold itself hasn’t been directly targeted, speculation and shifting risk management strategies amid concerns of broad-based tariffs have still had a noticeable impact on prices and trading patterns. This trend has continued into early 2025 and, as of date, COMEX registered and eligible inventories have increased by nearly 300t (9mn oz) and more than 500t (17mn oz), respectively (Chart 1).
Chart 1: COMEX gold inventories reach COVID highs
Reported COMEX inventories for registered and eligible gold*
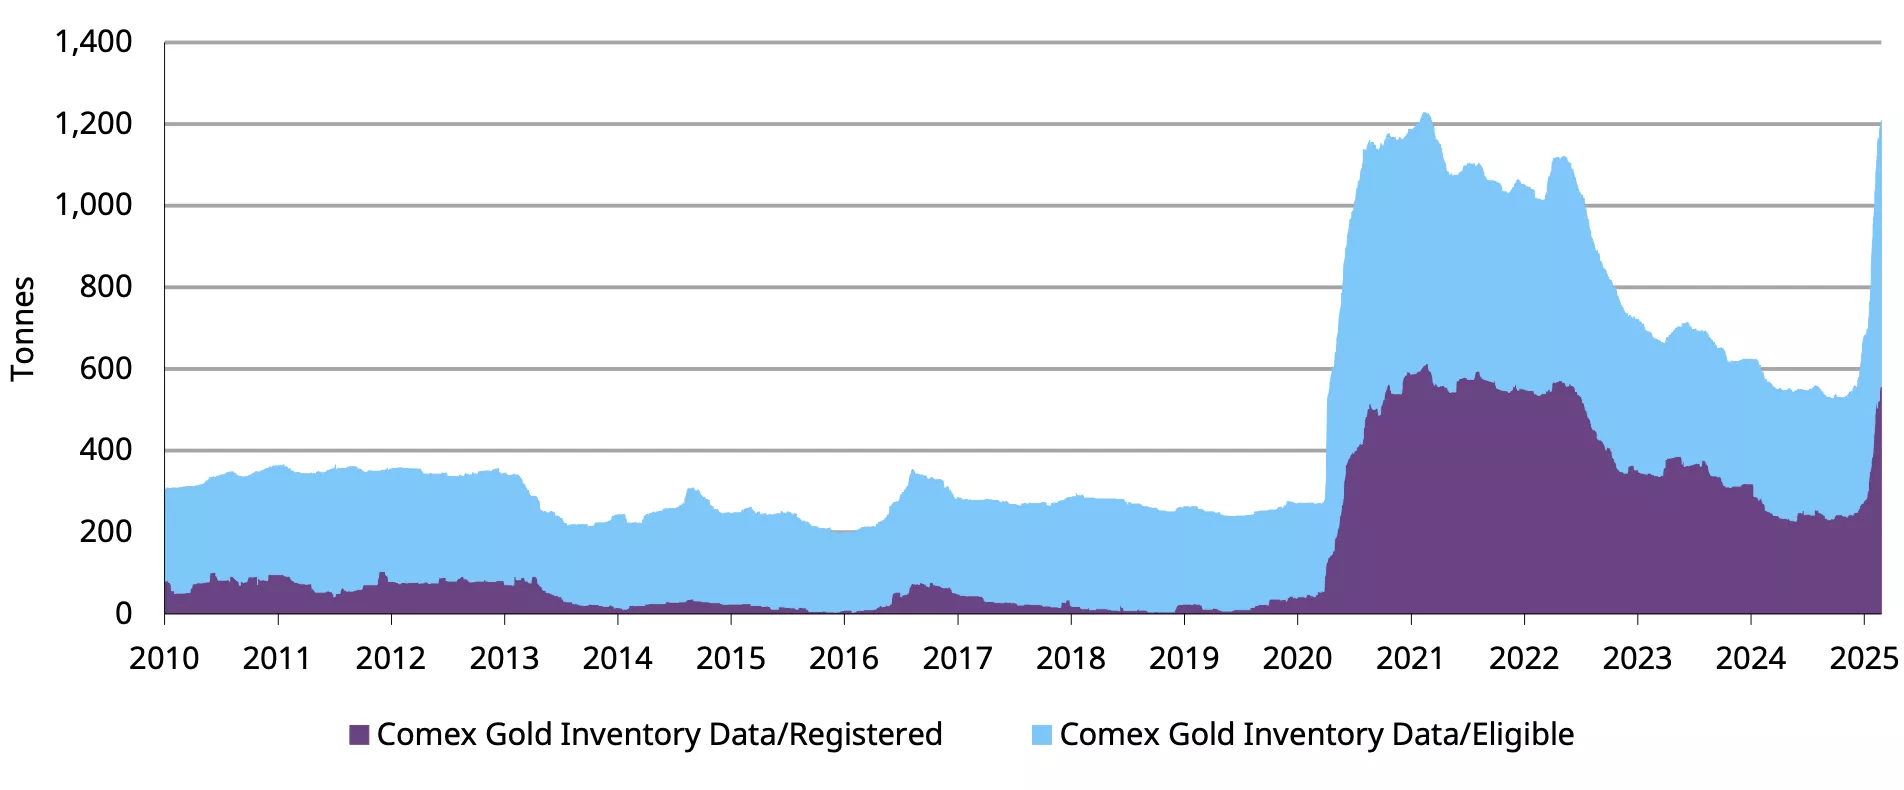
*Data to 24 February 2025. Note: Registered metals are those metals which meet the standards for delivery under the gold, silver, copper, or aluminium futures contracts and for which a receipt from an exchange-approved depository or warehouse has been issued. Eligible metals are those which meet the delivery standards as stated in the rules for which no receipt from an exchange-approved warehouse has been issued.
Source: Bloomberg, World Gold Council
By way of context, short-term speculators and some investors often hold large net-long gold futures positions on the COMEX futures market, while banks and other financial institutions short these futures contracts as counterparties. But these financial institutions are generally not short gold; instead, they run long over-the-counter (OTC) positions to hedge their futures shorts. And because physical gold is more often found in the London OTC market – as a large trading hub and often a cheaper location in which to vault gold – financial institutions typically prefer to hold these hedges in London, knowing that they can quickly – in normal market times – ship gold to the US when there is a need. In recent months, many traders have chosen to pre-empt the threat of tariffs by moving gold to the US, thus avoiding the possibility that they may have to pay higher charges.
Alongside the increase in inventories, the price of COMEX gold futures contracts – and their spread to spot gold traded in London – also rose, with traders factoring in potential tariff-related costs. For example, the spread between the COMEX active gold futures contract and gold spot reached as much as US$40/oz to US$50/oz (140-180 bps), significantly above the US$13/oz (60 bps) average from the past two years.3
Now…this is not new. COMEX inventories – and the differential between futures and spot prices – have risen before, most notably at the onset of the COVID pandemic.
The main question from investors, amidst reports of falling inventories, is: can gold’s largest OTC trading hub, London, cope with the market disruption? We can look at past examples for guidance and analyse all the currently available data to offer an informed opinion – considering, of course, the heightened level of uncertainty all financial markets are experiencing in the current environment.
London inventories have fallen… but not as much as some think
As COMEX inventories rose during COVID, London inventories fell. And both eventually normalised. At present, total LBMA reported inventories stand at approx. 8,500t (Chart 2), out of which approx. 5,200t are held at the Bank of England (BoE). And while there are reports of queues to retrieve gold, it is important to note that BoE operates differently from commercial vaults – longer wait times create a perception of scarcity that is more likely explained by logistics.4
Another consequence has been an increase in gold’s lending rate. A calculation based on overnight borrowing rates and gold swap rates, as a proxy, suggests that one-month lease rates reached as high as 5% during January, reflecting ‘tightness’ in the London gold market (Chart 3).
Chart 2: Gold vaulted in London has dropped but remains above its 2020 level
Estimated gold stock in London, tonnes*
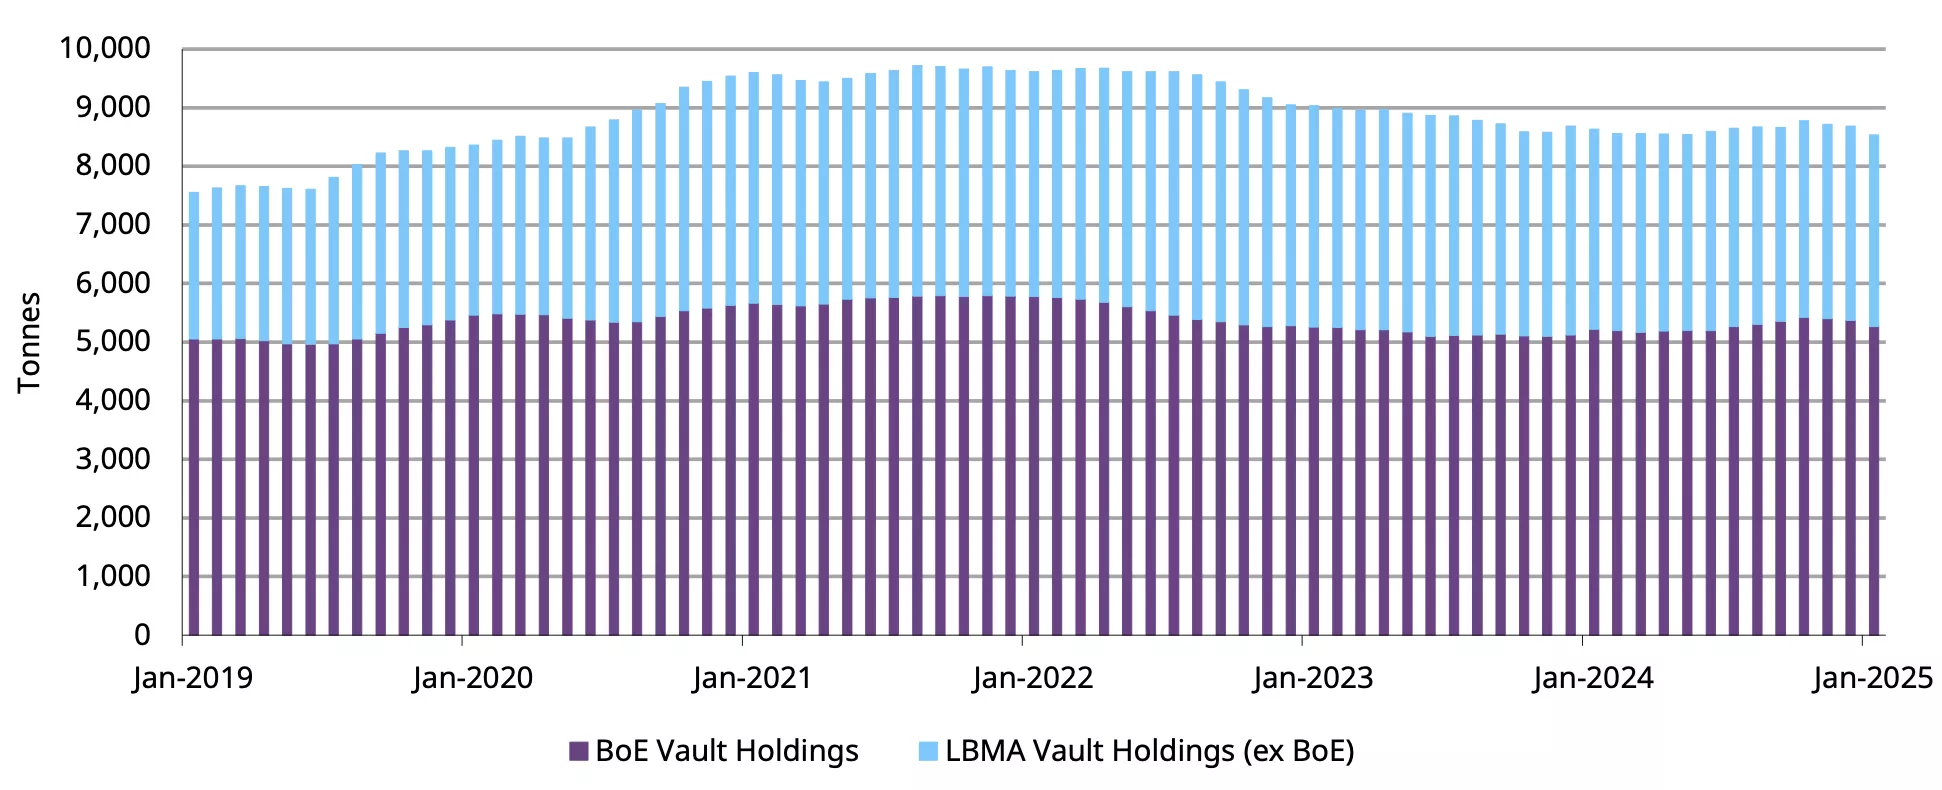
*Data to 31 January 2025.
Source: Bank of England, London Bullion Market Association, World Gold Council
Gold’s diverse sources of supply can promote normalisation
Trade data from the Census Bureau suggests that a good portion of gold flowing into the US comes from Switzerland. In turn, some of this gold could have originated in the UK as it needs to be refined from Good Delivery (~400 oz) bars into 1 kg bars – the weight accepted for delivery into COMEX futures.5 Other sources of gold include Canada, Latin America, Australia and, to a lesser degree, Hong Kong. And then there’s gold from domestic mine production – the US being the fifth largest producer globally – which can be refined locally.
Of course, gold flowing into the US from around the world may limit the amount of gold going into other markets, including London, but we believe that the impact should be temporary. This is especially true as gold has multiple sources of supply – mine production and recycling – spread around the world, reducing the reliance on imported gold to meet local demand in the medium term.
A few signs of normality are starting to emerge: the buildup of COMEX inventories has slowed; the spread differential between gold futures and spot prices is falling,6 and the bid-ask spread for gold ETFs – many of which vault their gold in London – remain well behaved.7 In addition, the lease rates also seems to be cooling down, with data suggesting it is now closer to 1% and well below January’s record high (Chart 3).
While part of gold’s strong price performance could be attributed to momentum, our analysis suggests that it has been supported by flight-to-quality flows amid increased financial market volatility driven by geoeconomic and geopolitical concerns.8
Chart 3: Gold lease rates have cooled after reaching record highs
Indicative gold lease rates*
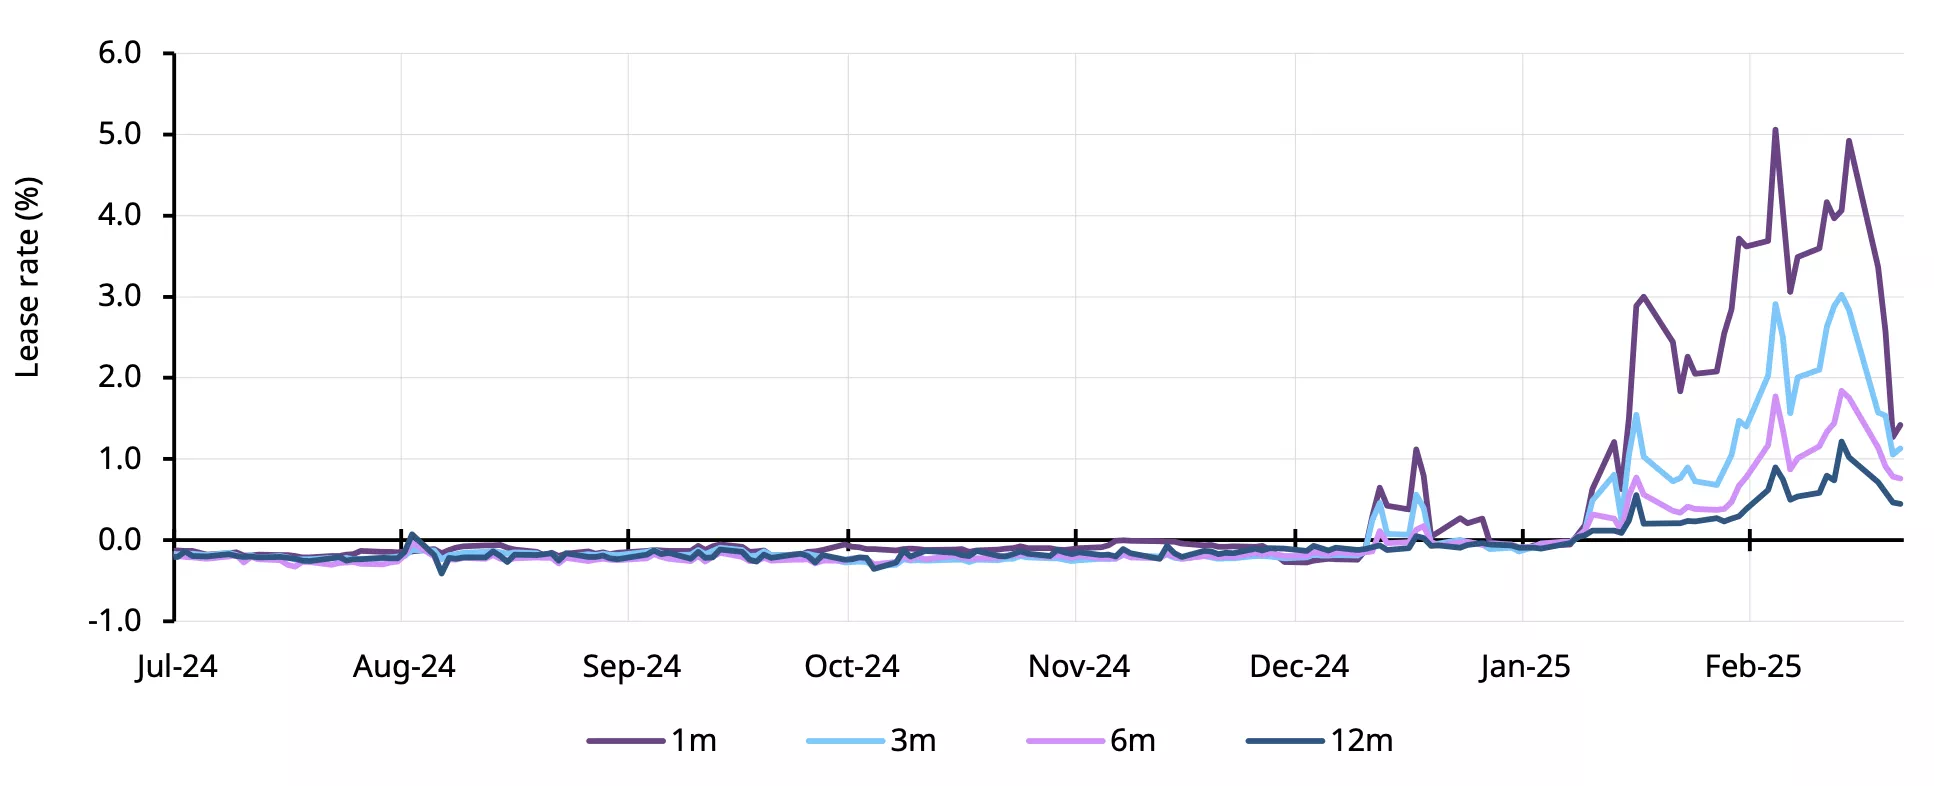
*Data to 21 February 2025. Indicative lease rates estimated by subtracting the gold swap rate from the Secured Overnight Financing Rate (SOFR) forwards for various tenors.
Source: Bloomberg, World Gold Council
In summary
Gold has not been a direct target of tariffs, but market reactions to trade uncertainty has driven a significant shift in trading behaviour and impacted the gold price. The movement of gold from London to the US, rising COMEX premiums and concerns over availability were largely the result of risk management decisions rather than true supply issues.
Now that COMEX inventories appear to be well-stocked and the backlog of withdrawals from the BoE continues to be cleared, these disruptions should ease over the coming weeks. However, this period serves as a stark reminder that even indirect trade policy concerns can send ripples through global financial markets.
This may not be the last time we see temporary distortions in the gold market. The signs are, however, that the depth and liquidity of the gold market is able to absorb – over time – most of these shocks.
Footnotes
1See: Unearthed: Gold price soars amid tariff concerns | Post by Unearthed Podcast | Gold Focus blog | World Gold Council
2Trade data from US Census Bureau and our demand/supply estimates imply that the US often alternates between being a net importer or a net exporter, suggesting that the market over the long-term is largely in balance.
3As of 25 February 2025. Estimate based on the difference between the rolling COMEX futures active contract and spot gold price (XAU).
4The Bank of England holds gold on behalf of many central banks and offers gold accounts to commercial banks that conduct business with central banks. See: StoneX Bullion, How much gold is kept in the Bank of England? October 2024. But the bank does not have the staff levels to be able to respond quickly to a sudden increase in demand for gold movements. As Dave Ramsden, Deputy Governor for Markets and Banking at the Bank of England said at a press conference in February, “If you were coming in new to us, you might have to wait a bit longer because all the existing slots are booked up. But this is a very orderly process. It’s an obvious point, but gold is a physical asset, so there are real logistical constraints and security constraints." See: Bloomberg, BOE says tariffs premium is fueling clamor to withdraw gold, February 2025.
5COMEX gold futures also accepts 100 oz bars for delivery, but these are less common in the market as they have fallen out of use.
6The average difference between the COMEX gold actives futures contract and spot gold price was US$20/oz (70bps) during February.
7For example, based on Bloomberg data as of 24 February, GLD’s average spread in 2025 has widened marginally from its 2024 average, and is below some of the levels seen during COVID, while the average spreads of funds such as GLDM, IAU, SGOL, and IGLN among others have remained unchanged over this period.
8Y-t-d, as of 24 February, gold ETFs have amassed inflows of US$10.3bn, increasing holding by 113t – the strongest two-month period in two years.
Disclaimer
Important information and disclaimers
© 2025 World Gold Council. All rights reserved. World Gold Council and the Circle device are trademarks of the World Gold Council or its affiliates.
All references to LBMA Gold Price are used with the permission of ICE Benchmark Administration Limited and have been provided for informational purposes only. ICE Benchmark Administration Limited accepts no liability or responsibility for the accuracy of the prices or the underlying product to which the prices may be referenced. Other content is the intellectual property of the respective third party and all rights are reserved to them.
Reproduction or redistribution of any of this information is expressly prohibited without the prior written consent of World Gold Council or the appropriate copyright owners, except as specifically provided below. Information and statistics are copyright © and/or other intellectual property of the World Gold Council or its affiliates or third-party providers identified herein. All rights of the respective owners are reserved.
The use of the statistics in this information is permitted for the purposes of review and commentary (including media commentary) in line with fair industry practice, subject to the following two pre-conditions: (i) only limited extracts of data or analysis be used; and (ii) any and all use of these statistics is accompanied by a citation to World Gold Council and, where appropriate, to Metals Focus or other identified copyright owners as their source. World Gold Council is affiliated with Metals Focus.
The World Gold Council and its affiliates do not guarantee the accuracy or completeness of any information nor accept responsibility for any losses or damages arising directly or indirectly from the use of this information.
This information is for educational purposes only and by receiving this information, you agree with its intended purpose. Nothing contained herein is intended to constitute a recommendation, investment advice, or offer for the purchase or sale of gold, any gold-related products or services or any other products, services, securities or financial instruments (collectively, “Services”). This information does not take into account any investment objectives, financial situation or particular needs of any particular person.
Diversification does not guarantee any investment returns and does not eliminate the risk of loss. Past performance is not necessarily indicative of future results. The resulting performance of any investment outcomes that can be generated through allocation to gold are hypothetical in nature, may not reflect actual investment results and are not guarantees of future results. The World Gold Council and its affiliates do not guarantee or warranty any calculations and models used in any hypothetical portfolios or any outcomes resulting from any such use. Investors should discuss their individual circumstances with their appropriate investment professionals before making any decision regarding any Services or investments.
This information may contain forward-looking statements, such as statements which use the words “believes”, “expects”, “may”, or “suggests”, or similar terminology, which are based on current expectations and are subject to change. Forward-looking statements involve a number of risks and uncertainties. There can be no assurance that any forward-looking statements will be achieved. World Gold Council and its affiliates assume no responsibility for updating any forward-looking statements.
Information regarding QaurumSM and the Gold Valuation Framework
Note that the resulting performance of various investment outcomes that can be generated through use of Qaurum, the Gold Valuation Framework and other information are hypothetical in nature, may not reflect actual investment results and are not guarantees of future results. Neither World Gold Council (including its affiliates) nor Oxford Economics provides any warranty or guarantee regarding the functionality of the tool, including without limitation any projections, estimates or calculations.
China’s gold market in October: unseen price records bring unprecedented gold ETF inflows
Ray Jia
Head of Research (Asia Pacific, ex-India) and Deputy Head of Trade Engagement (China) World Gold CouncilKey highlights:
- Gold’s rising streak extended to four months. The LBMA Gold Price AM in USD increased by 4.9% and the Shanghai Gold Benchmark PM (SHAUPM) in RMB jumped 6.7% – due mainly to a weaker local currency.
- A total of 107t gold left Shanghai Gold Exchange (SGE) in October, a m/m decline of 6%. Disappointing sales boost during the early October Golden Week and ample stocks – replenished in September – weakened wholesale demand. Meanwhile, the y/y weakness prevailed, falling 11% compared to last October and 21% below the 10-year average.
- Demand for Chinese gold ETFs surged, adding RMB13bn (+US$1.8bn, +21t) in October, the largest monthly inflow ever. Their total assets under management (AUM) surged to RMB69bn (US$10bn) and collective holdings reached 112t, both recording their historical highs.
- The gold price rally also ignited investor interest in gold futures at the Shanghai Futures Exchange (SHFE), resulting in a 32% m/m jump in the average daily trading volumes during October.
Looking ahead
- Amidst the stabilising local gold price and seasonality, we expect wholesale gold demand to rebound in coming months.
- Meanwhile, high-frequency indicators including services and manufacturing Purchasing Managers Index (PMI) have picked up notably in October, reflecting the boost from recent stimulus. And with most commercial banks starting to cut mortgage rates and allowing more frequent rate repricing cycles, households’ disposable income growth may receive some support.1 In general, improved economic growth momentum should be beneficial to Chinese gold consumption.
- But it is also important to reiterate that as China’s property market revives, bar and coin investment may face some competition as real estate is another key traditional value-preservation channel for Chinese households.2
Gold’s rally continued in October (Chart 1). Despite higher opportunity costs – namely the rising US Treasury yield and a stronger dollar – elevated safe-haven demand to hedge against geopolitical risks in the Middle East and uncertainties of the US election supported gold during the month.
Chart 1: The gold price rally streak extended to four months
Monthly changes of SHAUPM and LBMA Gold Price AM*
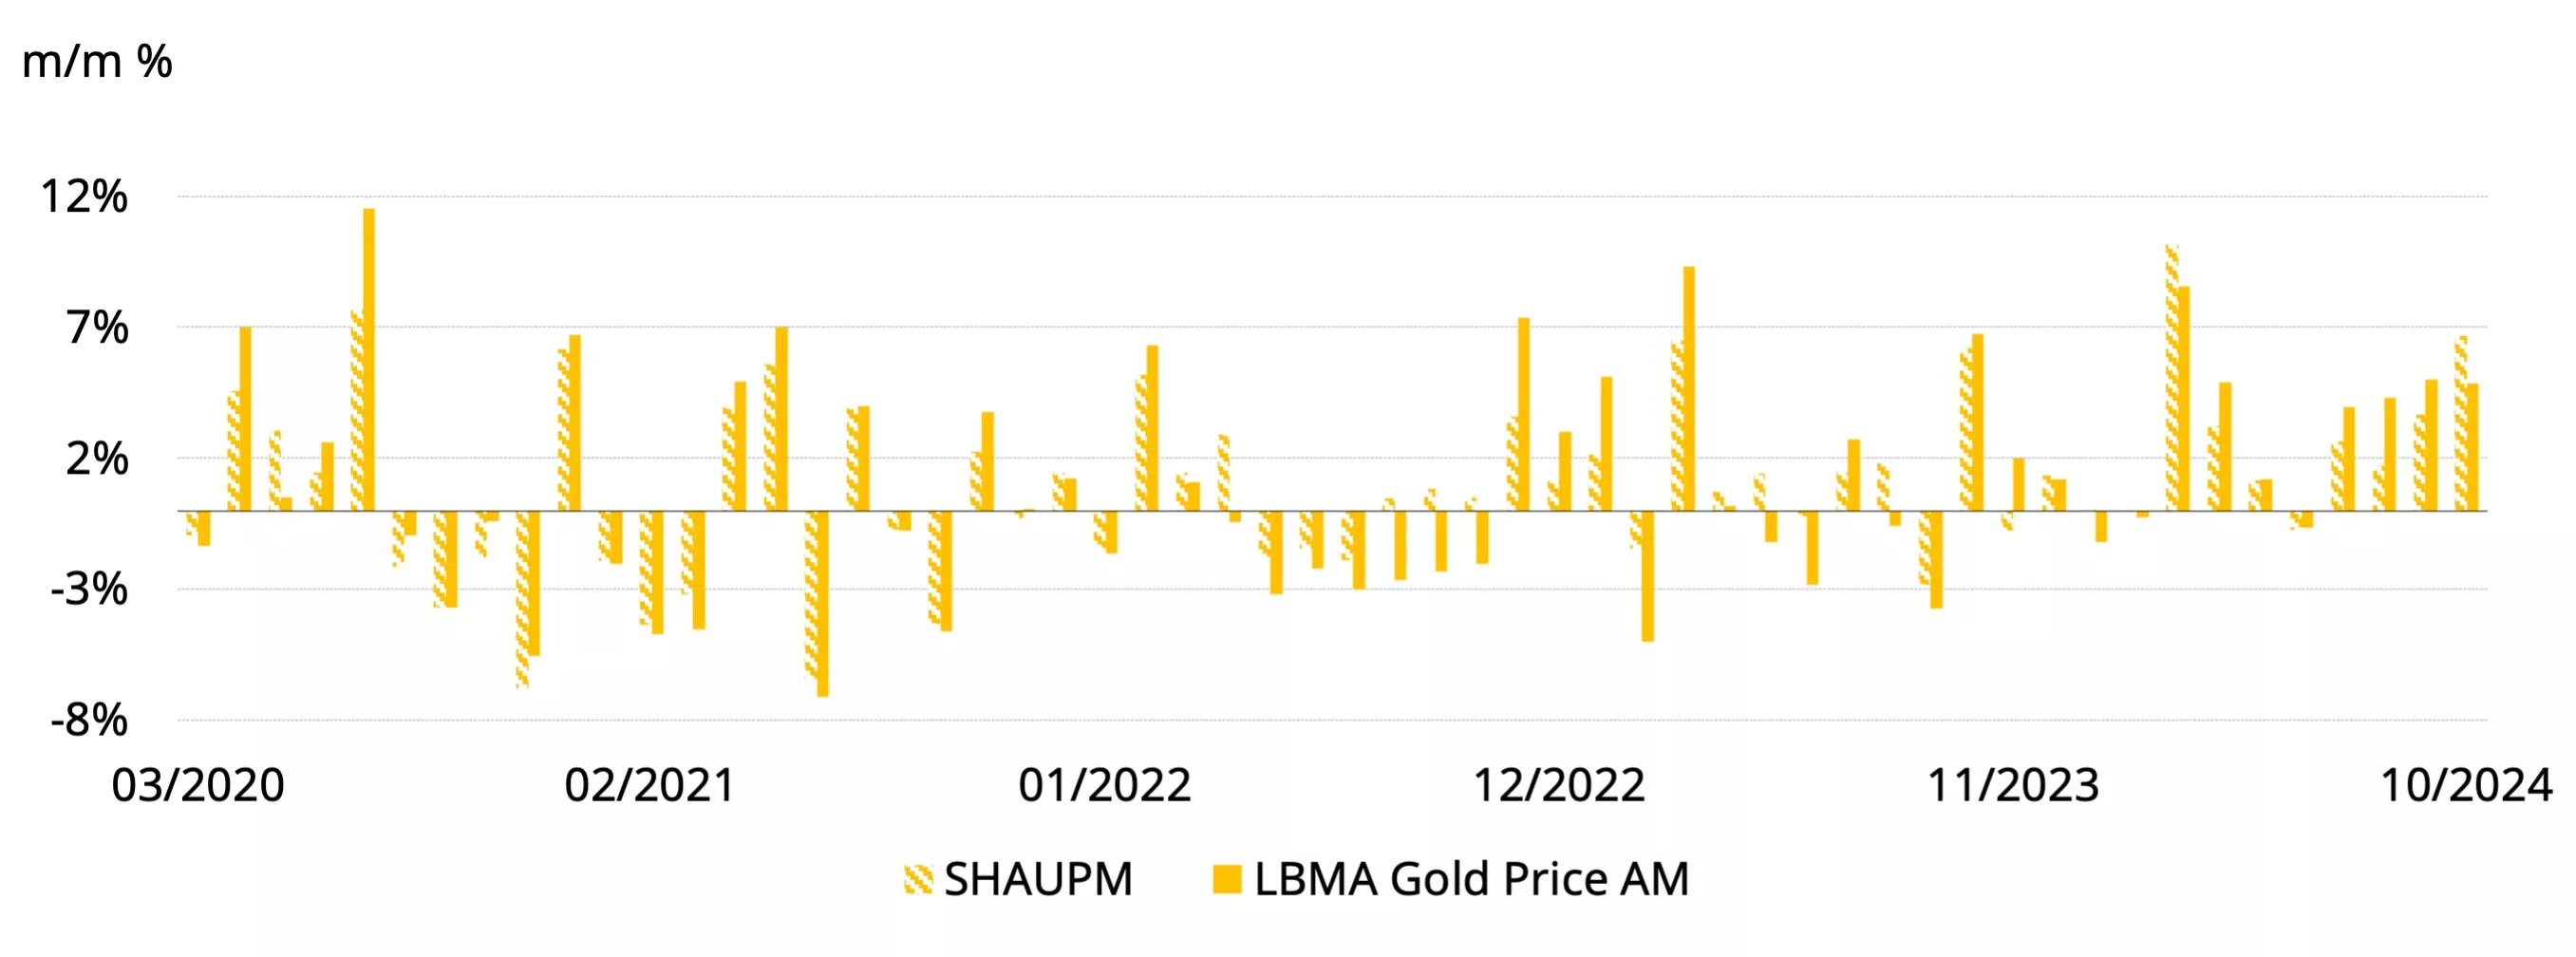
*Note: We compare the LBMA Gold Price AM to SHAUPM because the trading windows used to determine them are closer to each other than those for the LBMA Gold Price PM. For more information about Shanghai Gold Benchmark Prices please visit Shanghai Gold Exchange.
Source: Bloomberg, Shanghai Gold Exchange, World Gold Council
Another strong month took the RMB gold price’s y-t-d return to 29%, the best year so far since the SGE’s establishment in 2002 (Chart 2). And it is also worth noting that the local gold price has refreshed record highs 39 times so far in 2024, attracting tremendous investor attention.
Chart 2: Gold has repeatedly refreshed record highs so far this year*
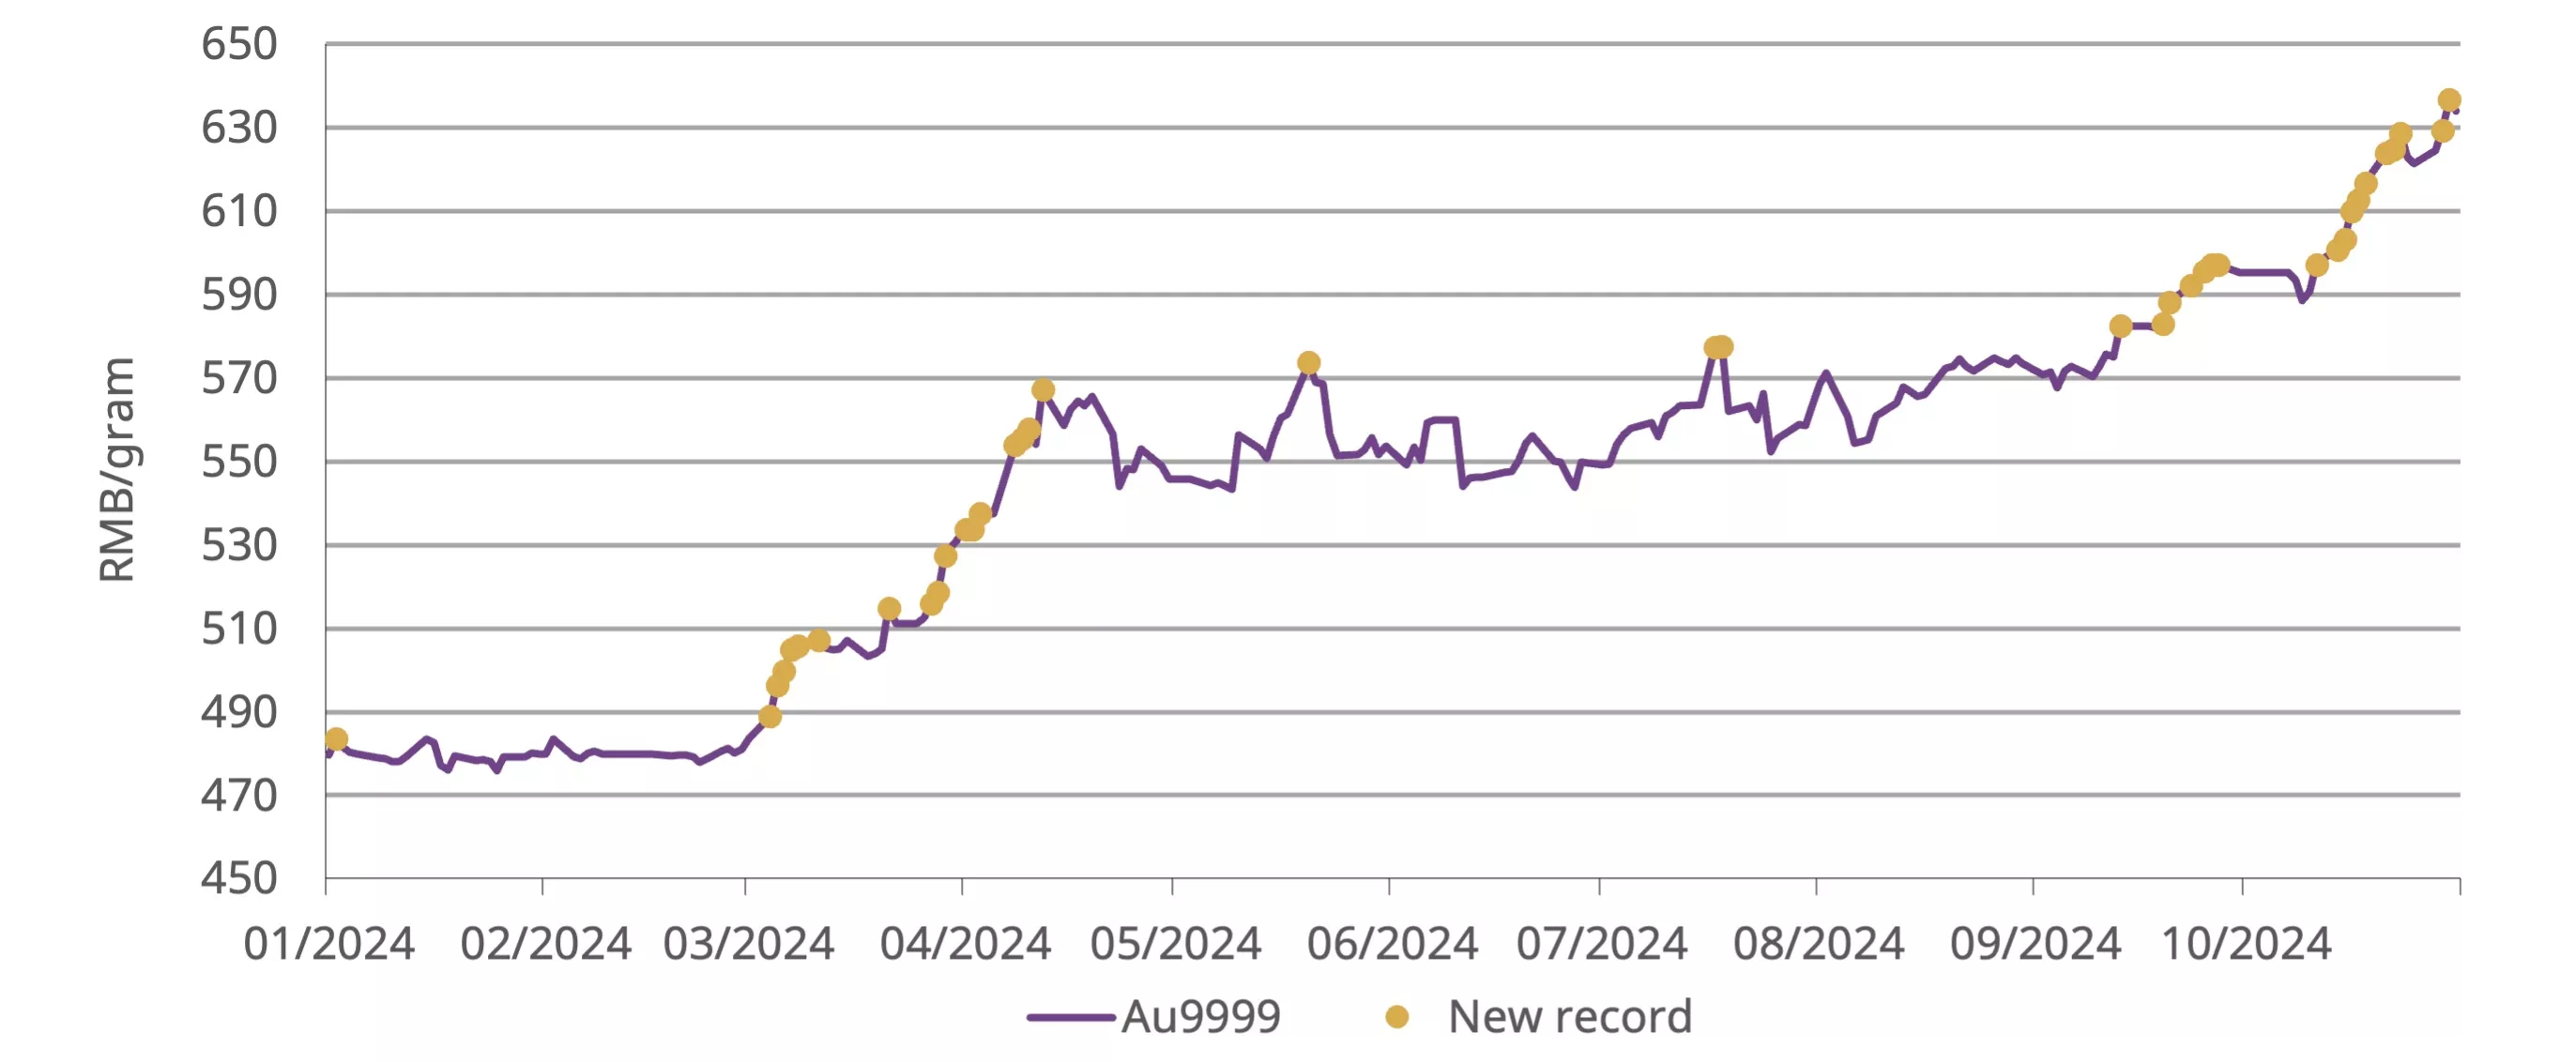
*As of 31 October 2024. Based on the Au9999 as SHAUPM only dates back to 2016. Both are widely used in China as benchmarks with virtually no difference.
Source: Shanghai Gold Exchange, World Gold Council
October’s gold withdrawals from the SGE totalled 107t, a 6% m/m decline and an 11% fall y/y (Chart 3). Historical data shows that China’s wholesale gold demand tends to fall in October following the industry’s active replenishment in September ahead of the early October Golden Week – a traditional peak season for gold consumption.
Although the seasonal m/m drop is the smallest since 2014, continued y/y weakness remains notable. Conversations with gold jewellery market participants indicate softer-than-expected demand boost from the seven-day Golden Week at the beginning of October. The combination of the surging gold price and wallet share competition from travel and other experiential consumption weakened gold jewellery sales, leading to reduced re-stocking needs. The continued Chinese gold price discount compared to its international peer – averaging US$13/oz in October – was also a reflection of weakened demand in general.
Chart 3: Wholesale demand remained weak compared to previous years
Gold withdrawals from the SGE in 2024 and the 10-year average*
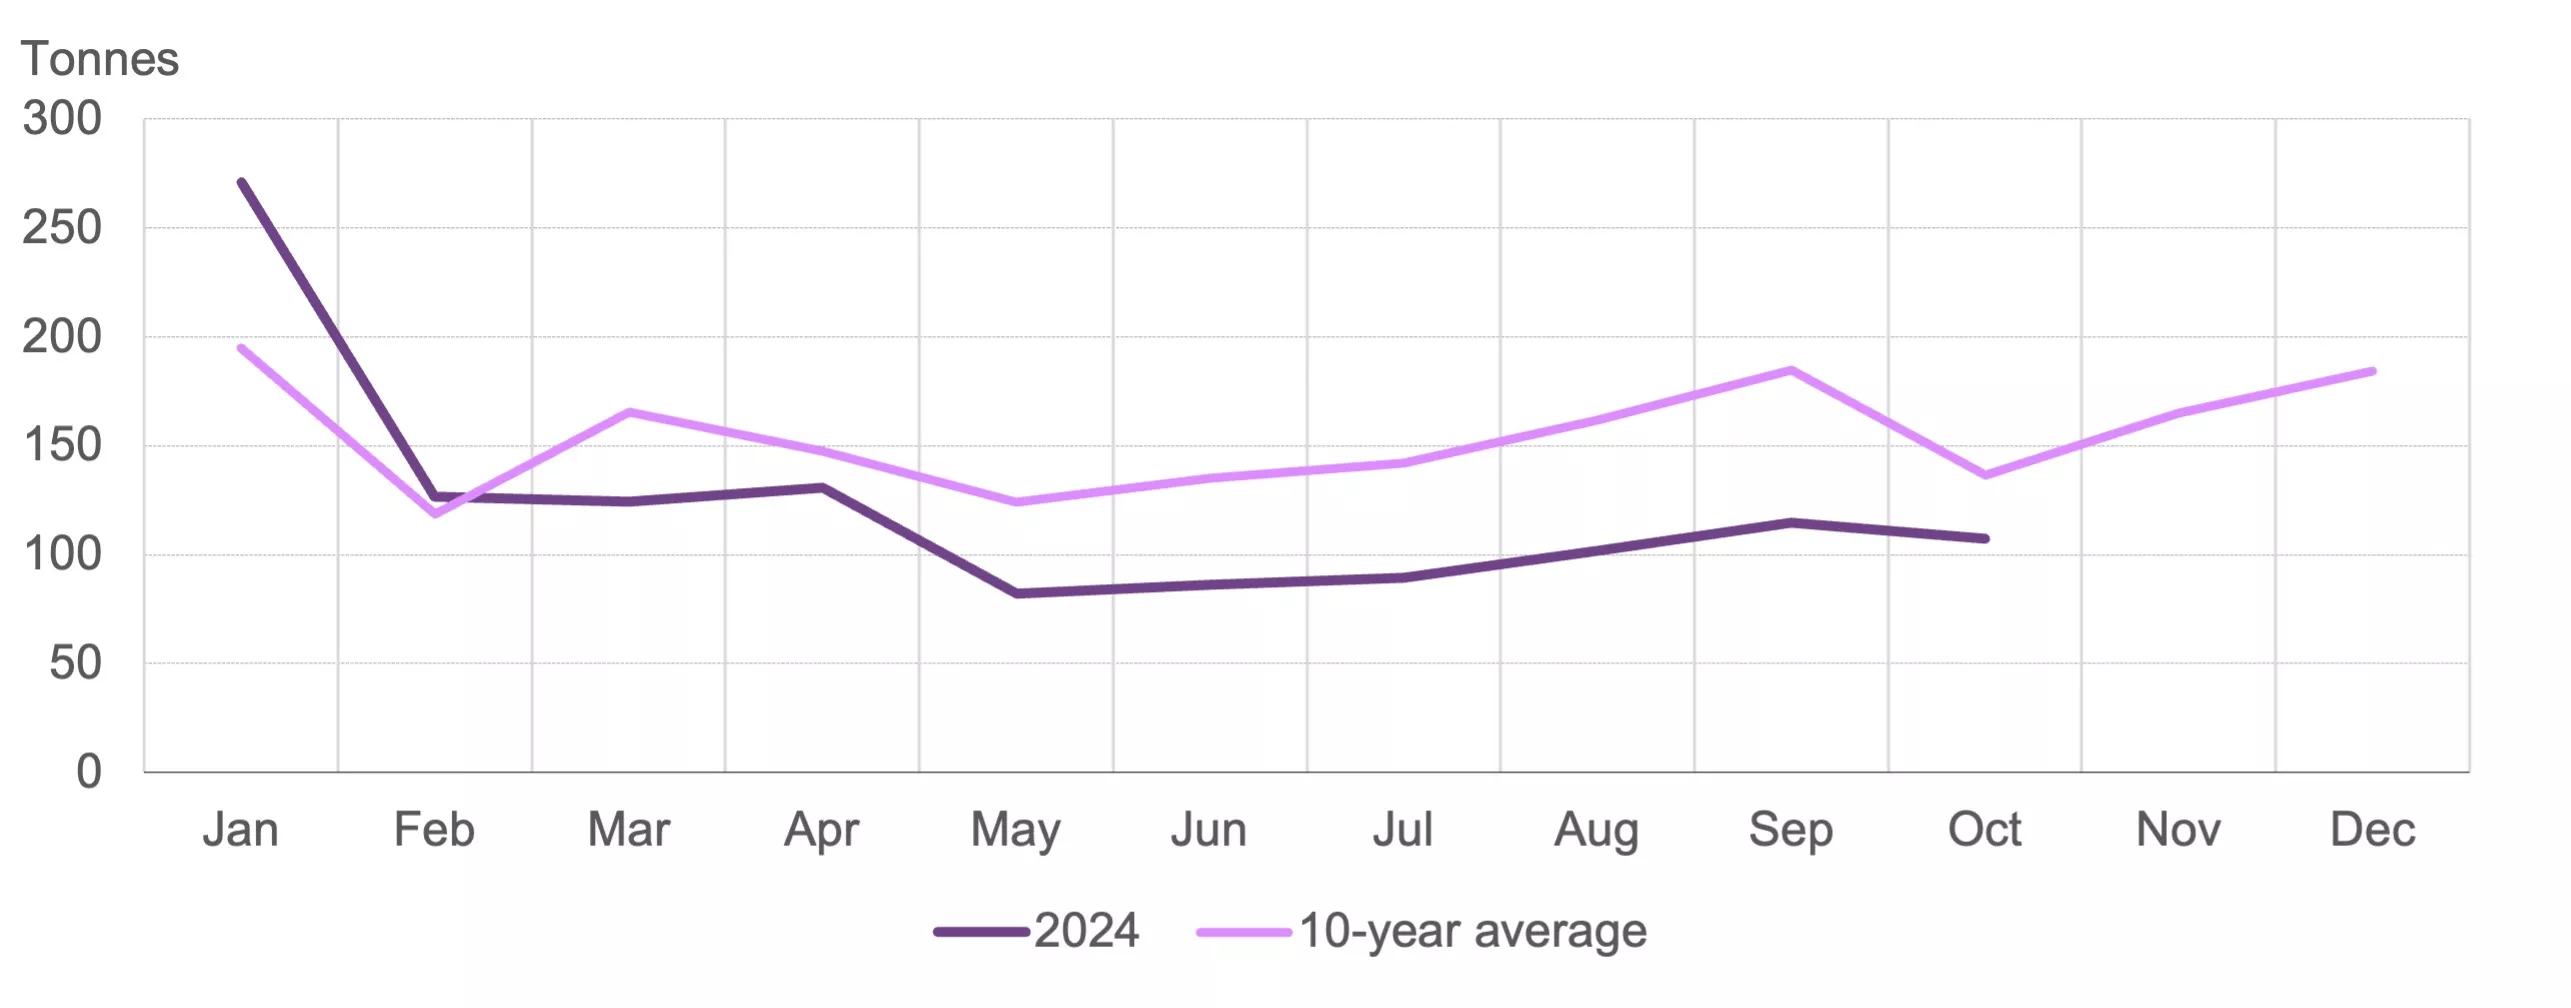
*10-year average based on data between 2014 and 2023.
Source: Shanghai Gold Exchange, World Gold Council
Chinese gold ETFs experienced their strongest month in history (Chart 4), adding RMB13bn (+US$1.9bn). Sizable inflows and a surge in the gold price pushed their total AUM to another record high of RMB69bn (US$10bn). Collective holdings jumped by 21t to 112t, also a new record. October took Chinese gold ETFs’ y-t-d demand to a stunning 51t (+RMB30bn, +US$4.1bn), higher than any annual total in history.
Chart 4: October marks the strongest month for Chinese gold ETF inflows
Monthly Chinese gold ETF inflows and AUM
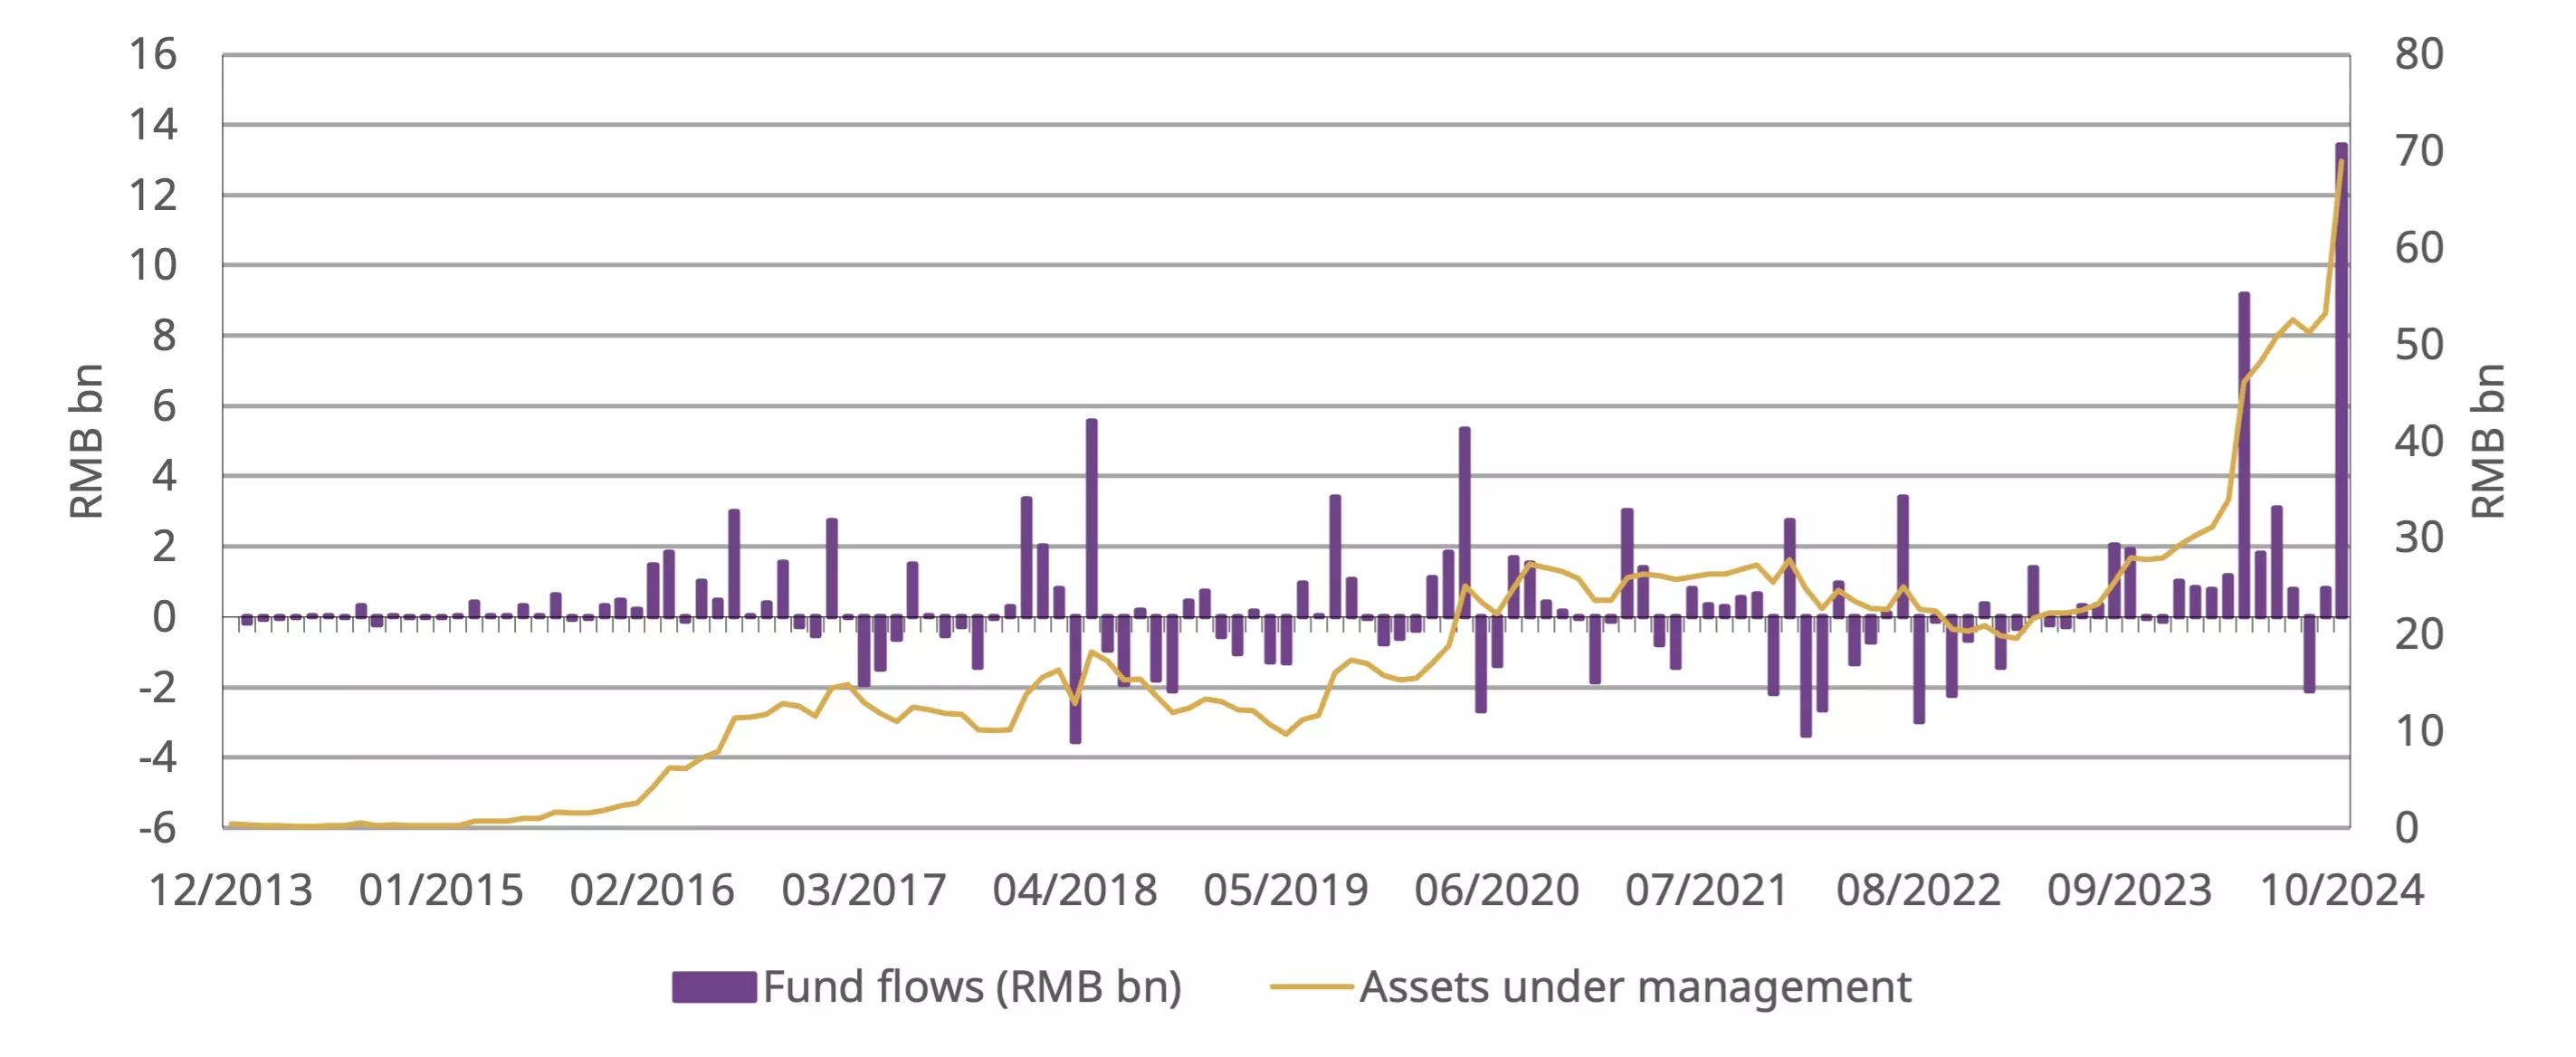
Source: ETF providers, Shanghai Gold Exchange, World Gold Council
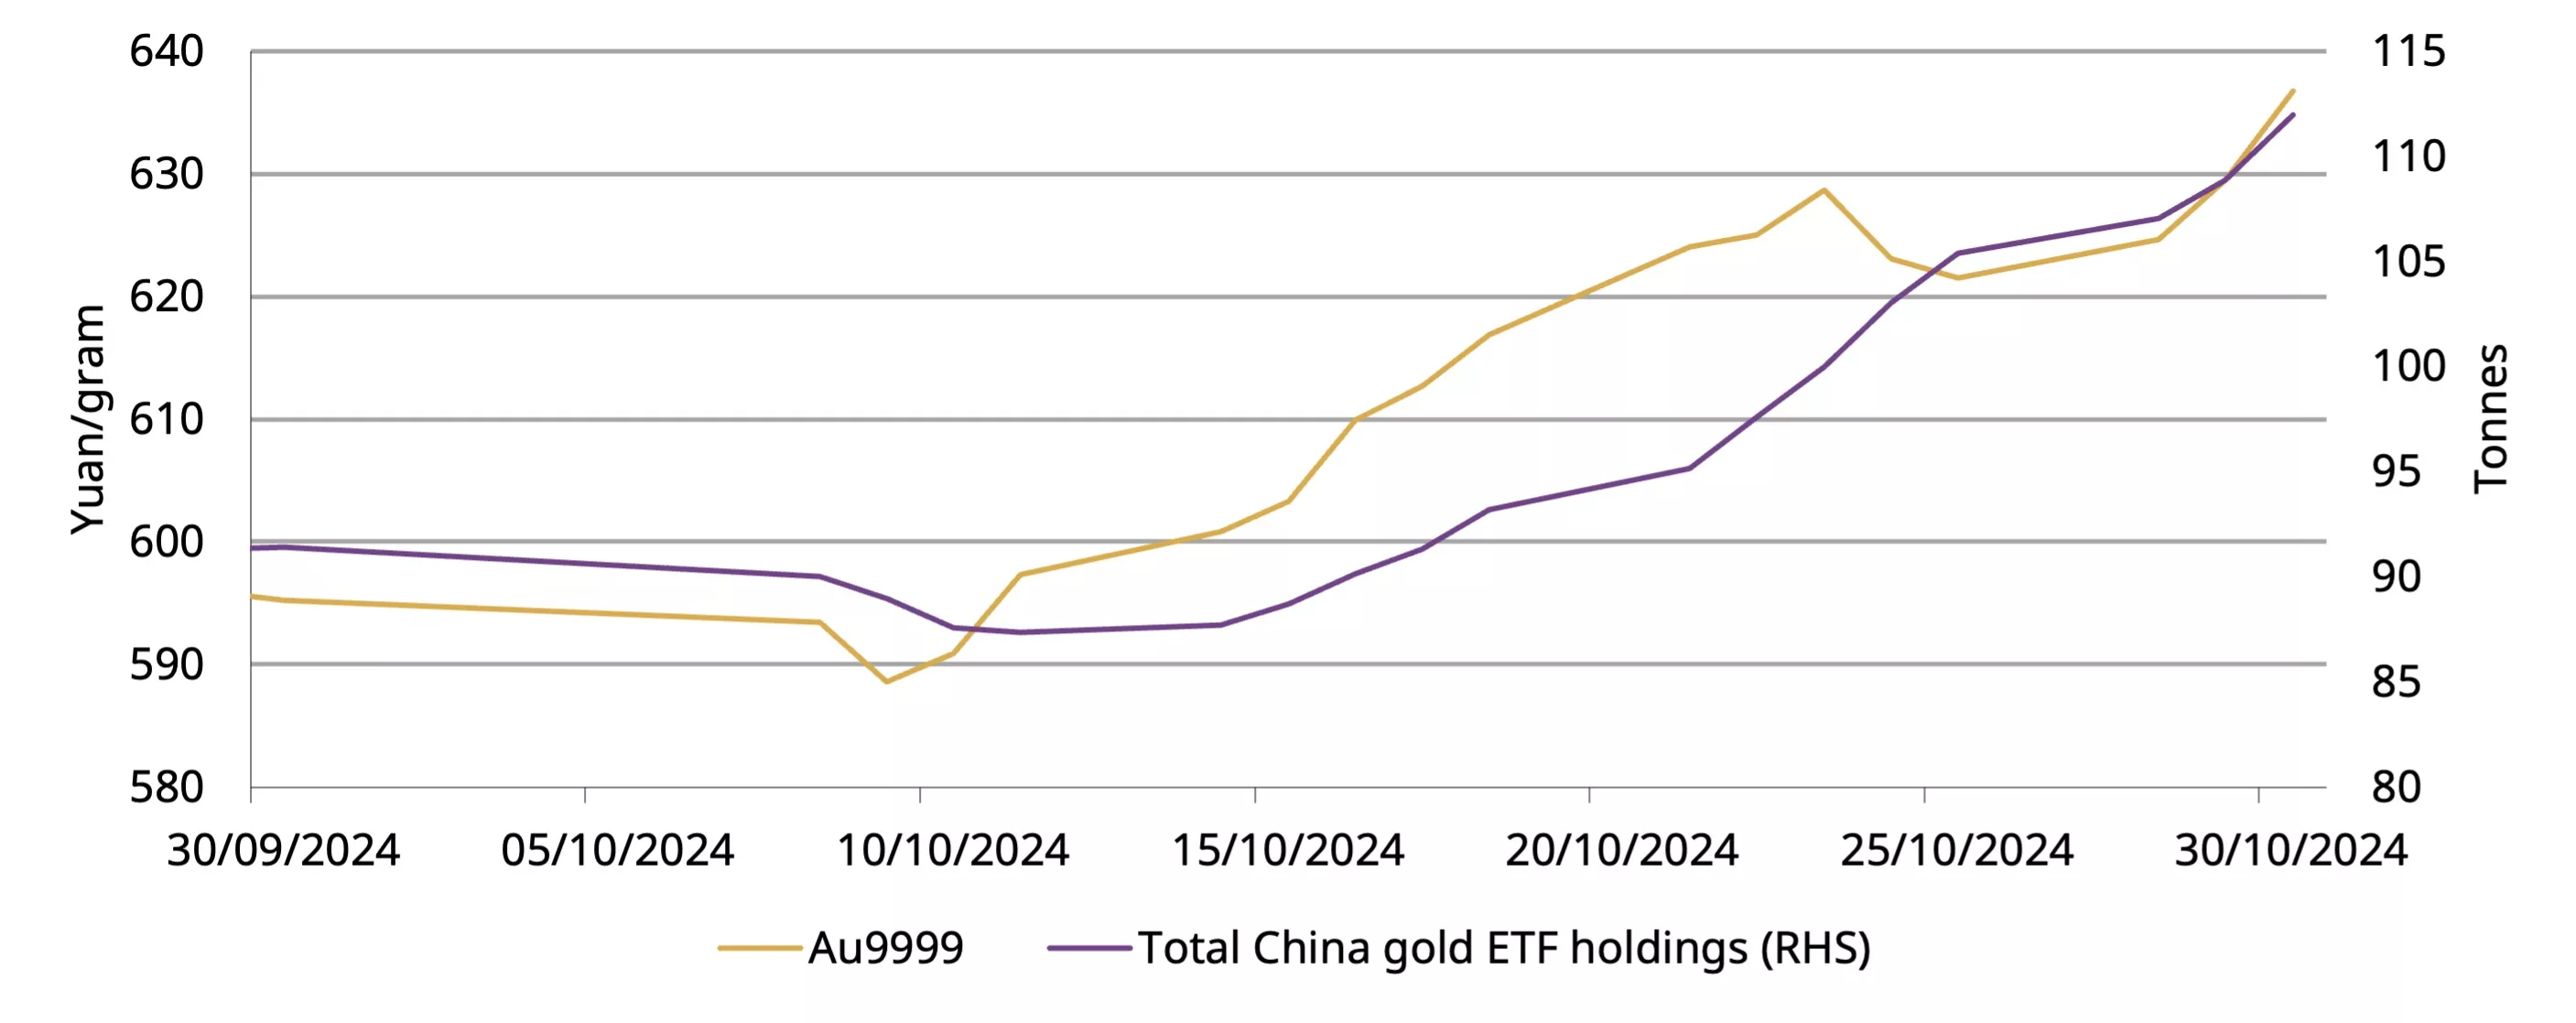
October was a tale of two halves (Chart 5). The first half witnessed outflows as investors turned to equities, which jumped on stimulus announcements before the Golden Week and attracted their attention. But the amplified stock market volatility and the surging local gold price fuelled sizable inflows into gold ETFs in the second half, significantly outpacing earlier losses.
Chart 5: The local gold price trend has been a key determinant of Chinese gold ETF demand in 2024
Daily Chinese gold ETF holdings and the local gold price
Source: ETF providers, Shanghai Gold Exchange, World Gold Council
The gold price strength also encouraged gold futures trading (Chart 6). Gold futures at the SHFE were traded 226t/day in October, 32% higher m/m and 39% above the five-year average.
Chart 6: SHFE gold futures trading activities rebounded notably
Monthly and five-year average trading volumes in the active gold futures contract*
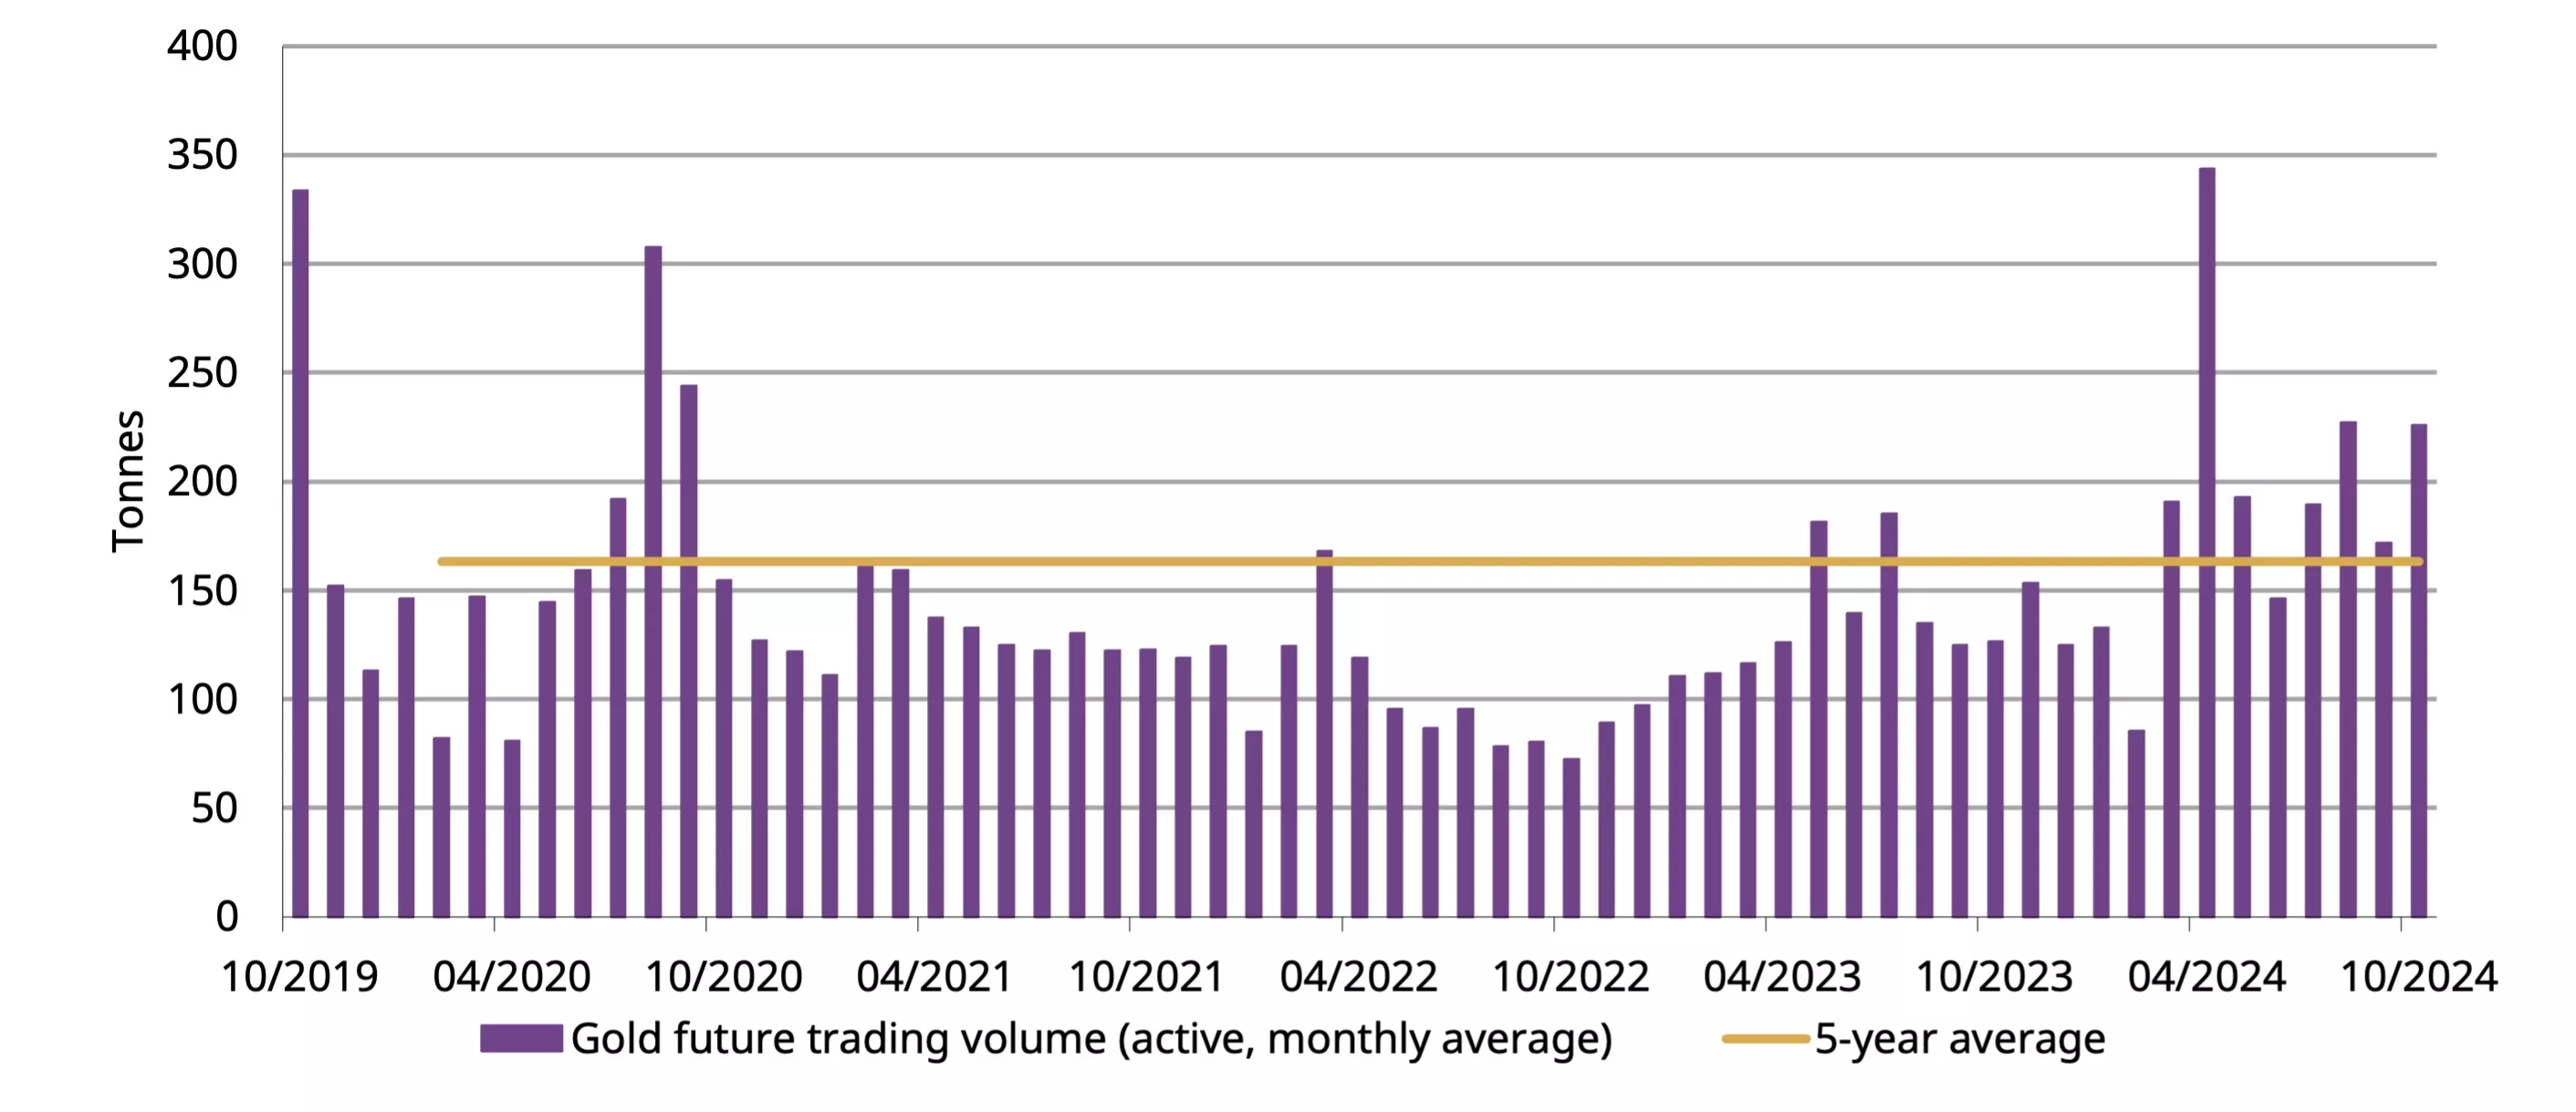
*Based on the average daily trading volumes (by month) of the active gold futures contract.
Source: Shanghai Futures Exchange, World Gold Council
Gold imports rebounded in September, according to the latest update from China Customs (Chart 7). Net gold imports totalled 57t in September, a significant rebound compared to August’s 10t yet remaining well below last September’s 118t. This mirrors trends in China’s wholesale gold demand: there was a 13% seasonal m/m bounce in gold withdrawals from the SGE during September yet the y/y weakness remains considerable. Meanwhile, we believe the prevailing local gold price discount – a result of weak demand – in the month limited gold imports.
Between January and September, net imports totalled 955t, a 14% fall y/y – weak gold jewellery demand constitutes a main factor driving down imports. For more details, please see our recently published Gold Demand Trends.
Chart 7: Gold imports bounced in September*
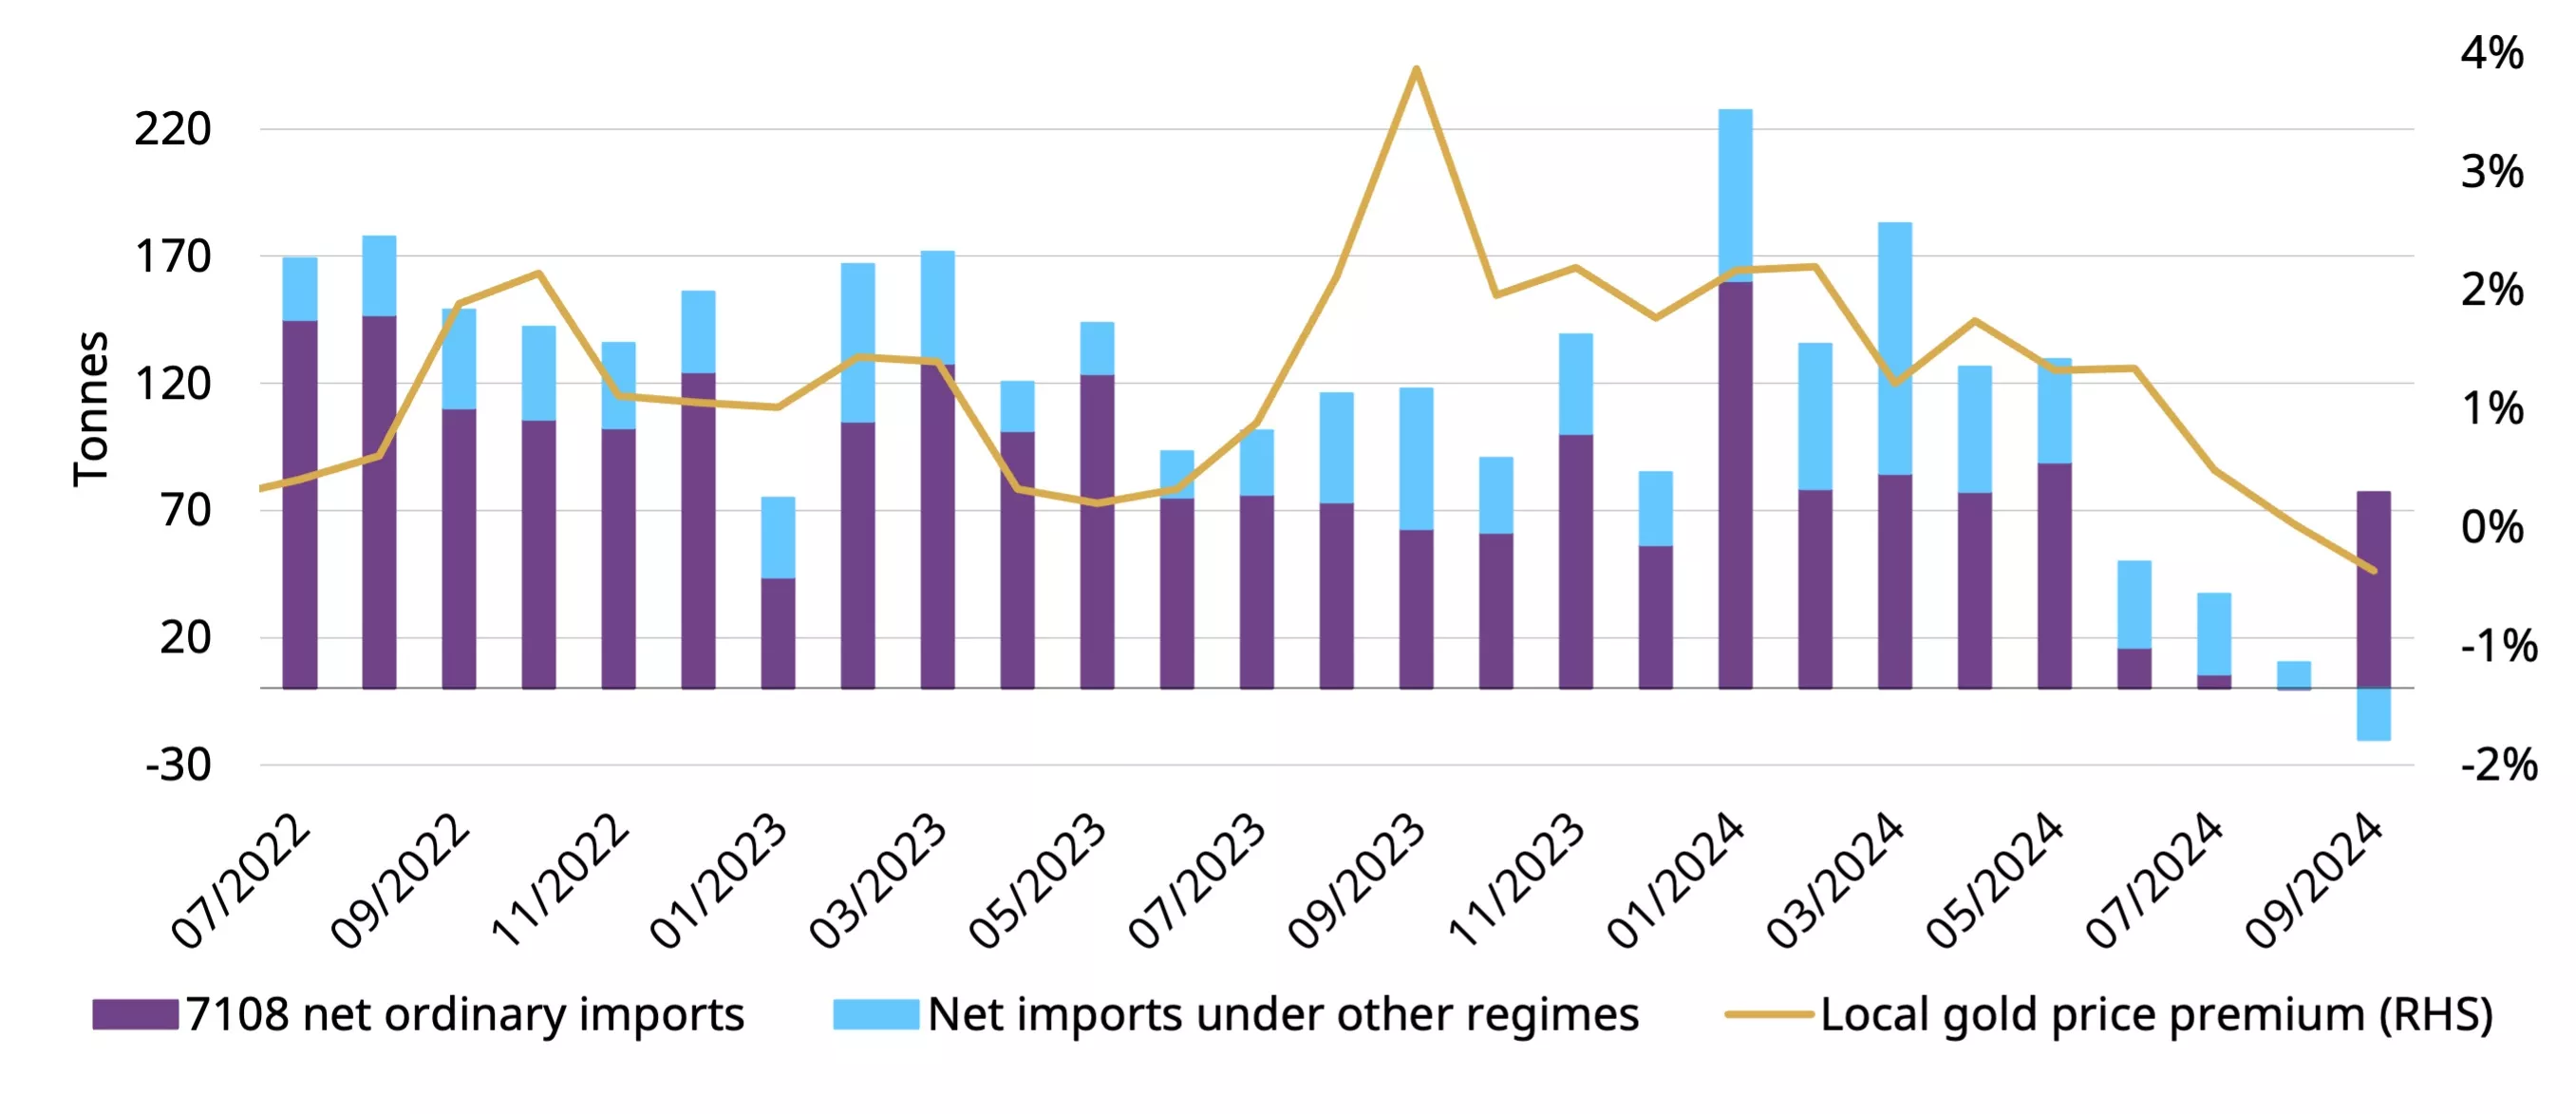
*Based on all imports under HS code 7108 reported by China Customs and excluding exports.
Source: China Customs, World Gold Council
China’s official gold holdings remained unchanged at 2,264t in October, for the seventh consecutive month. And similar to previous months, as the price continued to surge, gold’s share in total Chinese official foreign exchange reserves climbed to 5.7%. So far in 2024, China’s reported gold purchases total 29t, accumulated between January and April.
For more information on central bank gold purchases, please visit: Central Banks Gold Reserves by Country | World Gold Council.
Footnotes
1For more, see: New adjustment mechanisms to narrow mortgage interest rates - Chinadaily.com.cn and China's major lenders cut mortgage rates, bolstering confidence in recovering property sector.
2For more, see: China’s top 100 developers report better October home sales, other signals remain weak | South China Morning Post.
Buying gold online? Here's what to know
Joseph Cavatoni
Senior Market Strategist, North America World Gold CouncilWith our latest Gold Demand Trends report citing that total annual gold investment grew 25% in 2024, many investors are exploring what gold ownership entails and whether their investment should be actively or passively managed. At a high level, there are three key categories of products where US retail investors can own gold: physical (bars or coins), physically-backed gold ETFs, and gold futures (listed COMEX derivatives).
Our report also shows that many western investors continue to gravitate to the ETF market. Why? There are key benefits to this type of product: investors who buy shares in gold ETFs do not have to deal with the management or safekeeping of their holdings, and it’s as easy as investing in the stock market.
Many other investors choose to buy gold in the physical market and do so online. And while buying gold online has made it easier, it still requires due diligence. I spoke with the Royal Canadian Mint to identify the four key questions to consider when buying gold online:
- What are your investment goals?
- What exactly are you buying?
- Who are you buying from?
- What are the costs?
Factors including portfolio diversification, return on investment, risk level, collectability, functionality, and asset liquidity can make gold a compelling addition to a portfolio. To read the full blog post, please visit the Royal Canadian Mint’s website here. For more information on how to start investing in gold, you can also review our 5-step guide for investors on how to get started.
India gold market update: Record high prices, accompanied by investment interest
Kavita Chacko
Research Head, India World Gold CouncilHighlights
- Domestic prices track international highs, but demand pressure results in deeper discounts from local dealers
- Price surge dims jewellery demand, while investment interest lingers
- Gold ETFs see unprecedented inflows in January
- The Reserve Bank of India (RBI) resumed its gold buying in January, after a December pause, adding 2.8t to its reserves
- Gold imports hit their six-month low in January
- The Union Budget maintained the import duty on gold at 6%, while reducing the customs tariff on gold jewellery from 25% to 20%.
Looking ahead
- Gold investment interest is expected to remain strong, even as jewellery demand faces pressure from record-high prices. The financial year-end dynamics, which include statutory payments and tax-saving investments, may curtail discretionary spending, further weighing down demand. However, price stability could be a mitigating factor for jewellery demand, which could see an improvement in the new fiscal year starting in April.
Gold achieves a new peak
Heading into 2025, gold has not only reversed the price moderation seen in November-December (a decline of 6%), but it has also repeatedly hit new -record highs. So far in 2025,1 the LBMA gold price AM in USD has surged by US$286/oz or 10% to US$2,938/oz. Domestic prices have been rising in parallel with international prices, rising by 14% to a record INR86,831/10g,2 with the higher gains attributed to the weakness in the INR against the USD (1.1% depreciation y-t-d). Our analysis indicates that the upward climb in gold prices can be attributed to a combination of geopolitical risks, growing concerns about inflation, and increased investment flows.
Chart 1: Gold breaks previous records
LBMA Price AM and domestic landed price by month, US$ and INR*
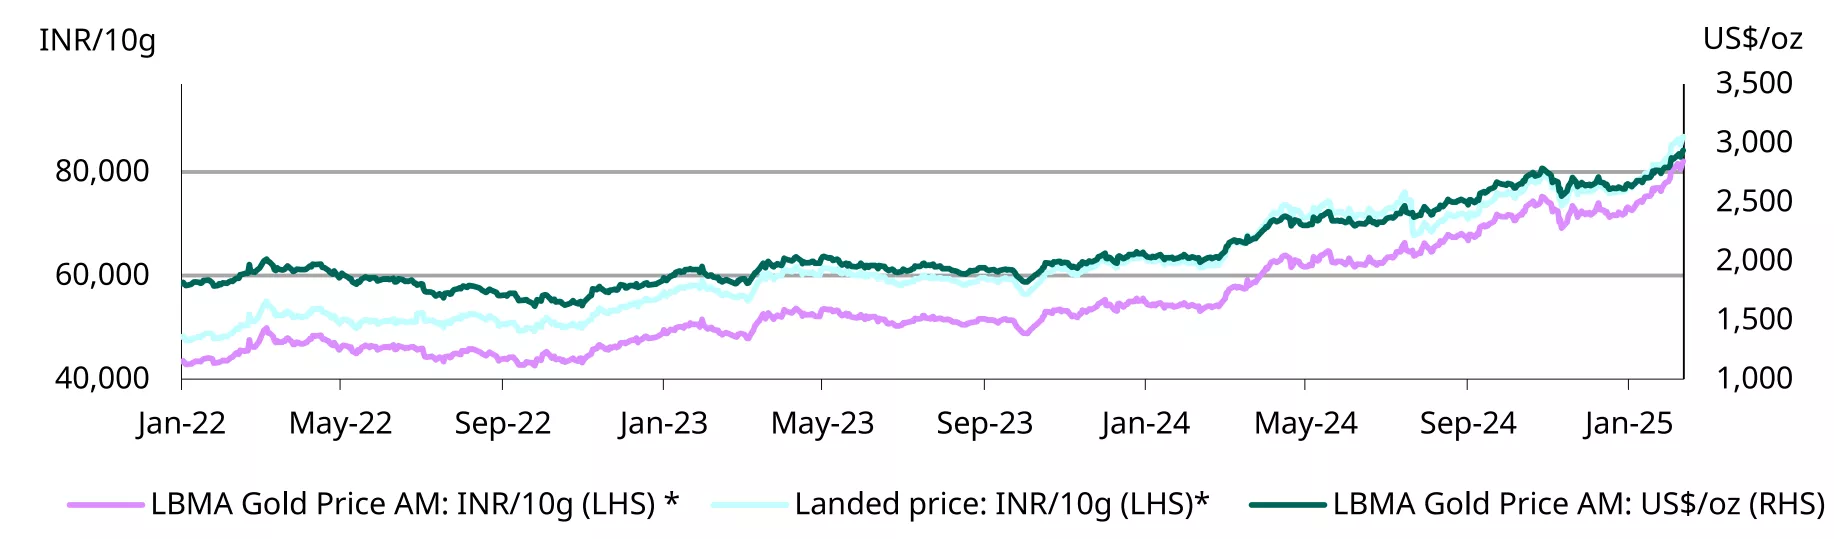
*Based on the LBMA Gold Price AM in USD expressed in local currency as of 14 February 2025. Landed price includes import tariff and tax.
Source: Bloomberg, World Gold Council.
Union Budget 2025-26: key highlights pertaining to gold
- One of the key takeaways from the Union budget presented on 1 February for gold is that the import duty hasn’t been changed. In the run-up to the budget there were worries that the government might hike the duty due to the rise in gold imports after it reduced the duty by 9% back in July 2024
- On the other hand, the government cut the customs tariff on gold jewellery from 25% to 20%. This is likely done as part of the overall rationalisation of tariffs across commodities. However, since jewellery imports aren’t that significant and are limited to high-end jewellery (and of low caratage), this cut in duty is unlikely to have much impact on domestic jewellery production
- It was also announced that new tariff lines will be introduced under the HSN codes3 for precious metal from 1 May to distinguish imports of precious metals in various forms. The new tariff lines will differentiate gold imports in bar form from other types. This is done to address the disruptions caused by imports of gold in forms such as platinum alloy and gold paste. From May, the tariff rates can differ based on the new classification
- The government has also decided not to issue any sovereign gold bonds as part of its market borrowing programme. This could work in favour of gold ETFs, as investors looking for gold-related financial products may turn to ETFs instead.
Price surge takes shine out of jewellery demand, maintains investment interest
The rally in gold prices to repeated new all-time highs since the start of the year has weighed heavily on the retail demand for gold jewellery. Uncertainty about announcements in the Union Budget also influenced buying activity.
Anecdotal reports indicate that demand dropped sharply in January and the weakness persisted into February, despite the end of the inauspicious period in the Hindu calendar (15 Dec - 15 Jan) and the usual-post Union Budget pick-up in demand. Wedding-related purchases too have been subdued, suggesting that many consumers had front loaded their purchases when prices dipped in November. Rather than making fresh purchases, many buyers are opting to exchange old gold for new jewellery. Additionally, as gold prices surged past previous thresholds, many consumers are also taking the opportunity to sell old gold and lock in profits.
This slowdown in jewellery demand has left retailers reluctant to restock, as they face challenges in meeting payment terms with manufacturers. This has created a liquidity crunch within the industry. The subdued demand environment was reflected in the widening spread between domestic and international prices. Since December, domestic gold prices3 have been trading at a discount to international prices, with the gap widening from an average US$3/oz in December to US$23/oz.4
Notwithstanding the depressed jewellery demand, investment demand interest (for bars and coins) has stayed the course with investors anticipating further price increases.
Record inflows into gold ETFs
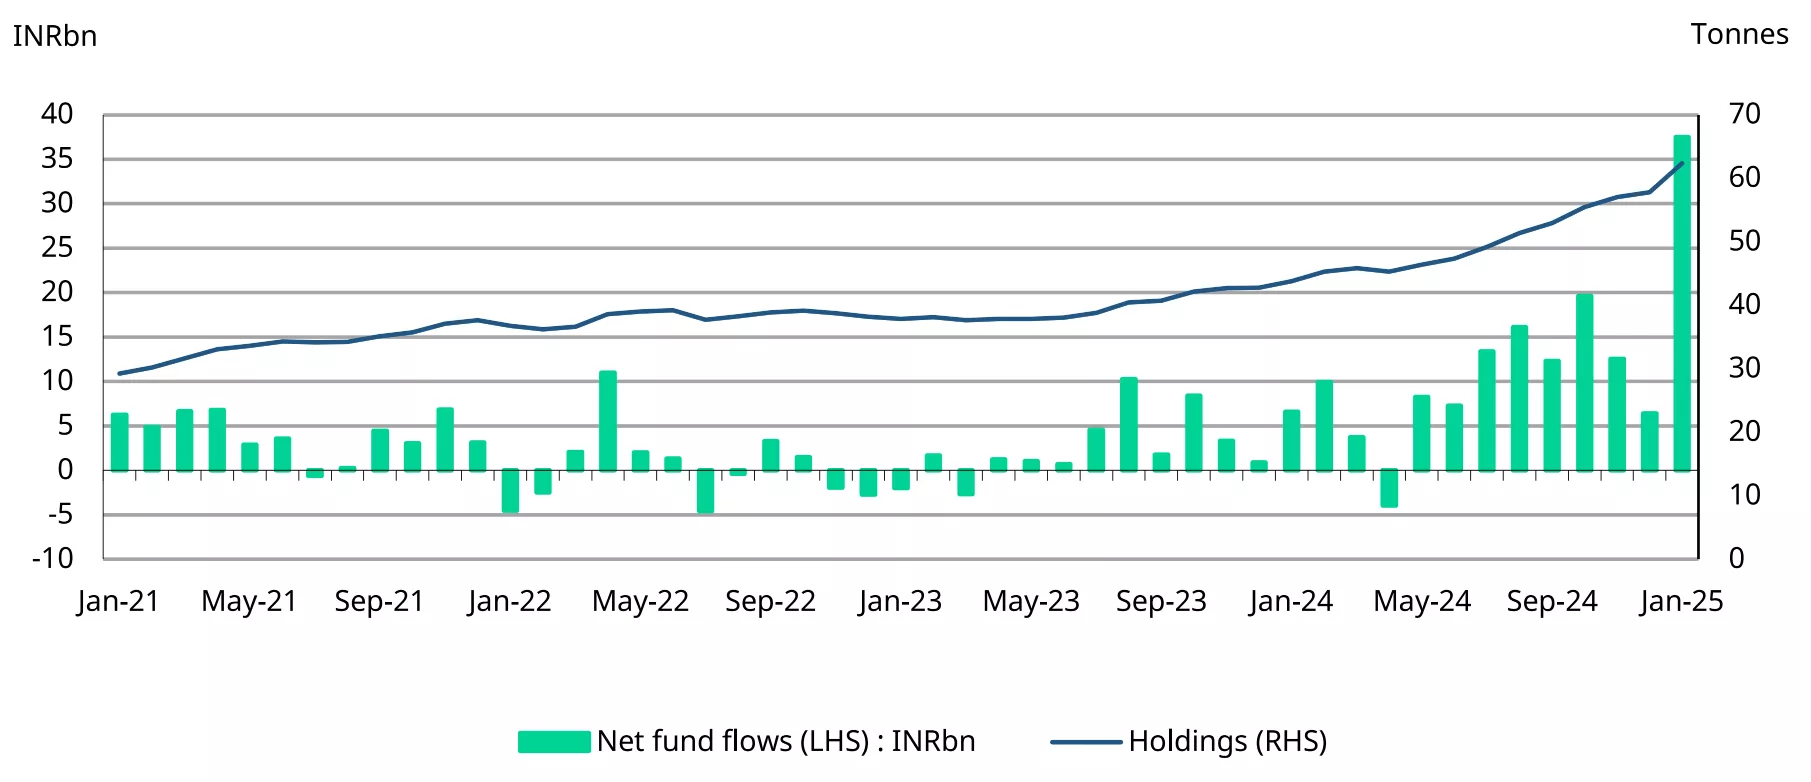
2025 began with strong interest in Indian gold ETFs, marked by unprecedented inflows in January. According to the Association of Mutual Funds in India (AMFI), gold ETFs recorded net inflows of INR37.5bn(~US$435mn) in January, significantly higher than the average inflows of INR9.4bn(~US$112mn) over the previous 12 months. The cumulative assets under management (AUM) of gold ETFs grew to INR51.8bn(~US$6bn), an 15% m/m increase and 4.6t were added to the overall holdings, taking the collective holdings to 62.4t. These figures are close to our initial estimates, which were based on information available at the time.5
Anecdotal reports suggest that the strong inflows in January can be attributed to investors redirecting free cash flow towards gold ETFs for diversification amid ongoing global and domestic economic and policy uncertainty. The sustained weakness in the domestic equity markets has also been driving flows into gold ETFs, with investors pulling back from equities in favour of the safe-haven appeal of gold.
In February, a new product was launched, bringing the total number of gold ETFs in India to 19,6 highlighting the strong momentum in this space.
Chart 2: Inflows soar
Monthly gold ETF fund flows in INRbn, and total holdings in tonnes*
*As of end January 2025.
Source: AMFI, ICRA Analytics, CMIE, World Gold Council
Gold buying resumes at the RBI after a brief pause
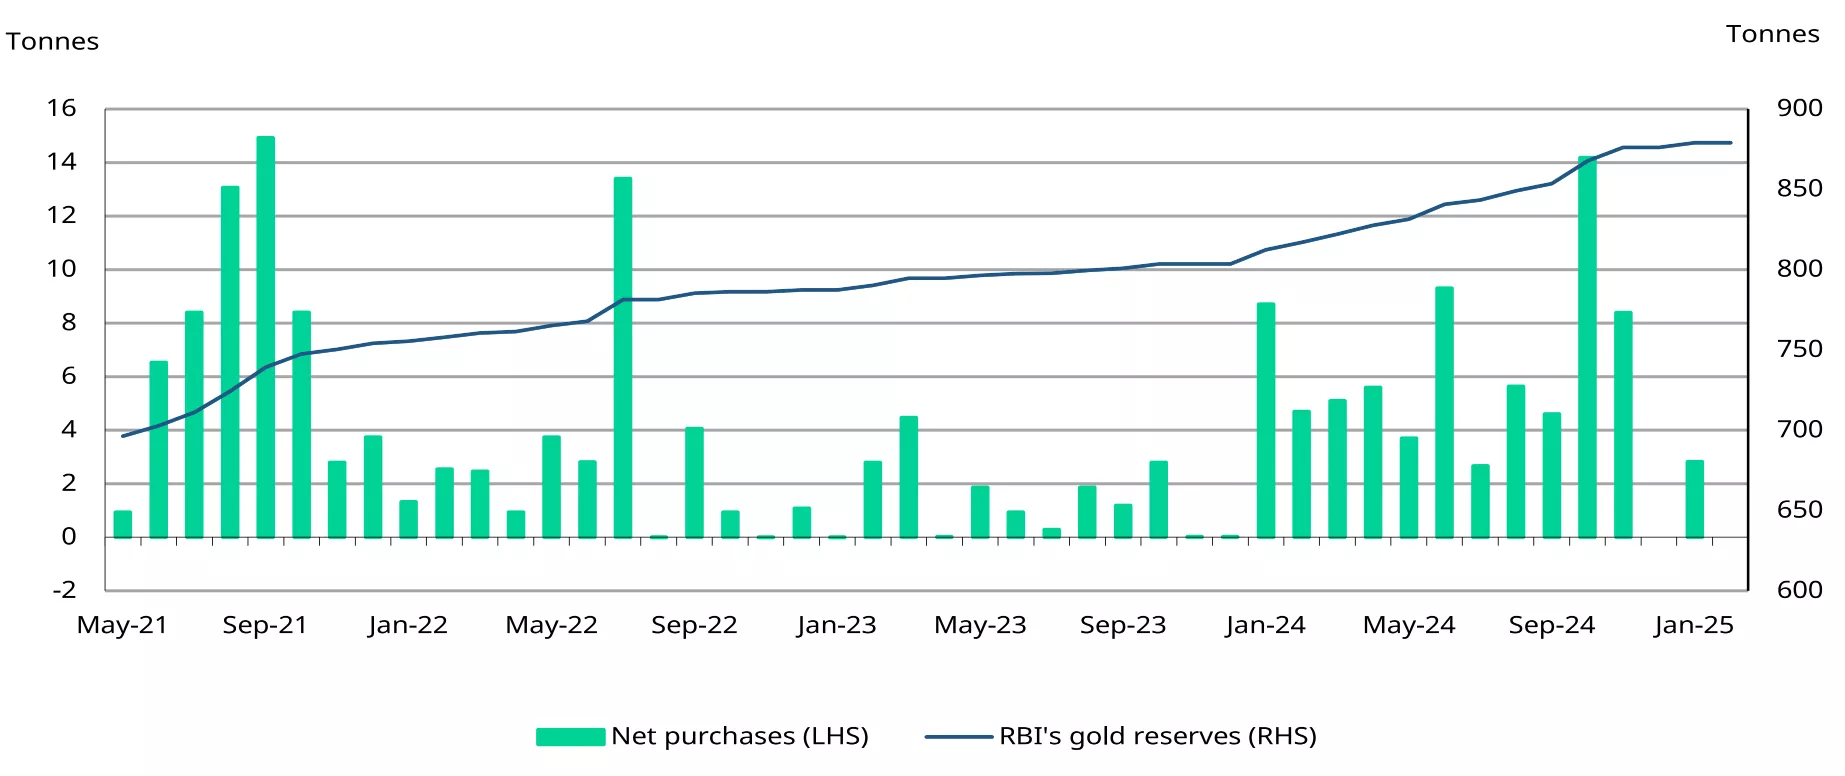
The RBI resumed its gold purchases in January, after pausing in December following 11 consecutive months of buying. The central bank added 2.8t of gold to its gold holding during the month, taking its total gold reserves to a new high of 879t. This renewed buying suggests that the RBI is likely to continue with its gold accumulation, following a significant purchase of 72.6t in 2024, making it the third largest buyer of gold among global central banks that year.
Not only is the RBI building its gold reserves, the share of gold in its forex reserves has been steadily climbing from 7.7% in January 2024 to 11.31% by early February 2025.7 This increase reflects the RBI’s efforts to diversify its forex reserves, alongside a decline in its holding of foreign currency assets (from 88.5% to 85.2%).
Chart 3: RBI’s gold holdings rise
RBI’s net purchases and reserves, in tonnes*
*Data as of 7 February 2025.
Source: RBI, World Gold Council
Gold imports slow in January
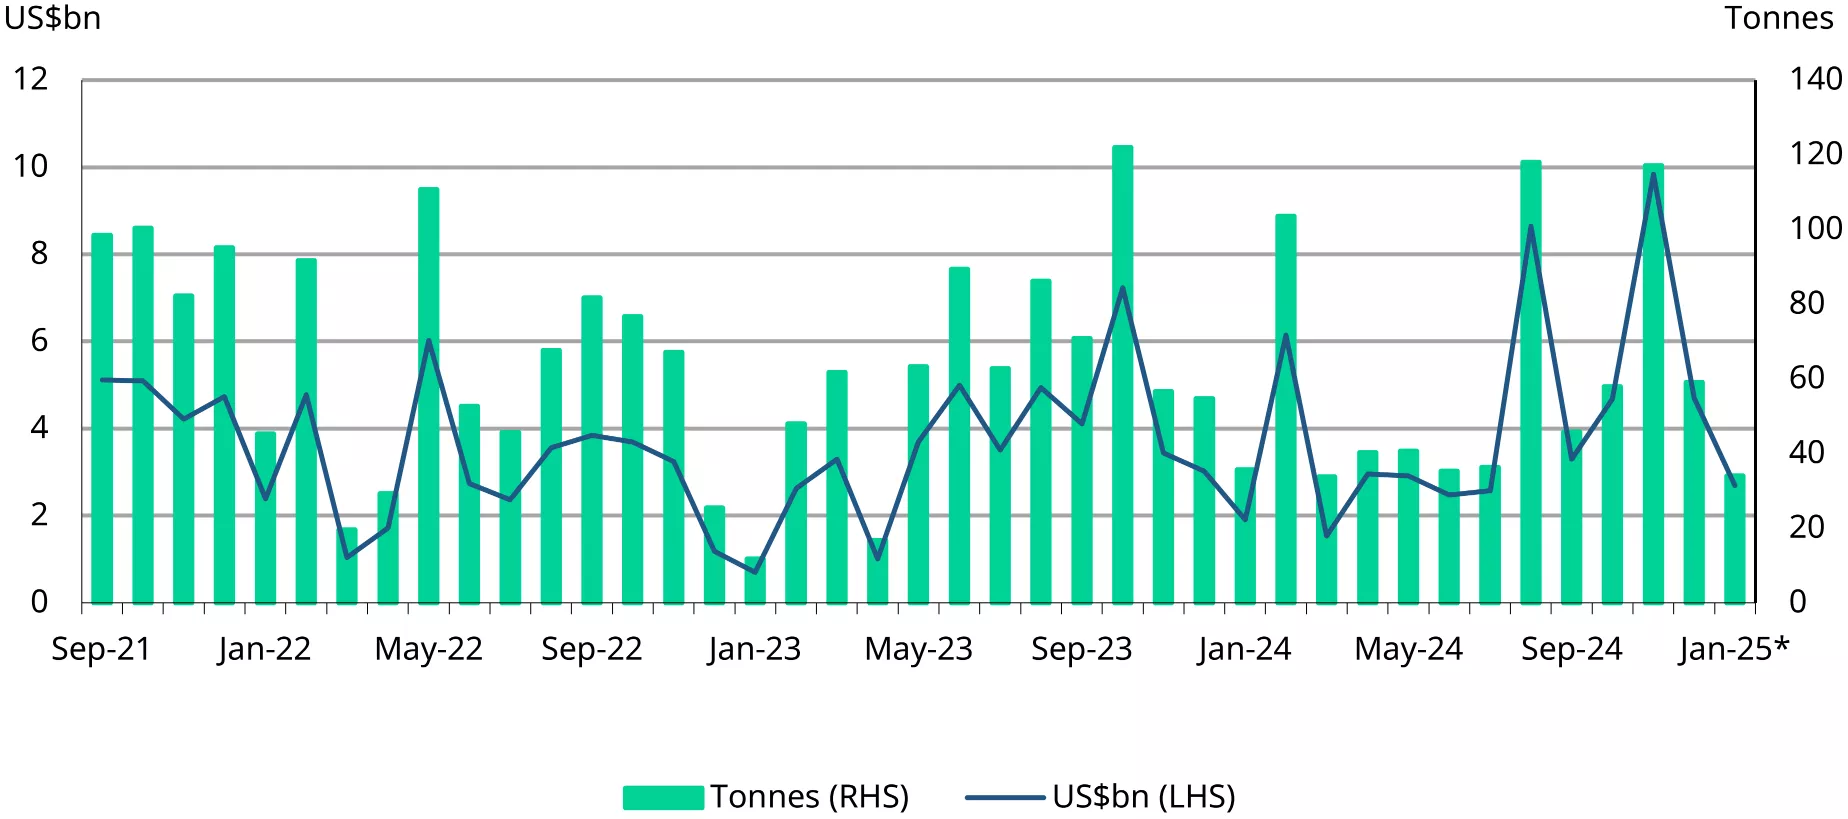
Gold imports in January saw a noteworthy drop owing to high prices leading the pull-back in demand. Anecdotal market reports suggest that manufacturers did not pick-up imports, reflecting the depressed demand environment. January's imports were the lowest since July 2024. According to Ministry of Commerce data, the gold import bill for the month totalled $2.68bn, a 43% decrease compared to December. However, it was approximately 40% higher than January of the previous year. We estimate that the volume of imports in January ranged between 30t-35t.
Chart 4: Gold imports cool from peak
Monthly gold imports in tonnes and US$bn*
*Includes World Gold Council estimates.
Source: Ministry of Commerce and Industry, CMIE, World Gold Council
Footnotes
1As of 14 February, 2025.
2Based on the landed price of gold (international prices adjusted for import taxes and exchange rate) as of 14 February, 2025.
3HSN (Harmonized System of Nomenclature) code is a system used to classify goods in international trade and is accepted globally.
4Domestic gold prices refer to the landed prices, which are the international prices adjusted for import taxes and exchange rate.
5 As of 14 February, 2025.
6The daily AUM and NAV data published by AMFI covers 15 of the country’s 18 gold ETFs.
7As of 14 February, 2025.
8As of 7 February, 2025.
Disclaimer
Important information and disclaimers
© 2025 World Gold Council. All rights reserved. World Gold Council and the Circle device are trademarks of the World Gold Council or its affiliates.
All references to LBMA Gold Price are used with the permission of ICE Benchmark Administration Limited and have been provided for informational purposes only. ICE Benchmark Administration Limited accepts no liability or responsibility for the accuracy of the prices or the underlying product to which the prices may be referenced. Other content is the intellectual property of the respective third party and all rights are reserved to them.
Reproduction or redistribution of any of this information is expressly prohibited without the prior written consent of World Gold Council or the appropriate copyright owners, except as specifically provided below. Information and statistics are copyright © and/or other intellectual property of the World Gold Council or its affiliates or third-party providers identified herein. All rights of the respective owners are reserved.
The use of the statistics in this information is permitted for the purposes of review and commentary (including media commentary) in line with fair industry practice, subject to the following two pre-conditions: (i) only limited extracts of data or analysis be used; and (ii) any and all use of these statistics is accompanied by a citation to World Gold Council and, where appropriate, to Metals Focus or other identified copyright owners as their source. World Gold Council is affiliated with Metals Focus.
The World Gold Council and its affiliates do not guarantee the accuracy or completeness of any information nor accept responsibility for any losses or damages arising directly or indirectly from the use of this information.
This information is for educational purposes only and by receiving this information, you agree with its intended purpose. Nothing contained herein is intended to constitute a recommendation, investment advice, or offer for the purchase or sale of gold, any gold-related products or services or any other products, services, securities or financial instruments (collectively, “Services”). This information does not take into account any investment objectives, financial situation or particular needs of any particular person.
Diversification does not guarantee any investment returns and does not eliminate the risk of loss. Past performance is not necessarily indicative of future results. The resulting performance of any investment outcomes that can be generated through allocation to gold are hypothetical in nature, may not reflect actual investment results and are not guarantees of future results. The World Gold Council and its affiliates do not guarantee or warranty any calculations and models used in any hypothetical portfolios or any outcomes resulting from any such use. Investors should discuss their individual circumstances with their appropriate investment professionals before making any decision regarding any Services or investments.
This information may contain forward-looking statements, such as statements which use the words “believes”, “expects”, “may”, or “suggests”, or similar terminology, which are based on current expectations and are subject to change. Forward-looking statements involve a number of risks and uncertainties. There can be no assurance that any forward-looking statements will be achieved. World Gold Council and its affiliates assume no responsibility for updating any forward-looking statements.
Information regarding QaurumSM and the Gold Valuation Framework
Note that the resulting performance of various investment outcomes that can be generated through use of Qaurum, the Gold Valuation Framework and other information are hypothetical in nature, may not reflect actual investment results and are not guarantees of future results. Neither World Gold Council (including its affiliates) nor Oxford Economics provides any warranty or guarantee regarding the functionality of the tool, including without limitation any projections, estimates or calculations.
Information obtained from ICRA Analytics Limited
All information obtained from ICRA Analytics Limited in this document has been obtained by ICRA Analytics Limited from sources believed by it to be accurate and reliable. Although reasonable care has been taken to ensure that the information herein is true, such information is provided ‘as is’ without any warranty of any kind, and ICRA Analytics Limited in particular, make no representation or warranty, express or implied, as to the accuracy, timeliness or completeness of any such information. All information obtained from ICRA Analytics Limited contained herein must be construed solely as statements of opinion, and ICRA Analytics Limited shall not be liable for any losses incurred by users from any use of this document or its contents in any manner. Opinions expressed in this document are not the opinions of ICRA Analytics Limited’s holding company, ICRA Limited (ICRA), and should not be construed as any indication of credit rating or grading of ICRA for any instruments that have been issued or are to be issued by any entity.
