China's gold market update: Central bank purchases continue in January
Ray Jia
Head of Research (Asia Pacific, ex-India) and Deputy Head of Trade Engagement (China) World Gold CouncilHighlights
- Gold began 2025 with vigour: the LBMA Gold Price PM and the Shanghai Gold Benchmark Price PM both saw their strongest January in years, rising by 8% and 5% respectively.
- The Shanghai–London gold price spread rose again in January as local wholesale gold demand continues its seasonal improvement: gold withdrawals from the Shanghai Gold Exchange (SGE) increased by 3% m/m to 125t. Yet, total withdrawals remain well below levels seen in past years, highlighting the soaring gold price’s negative impact on gold jewellery’s tonnage demand.
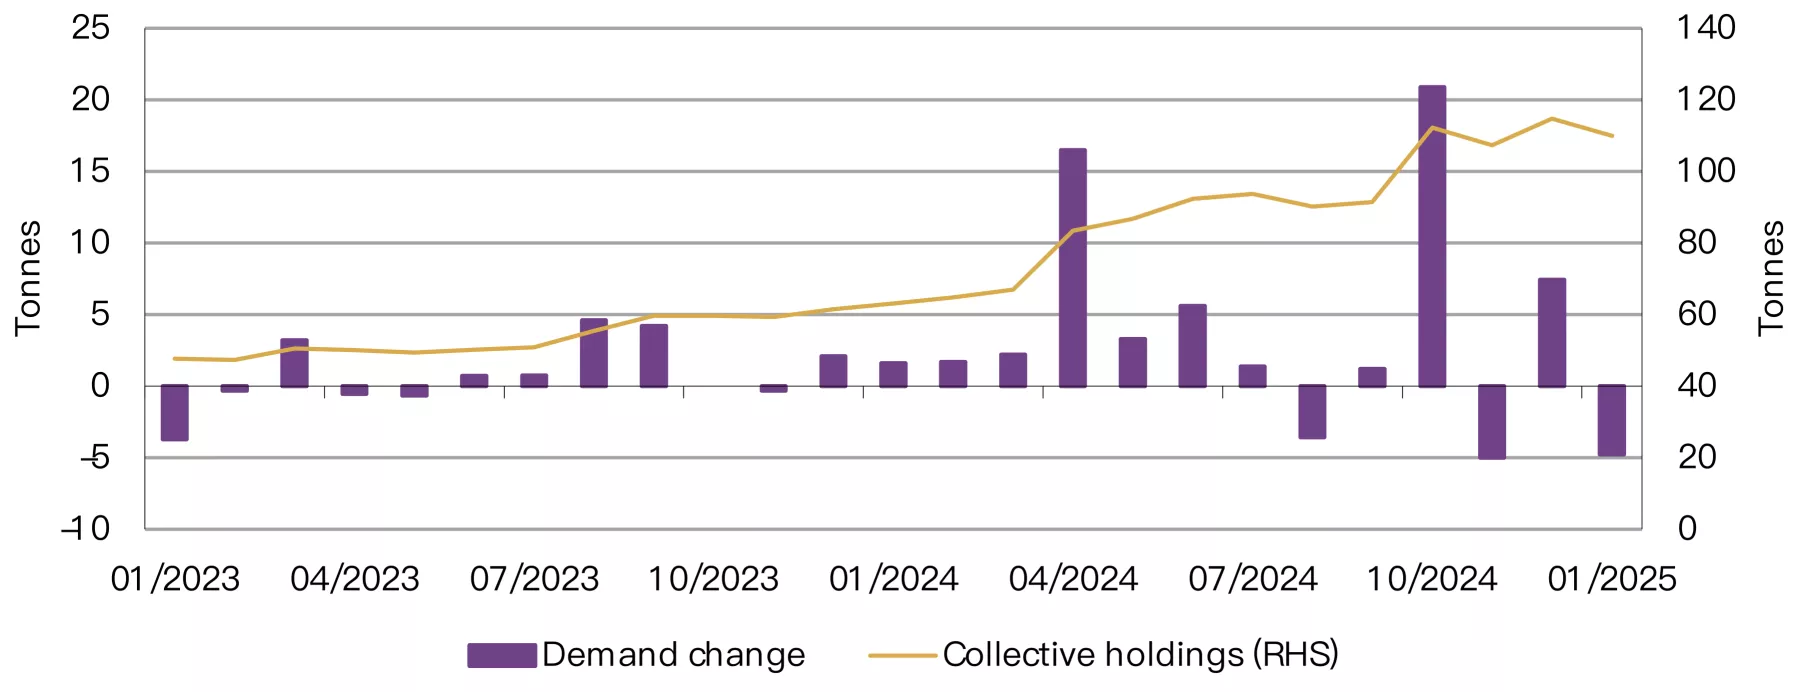
- Chinese gold ETF flows in January flipped negative, shedding RMB2.8bn (US$399mn) and decreasing the total assets under management (AUM) to RMB70bn (US$9.8bn) – but remaining near the record level. Meanwhile, holdings fell 4.7t to 110t.
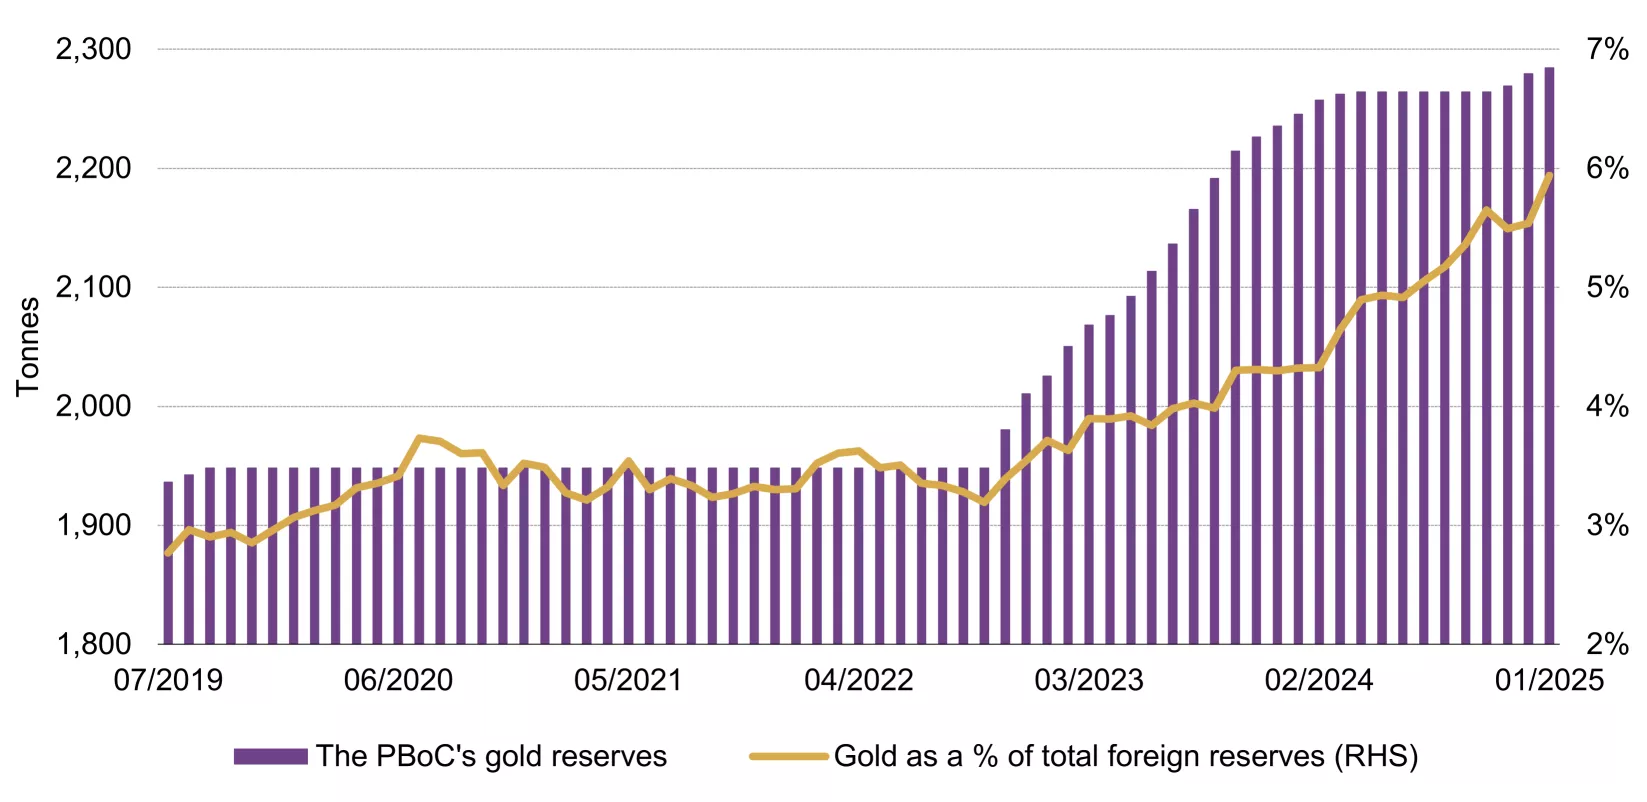
- The People’s Bank of China (PBoC) reported a further 5t addition to its gold reserves in January; following three consecutive monthly increases, its official gold holdings now stand at 2,285t, 5.9% of total reserves.
Looking ahead
- We anticipate continued strength in bar and coin demand while the soaring gold price may weigh on gold jewellery sales in tonnage terms – although consumer spending may not change much. And in the longer-term, a pilot programme that allows Chinese insurers to buy physical gold should provide additional support for investment demand.
- And judging from the surging attention consumers are paying to gold, there is a possibility that wholesale demand in the near term – driven mainly by investment purchases – may stay stable before it cools as Q2, historically an off-season of gold consumption in China, approaches.
Gold kicked off 2025 with a sizable gain
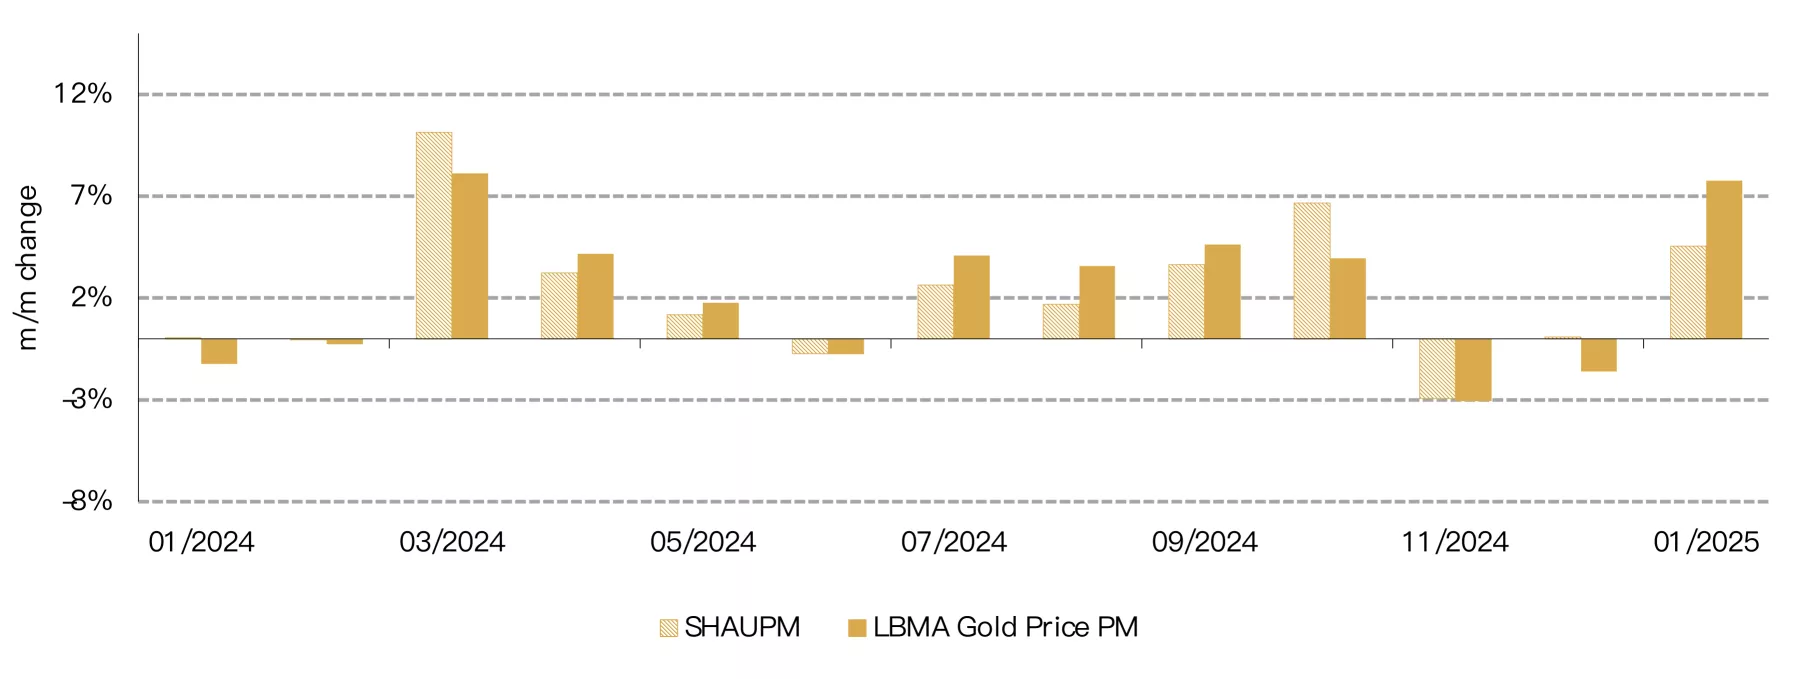
Gold prices surged during the first month of 2025: the LBMA gold price PM in USD jumped 8% while the SHAUPM in RMB rose 5% (Chart 1). A strengthening local currency and fewer trading days due to the Chinese New Year (CNY) holiday between 28 January and 4 February led to the relative underperformance of the RMB gold price.
Our analysis shows that heightened geopolitical risks – such as the Trump administration’s tariff policies – improving gold ETF inflows and rekindling inflation concerns were main contributors to the record-shattering gold price in January.
Chart 1: Gold starts 2025 on a strong note
Annual returns of the SHAUPM in RMB and the LBMA Gold Price PM in USD*
*As of 31 January 2025.
Source: Bloomberg, World Gold Council
Wholesale demand improved m/m but stayed weak y/y
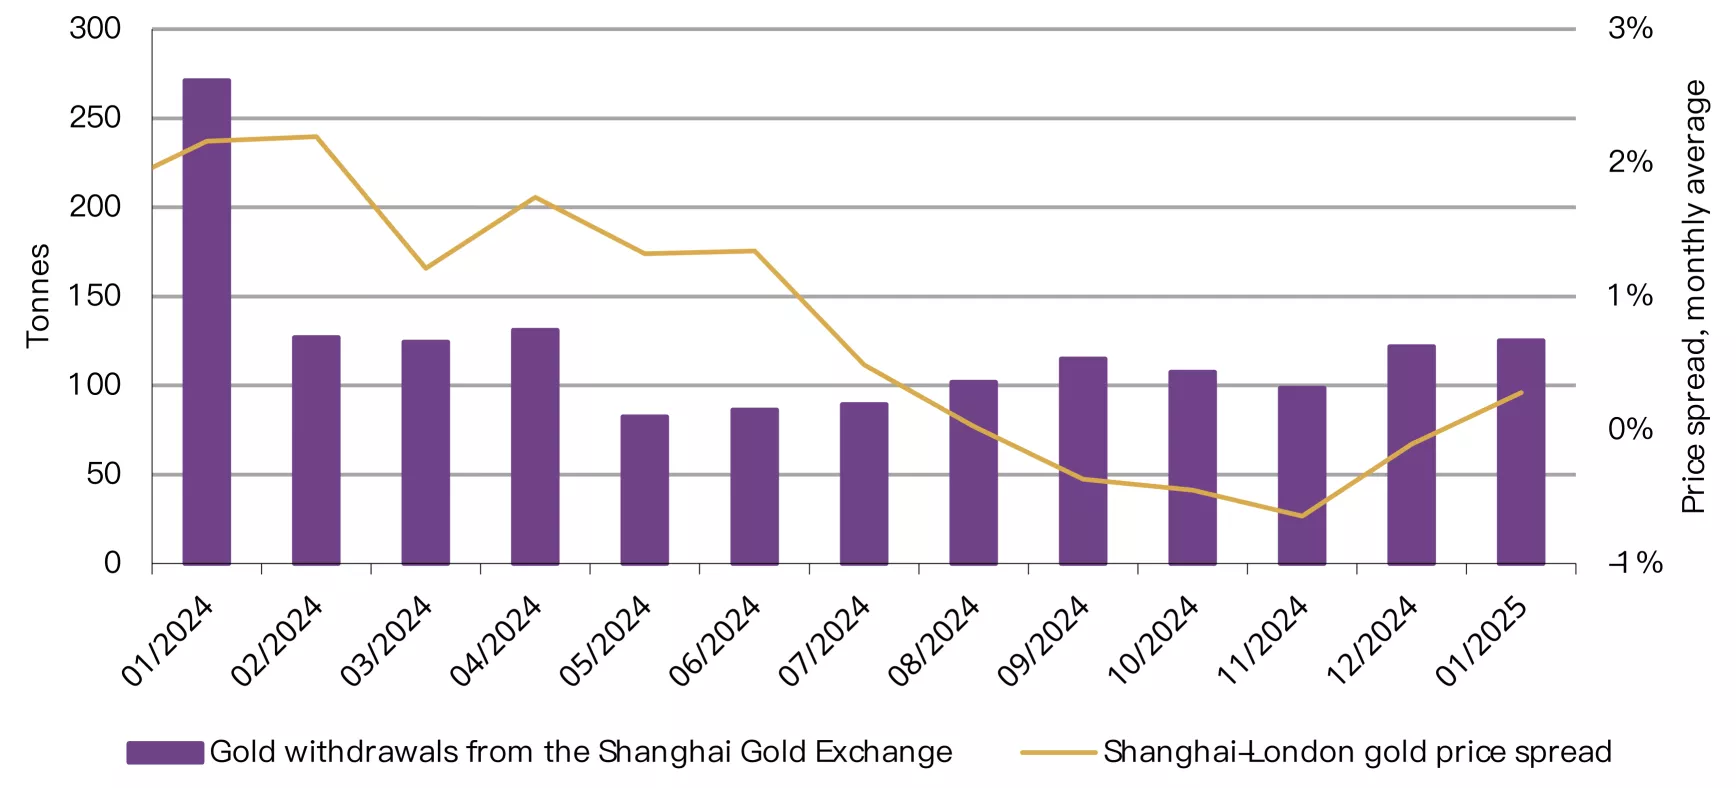
China’s gold demand improved during the CNY month. On the wholesale side, 125t of gold were shipped out from the SGE, a 3% m/m rise (Chart 2). Seasonal stock replenishment from jewellery retailers, banks and other market participants ahead of the CNY holiday – a traditional peak season for gold consumption in China – was a main contributor.
Chart 2: Seasonal replenishment drives up wholesale demand m/m
Gold withdrawals from the SGE and the Shanghai-London gold price spread*
Source: Shanghai Gold Exchange, World Gold Council
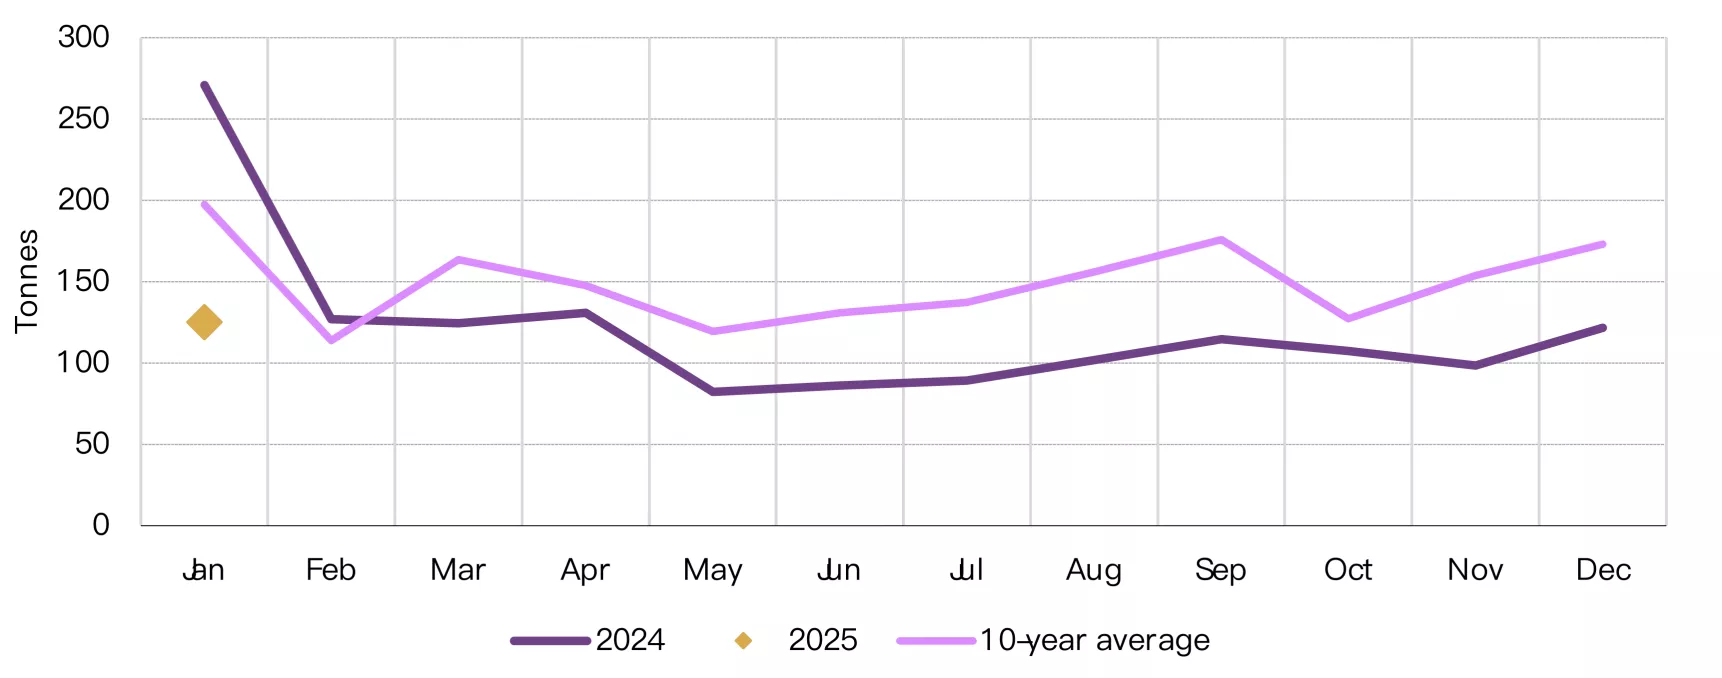
But our pre-holiday field research in Shenzhen, the hub of China’s gold jewellery wholesaling and manufacturing, indicates weaker-than-usual sentiment among gold jewellery retailers. With the gold price soaring and the past year’s demand picture reminding them of potential sustained weaknesses, gold jewellery retailers lowered their expectations for the holiday sales and stocked up less than previous years. And this is also reflected in the 54% y/y decline in January’s wholesale gold demand – but it is important to note that 2024 saw the strongest January in history – and it was 37% below the ten-year average (Chart 3).
Chart 3: Yet the seasonal m/m improvement can’t mask the y/y weakness
Gold withdrawals from the SGE and the 10-year average*
*The 10-year average is based on data between 2014 and 2023.
Source: Shanghai Gold Exchange, World Gold Council
Chinese gold ETF flows flipped negative in January
Chinese gold ETFs lost RMB2.8bn (US$399mn) in January, equivalent to a 4.7t reduction in holdings (Chart 4). After the month’s outflow, their total AUM fell to RMB70bn (US$9.8bn) and collective holdings reached 110t. We believe the outflow can be mainly attributed to profit-taking activities ahead of the CNY holiday to avoid additional volatilities from international markets while the local market is closed.1 Meanwhile, improving investor risk appetite amid the stronger-than-expected Q4 and 2024 GDP data releases in the month may also have led to outflows from gold, the safe-haven asset.2
Chart 4: Chinese gold ETFs saw outflows in January
Collective holdings and monthly changes of Chinese gold ETFs*
*As of 31 January 2025.
Source: Company filings, World Gold Council
China’s official gold holdings rose three months in a row
The PBoC announced another gold purchase to start 2025: the 5t increase lifted China’s official gold holdings to 2,285t, accounting for 5.9% of total foreign reserves (Chart 5). As noted in our recently published Gold Demand Trends report, China announced a total of 44t gold purchases during 2024 despite its six-month pause in the middle of the year. And we believe the PBoC’s move could have a positive impact on sentiment among local gold investors, as indicated by past anecdotal evidence.
Chart 5: The PBoC reported its third consecutive monthly gold purchase in January
Reported official gold holdings and gold as a percentage of total foreign exchange reserves*
*As of 31 January 2025.
Source: State Administration of Foreign Exchange, World Gold Council
Gold imports ended 2024 with a y/y decline
December saw China import 84t of gold, concluding Q4 with a total of 270t, based on the most recent data from China Customs. While Q4 imports fell 14% y/y, they rose more than 160% q/q – the y/y weakness and q/q seasonal strength are in line with our observation of China’s gold demand during the quarter.
In 2024, China imported 1,225t of gold (Chart 6), a 14% y/y decline and 16% below the pre-COVID five-year average (1,460t). And we saw similar trends in China’s gold consumption in 2024, which fell 10% compared to 2023, leading to the decrease in imports.
Chart 6: Gold imports remain below pre-COVID levels
Gold imports and averages pre-COVID*
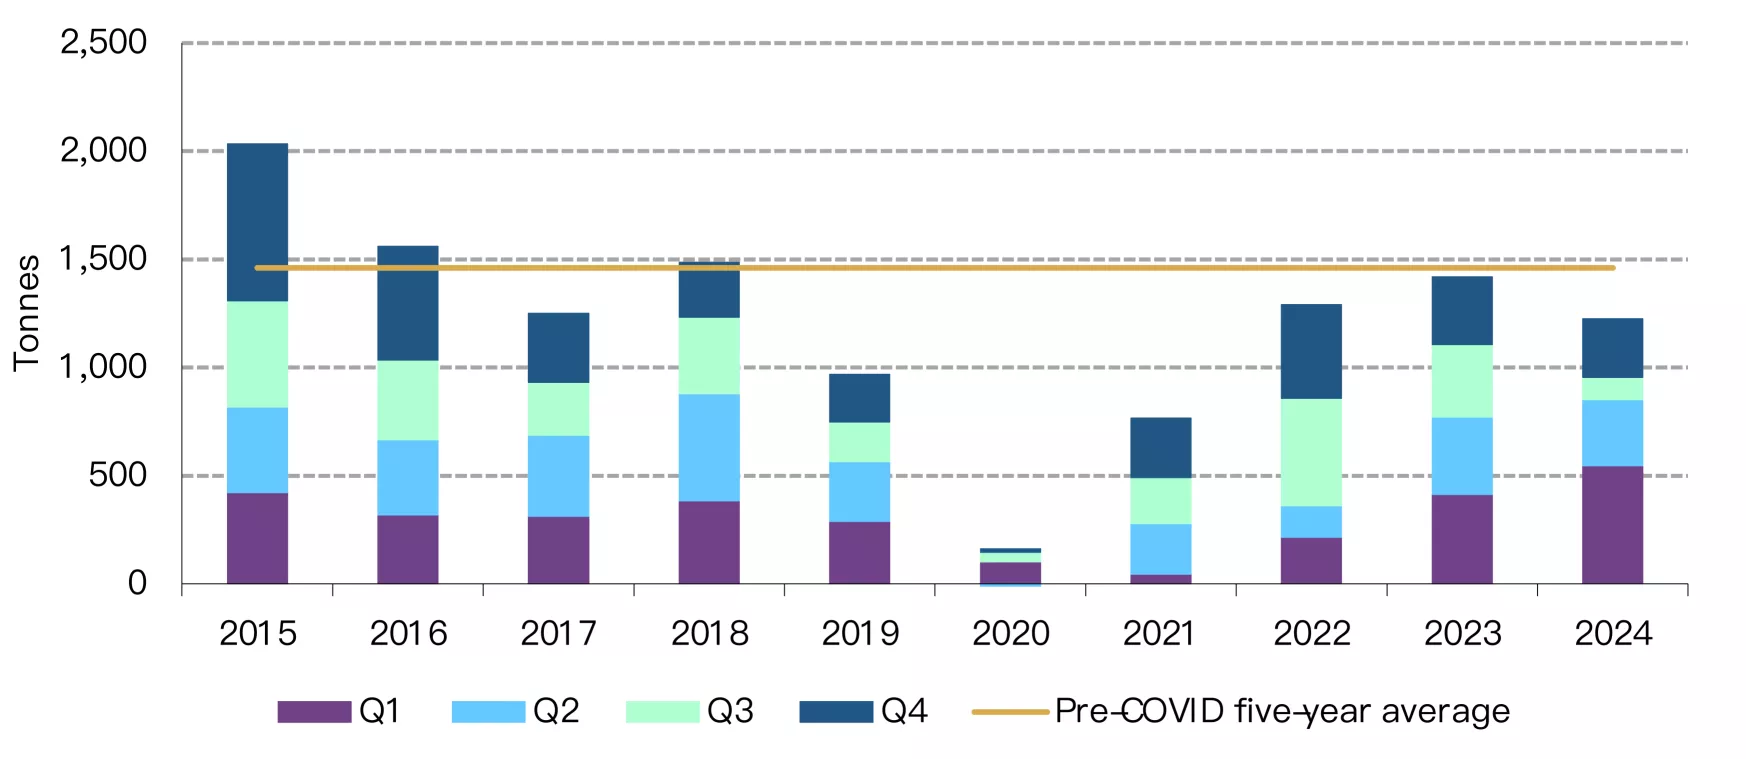
*As of 31 December 2024. Pre-COVID average based on imports between 2015 and 2019.
Source: China Customs, World Gold Council
Looking ahead
The CNY holiday between late January and early February showed signs of consumption revival. For instance, box office revenues during the holiday surged to a historical high and consumer spending on dining and travelling both rose compared to the same period in 2024.3
Gold consumption was also booming. Various information indicates that gold jewellery stores were busy during the holiday. Meanwhile, the climbing gold price continued to push consumers to lighter products.4
And the investment story is a much stronger one. The strong gold price performance, the central bank’s continued purchasing announcements and the local currency volatilities kept lifting investor attention for gold. Currently, the online searches for gold topped their previous peak seen in 2013 (Chart 7), when gold demand in China surged to the highest in history. Our conversations with market participants indicate that gold bar sales maintained their stunning pace seen in 2024, even leading to inventory shortages for some.
Chart 7: Consumer sentiment towards gold reached a record high
Baidu Search Index of the keyword “Gold”*
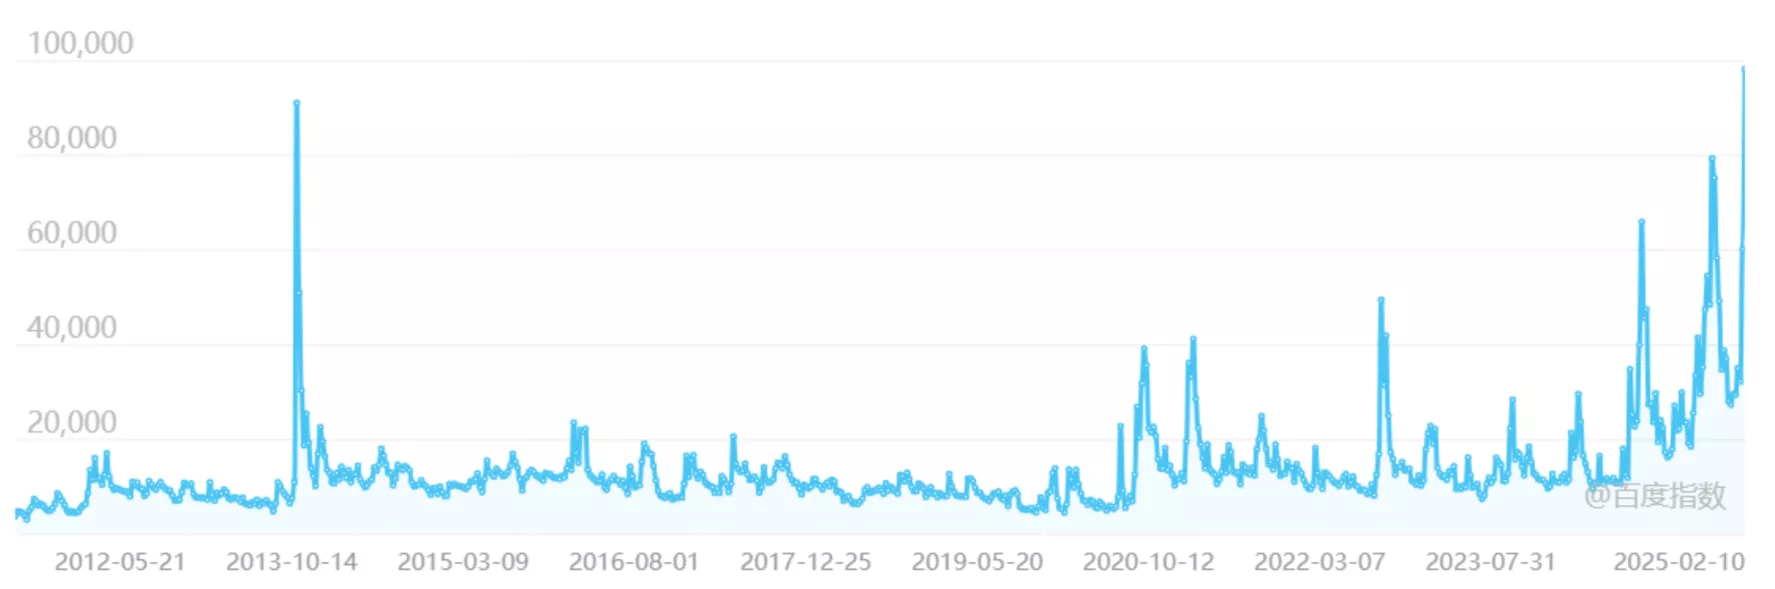
*As of 11 February 2025, sourced from 百度指数.
Source: Baidu Index, World Gold Council
We believe the current trend may continue. In tonnage terms, demand for gold jewellery may stay tepid – although value-preserving motives will provide some support – but bar and coin sales should remain hot – and any gold price adjustment could be viewed as a good opportunity to enter. Lastly, we believe a recent announcement of policy changes that allows ten Chinese insurers to buy up to 1% of each company’s total assets in physical gold, as a pilot run, should provide longer-term support for local investment gold demand.5
Footnotes
1Local financial markets were closed due to the CNY holiday between 28 January and 4 February 2025.
2For more, see: China's fourth-quarter GDP grows at 5.4%, beating market expectations | 16 January 2025.
3For more, see: 消费迎来“开门红”!春节期间零售和餐饮同比增长4.1%,以旧换新首批810亿元资金已下达_腾讯新闻 | 8 February 2025.
4For more, see: 2025春节黄金市场热潮:小克重产品爆红,消费者观望情绪升温_金价_变化_央行| 7 February 2025.
5For more, see: China’s Insurance Funds Inject New Vitality into Global and Domestic Gold Markets | World Gold Council | 19 February 2025.
Unearthed: Gold price soars amid tariff concerns
Unearthed Podcast
World Gold CouncilIn this episode of Unearthed, hosts Joe Cavatoni and John Reade from the World Gold Council share their expert views on the potential unintended impact of US tariffs on gold. While broad-based tariffs are not expected to specifically target gold, Joe and John discuss the actions traders and risk managers are already taking in response.
They also discuss how speculation has shifted gold inventories between London and New York, causing temporary price imbalances and liquidity concerns. Looking ahead, the hosts emphasise the need to monitor the US economy, particularly inflation and potential rate cuts, which could further influence the gold market this year and bring Western investors back to the table.
Disclaimer
Important information and disclaimers
© 2025 World Gold Council. All rights reserved. World Gold Council and the Circle device are trademarks of the World Gold Council or its affiliates.
All references to LBMA Gold Price are used with the permission of ICE Benchmark Administration Limited and have been provided for informational purposes only. ICE Benchmark Administration Limited accepts no liability or responsibility for the accuracy of the prices or the underlying product to which the prices may be referenced. Other content is the intellectual property of the respective third party and all rights are reserved to them.
Reproduction or redistribution of any of this information is expressly prohibited without the prior written consent of World Gold Council or the appropriate copyright owners, except as specifically provided below. Information and statistics are copyright © and/or other intellectual property of the World Gold Council or its affiliates or third-party providers identified herein. All rights of the respective owners are reserved.
The use of the statistics in this information is permitted for the purposes of review and commentary (including media commentary) in line with fair industry practice, subject to the following two pre-conditions: (i) only limited extracts of data or analysis be used; and (ii) any and all use of these statistics is accompanied by a citation to World Gold Council and, where appropriate, to Metals Focus or other identified copyright owners as their source. World Gold Council is affiliated with Metals Focus.
The World Gold Council and its affiliates do not guarantee the accuracy or completeness of any information nor accept responsibility for any losses or damages arising directly or indirectly from the use of this information.
This information is for educational purposes only and by receiving this information, you agree with its intended purpose. Nothing contained herein is intended to constitute a recommendation, investment advice, or offer for the purchase or sale of gold, any gold-related products or services or any other products, services, securities or financial instruments (collectively, “Services”). This information does not take into account any investment objectives, financial situation or particular needs of any particular person.
Diversification does not guarantee any investment returns and does not eliminate the risk of loss. Past performance is not necessarily indicative of future results. The resulting performance of any investment outcomes that can be generated through allocation to gold are hypothetical in nature, may not reflect actual investment results and are not guarantees of future results. The World Gold Council and its affiliates do not guarantee or warranty any calculations and models used in any hypothetical portfolios or any outcomes resulting from any such use. Investors should discuss their individual circumstances with their appropriate investment professionals before making any decision regarding any Services or investments.
This information may contain forward-looking statements, such as statements which use the words “believes”, “expects”, “may”, or “suggests”, or similar terminology, which are based on current expectations and are subject to change. Forward-looking statements involve a number of risks and uncertainties. There can be no assurance that any forward-looking statements will be achieved. World Gold Council and its affiliates assume no responsibility for updating any forward-looking statements.
Information regarding QaurumSM and the Gold Valuation Framework
Note that the resulting performance of various investment outcomes that can be generated through use of Qaurum, the Gold Valuation Framework and other information are hypothetical in nature, may not reflect actual investment results and are not guarantees of future results. Neither World Gold Council (including its affiliates) nor Oxford Economics provides any warranty or guarantee regarding the functionality of the tool, including without limitation any projections, estimates or calculations.
Physically-backed gold ETFs do not lend their gold
Joseph Cavatoni
Senior Market Strategist, North America World Gold CouncilThere has been a lot of discussion in the market about sourcing gold, the gold lease rate and borrowing gold from ETFs. I thought it would be worth breaking down some details on one specific area of the market, which is often misunderstood: the US-listed physically-backed gold ETFs (gold ETFs) market and related lending activities.
Let me be crystal clear and upfront—gold ETFs do not lend their gold.
This includes SPDR Gold Trust (GLD), iShares Gold Trust (IAU), SPDR Gold Mini Shares Trust (GLDM)1 and all the additional US listed gold ETFs.2
Simply put, it is not permitted by the product design, nor is it permitted under the regulatory approval granted to each product. Yet, I can’t tell you how many times I’ve cringed hearing a market professional mischaracterize the market by saying that they borrow gold from gold ETFs or that a gold ETF lends its gold. Nothing could be further from the truth.
Why US-listed Physically-backed Gold ETFs Cannot Lend Gold
Gold ETFs hold only one asset: gold. There are three key distinctions that provide assurance the underlying assets are never lent:
- No regulatory approval has been provided to lend any of the underlying assets held by the fund/trust.
- No economic benefits from activities related to securities lending are received by the fund/trust.
- No risk factors are cited related to securities lending as it is not a feature embedded in the structure.
Additionally, if an ETF engages in securities lending, there are required disclosures informing investors that the fund may lend the underlying assets and of the associated risks.3 By contrast, US-listed physically-backed gold ETFs have no such disclosures, and the publicly filed agreements governing the trusts do not allow for securities lending by the trusts.4
What Happens Instead: Borrowing and Lending ETF Shares
Now that we are clear that US-listed physically-backed gold ETFs do not lend any gold, let's discuss what is possible once a gold ETF becomes established, liquid and mainstream.
As a gold ETF becomes well-adopted into the market, it often becomes a key component of the capital markets ecosystem around the asset it represents. This is the case with GLD and IAU, for example, which have significant levels of AUM, high volumes on the US equity exchanges, and are regularly available for borrowing and lending in the securities finance markets.
Here’s how it works: Traders and speculators often borrow shares of such a gold ETF through standard securities lending relationships, which involve the gold ETF’s shareholders, and do not involve the London gold lease market, or the trust, itself.
Those looking to access bullion short will use the securities finance market to borrow shares of the gold ETF. These shares are lent by the shareholder, not by the trust. For the borrower to access a short gold position, they need to either short that gold ETF (which carries risk) or redeem the shares for physical gold, which can then be sold in the London market.
Importantly, these transactions are conducted between owners of the gold ETF, the custody bank that maintains a “lending program” for the client who owns the gold ETF and those who are borrowing the shares.
The following are also true:
- All fees, income and risks associated with that transaction are separate and distinct from the activities of the fund or trust;
- The transaction has no bearing on the gold ETF’s ability to perform its role as an appropriate access mechanism to a unit trust that provides the price performance of gold with little or no variance from the reference price (in this case the LBMA Gold Price PM);
- No economics are received by the gold ETF; and
- No risk of recall, no risk of market dislocation and no risk of credit default are taken by the gold ETF.
When it is time for this independent lending transaction to close out, the borrower of the gold ETF will either buy shares in the secondary market to cover their borrow or unwind by purchasing gold in the OTC market. Once the gold is purchased, using the proper channels, they will submit that gold to create gold ETF shares and use those new shares to close out the borrow.
Either way, the borrowing and unwinding of the trade will result in a healthy level of activity in both the primary market (OTC London bullion market) and the secondary market (listed exchange volume in the US), which will match buyers and sellers. Any imbalance again gets handled by creation or redemption with approved authorized participants.
Market Benefits of Physically-backed Gold ETFs
This type of activity illustrates how gold ETFs add liquidity to the overall gold market ecosystem. Increased trading volumes and the participation of more market participants lead to tighter bid-offer spreads, reducing costs for investors and improving market efficiency. Additionally, these ETFs make gold a more mainstream investment instrument by eliminating the challenges of trading physical gold, such as storage, transfer, or questions about gold type or authenticity.
Conclusion
To summarize: US-listed physically-backed gold ETFs, including GLD and IAU, do not lend their gold. However, their role in the secondary market indirectly contributes to the overall liquidity and sophistication of the gold market, making gold a more accessible and appealing investment option.
Footnotes
1See the most recent prospectus for iShares Gold Trust available here, SPDR Gold Trust available here, SPDR Gold Mini Shares Trust available here.
2Gold ETF: Stock, Holdings and Flows | World Gold Council.
3For example, see the most recent prospectus for iShares Core S&P 500 ETF (IVV) available here and SPDR Portfolio Long Term Treasury ETF (SPTL) available here.
4For example, see the most recent prospectus for iShares Gold Trust available here and SPDR Gold Trust available here.
Unearthed: Digging deep into China’s new economic stimulus package ft. Professor Hao Zhou
Unearthed Podcast
World Gold CouncilIn this episode of Unearthed, co-hosts Joe Cavatoni and John Reade, Senior Market Strategists for the World Gold Council, are joined by Professor Hao Zhou from Tsinghua University to dive into the shifting dynamics of China’s economy and its impact on the global gold market.
Together, they discuss China’s incredible economic transformation since 1978, the causes behind the recent slowdown in economic growth described by Professor Zhou as the three interconnected problems of: declining real estate, local government debt, and suppressed private industry. The trio also review how China’s new stimulus package could get the country back on the growth trajectory, and to conclude, Professor Zhou gives his two cents on what’s in store for the gold market in China.
Disclaimer
Important information and disclaimers
© 2025 World Gold Council. All rights reserved. World Gold Council and the Circle device are trademarks of the World Gold Council or its affiliates.
All references to LBMA Gold Price are used with the permission of ICE Benchmark Administration Limited and have been provided for informational purposes only. ICE Benchmark Administration Limited accepts no liability or responsibility for the accuracy of the prices or the underlying product to which the prices may be referenced. Other content is the intellectual property of the respective third party and all rights are reserved to them.
Reproduction or redistribution of any of this information is expressly prohibited without the prior written consent of World Gold Council or the appropriate copyright owners, except as specifically provided below. Information and statistics are copyright © and/or other intellectual property of the World Gold Council or its affiliates or third-party providers identified herein. All rights of the respective owners are reserved.
The use of the statistics in this information is permitted for the purposes of review and commentary (including media commentary) in line with fair industry practice, subject to the following two pre-conditions: (i) only limited extracts of data or analysis be used; and (ii) any and all use of these statistics is accompanied by a citation to World Gold Council and, where appropriate, to Metals Focus or other identified copyright owners as their source. World Gold Council is affiliated with Metals Focus.
The World Gold Council and its affiliates do not guarantee the accuracy or completeness of any information nor accept responsibility for any losses or damages arising directly or indirectly from the use of this information.
This information is for educational purposes only and by receiving this information, you agree with its intended purpose. Nothing contained herein is intended to constitute a recommendation, investment advice, or offer for the purchase or sale of gold, any gold-related products or services or any other products, services, securities or financial instruments (collectively, “Services”). This information does not take into account any investment objectives, financial situation or particular needs of any particular person.
Diversification does not guarantee any investment returns and does not eliminate the risk of loss. Past performance is not necessarily indicative of future results. The resulting performance of any investment outcomes that can be generated through allocation to gold are hypothetical in nature, may not reflect actual investment results and are not guarantees of future results. The World Gold Council and its affiliates do not guarantee or warranty any calculations and models used in any hypothetical portfolios or any outcomes resulting from any such use. Investors should discuss their individual circumstances with their appropriate investment professionals before making any decision regarding any Services or investments.
This information may contain forward-looking statements, such as statements which use the words “believes”, “expects”, “may”, or “suggests”, or similar terminology, which are based on current expectations and are subject to change. Forward-looking statements involve a number of risks and uncertainties. There can be no assurance that any forward-looking statements will be achieved. World Gold Council and its affiliates assume no responsibility for updating any forward-looking statements.
Information regarding QaurumSM and the Gold Valuation Framework
Note that the resulting performance of various investment outcomes that can be generated through use of Qaurum, the Gold Valuation Framework and other information are hypothetical in nature, may not reflect actual investment results and are not guarantees of future results. Neither World Gold Council (including its affiliates) nor Oxford Economics provides any warranty or guarantee regarding the functionality of the tool, including without limitation any projections, estimates or calculations.
Unearthed: Outlook for Gold in 2025
Unearthed Podcast
World Gold CouncilJoe Cavatoni and John Reade of the World Gold Council review gold's impressive 2024 performance, with a 28% gain through November—the best in over a decade. They explore the outlook for 2025, expecting modest growth fueled by falling U.S. interest rates and a slow economic recovery.
The conversation looks at key factors shaping gold markets: U.S. economic policies, geopolitical uncertainty, and emerging innovation. As Bitcoin hits record highs and central banks like China’s return to gold, the episode explores how these trends might position gold as a steady asset in an unpredictable year ahead.
This episode was recorded on December 9, 2024.
Disclaimer
Important information and disclaimers
© 2025 World Gold Council. All rights reserved. World Gold Council and the Circle device are trademarks of the World Gold Council or its affiliates.
All references to LBMA Gold Price are used with the permission of ICE Benchmark Administration Limited and have been provided for informational purposes only. ICE Benchmark Administration Limited accepts no liability or responsibility for the accuracy of the prices or the underlying product to which the prices may be referenced. Other content is the intellectual property of the respective third party and all rights are reserved to them.
Reproduction or redistribution of any of this information is expressly prohibited without the prior written consent of World Gold Council or the appropriate copyright owners, except as specifically provided below. Information and statistics are copyright © and/or other intellectual property of the World Gold Council or its affiliates or third-party providers identified herein. All rights of the respective owners are reserved.
The use of the statistics in this information is permitted for the purposes of review and commentary (including media commentary) in line with fair industry practice, subject to the following two pre-conditions: (i) only limited extracts of data or analysis be used; and (ii) any and all use of these statistics is accompanied by a citation to World Gold Council and, where appropriate, to Metals Focus or other identified copyright owners as their source. World Gold Council is affiliated with Metals Focus.
The World Gold Council and its affiliates do not guarantee the accuracy or completeness of any information nor accept responsibility for any losses or damages arising directly or indirectly from the use of this information.
This information is for educational purposes only and by receiving this information, you agree with its intended purpose. Nothing contained herein is intended to constitute a recommendation, investment advice, or offer for the purchase or sale of gold, any gold-related products or services or any other products, services, securities or financial instruments (collectively, “Services”). This information does not take into account any investment objectives, financial situation or particular needs of any particular person.
Diversification does not guarantee any investment returns and does not eliminate the risk of loss. Past performance is not necessarily indicative of future results. The resulting performance of any investment outcomes that can be generated through allocation to gold are hypothetical in nature, may not reflect actual investment results and are not guarantees of future results. The World Gold Council and its affiliates do not guarantee or warranty any calculations and models used in any hypothetical portfolios or any outcomes resulting from any such use. Investors should discuss their individual circumstances with their appropriate investment professionals before making any decision regarding any Services or investments.
This information may contain forward-looking statements, such as statements which use the words “believes”, “expects”, “may”, or “suggests”, or similar terminology, which are based on current expectations and are subject to change. Forward-looking statements involve a number of risks and uncertainties. There can be no assurance that any forward-looking statements will be achieved. World Gold Council and its affiliates assume no responsibility for updating any forward-looking statements.
Information regarding QaurumSM and the Gold Valuation Framework
Note that the resulting performance of various investment outcomes that can be generated through use of Qaurum, the Gold Valuation Framework and other information are hypothetical in nature, may not reflect actual investment results and are not guarantees of future results. Neither World Gold Council (including its affiliates) nor Oxford Economics provides any warranty or guarantee regarding the functionality of the tool, including without limitation any projections, estimates or calculations.
Unearthed: Calm in the Gold Market & What to Watch in Q3
Unearthed Podcast
World Gold CouncilThis episode was recorded on 8 July 2026.
In this episode of Unearthed, hosts John Reade and Joe Cavatoni take stock of a gold market that has calmed after a more volatile first half of the year. They discuss price movement to this point, gold briefly dipping below $4,000/oz before steadying, and expectations for the price of gold through the second half of the year.
The two unpack the regional and category-level dynamics behind the relative calm, including a quieter Chinese market and the seasonal patterns that have historically influenced gold this time of year. They also dig into the sharp shift in US interest rate expectations amid geopolitical tension in the Middle East and renewed inflation pressure.
Looking ahead, the hosts flag a busy period of catalysts, from the June FOMC meeting minutes and mid-month Beige Book release to the Fed's next meeting in late July and the always-closely-watched Jackson Hole symposium in September.
Subscribe to Unearthed wherever you get your podcasts and visit Goldhub.com for more insights.
Disclaimer
Important information and disclaimers
© 2026 World Gold Council. All rights reserved. World Gold Council and the Circle device are trademarks of the World Gold Council or its affiliates.
All references to LBMA Gold Price are used with the permission of ICE Benchmark Administration Limited and have been provided for informational purposes only. ICE Benchmark Administration Limited accepts no liability or responsibility for the accuracy of the prices or the underlying product to which the prices may be referenced. Other content is the intellectual property of the respective third party and all rights are reserved to them.
Reproduction or redistribution of any of this information is expressly prohibited without the prior written consent of World Gold Council or the appropriate copyright owners, except as specifically provided below. Information and statistics are copyright © and/or other intellectual property of the World Gold Council or its affiliates or third-party providers identified herein. All rights of the respective owners are reserved.
The use of the statistics in this information is permitted for the purposes of review and commentary (including media commentary) in line with fair industry practice, subject to the following two pre-conditions: (i) only limited extracts of data or analysis be used; and (ii) any and all use of these statistics is accompanied by a citation to World Gold Council and, where appropriate, to Metals Focus or other identified copyright owners as their source. World Gold Council is affiliated with Metals Focus.
The World Gold Council and its affiliates do not guarantee the accuracy or completeness of any information nor accept responsibility for any losses or damages arising directly or indirectly from the use of this information.
This information is for educational purposes only and by receiving this information, you agree with its intended purpose. Nothing contained herein is intended to constitute a recommendation, investment advice, or offer for the purchase or sale of gold, any gold-related products or services or any other products, services, securities or financial instruments (collectively, “Services”). This information does not take into account any investment objectives, financial situation or particular needs of any particular person.
Diversification does not guarantee any investment returns and does not eliminate the risk of loss. Past performance is not necessarily indicative of future results. The resulting performance of any investment outcomes that can be generated through allocation to gold are hypothetical in nature, may not reflect actual investment results and are not guarantees of future results. The World Gold Council and its affiliates do not guarantee or warranty any calculations and models used in any hypothetical portfolios or any outcomes resulting from any such use. Investors should discuss their individual circumstances with their appropriate investment professionals before making any decision regarding any Services or investments.
This information may contain forward-looking statements, such as statements which use the words “believes”, “expects”, “may”, or “suggests”, or similar terminology, which are based on current expectations and are subject to change. Forward-looking statements involve a number of risks and uncertainties. There can be no assurance that any forward-looking statements will be achieved. World Gold Council and its affiliates assume no responsibility for updating any forward-looking statements.
Information regarding the LBMA Gold Price
The LBMA Gold Price is used by the World Gold Council with permission under license by ICE Benchmark Administration Limited and is subject to the restrictions set forth here (www.gold.org/terms-and-conditions).
Information regarding QaurumSM and the Gold Valuation Framework
Note that the resulting performance of various investment outcomes that can be generated through use of Qaurum, the Gold Valuation Framework and other information are hypothetical in nature, may not reflect actual investment results and are not guarantees of future results. Neither World Gold Council (including its affiliates) nor Oxford Economics provides any warranty or guarantee regarding the functionality of the tool, including without limitation any projections, estimates or calculations.
Information from ICRA Analytics Limited
All information obtained from ICRA Analytics Limited contained in this document is subject to the disclaimer set forth here (www.icraanalytics.com/terms-of-use/disclaimer).
India gold market update: Investment demand shines
Kavita Chacko
Research Head, India World Gold CouncilHighlights
- Jewellery demand weakens post-Diwali, while investment demand for gold bars and coins remains strong
- Indian gold ETFs maintain strong inflows, adding 14.5t year-to-date1
- The Reserve Bank of India’s (RBI) continues its gold accumulation, boosting reserves to 876t
- Initial reports suggest gold imports saw a significant rise in November.
Looking ahead
- Jewellery demand may face short-term pressure due to the upcoming inauspicious period for gold purchases but investment demand is expected to remain supportive.
Gold’s ascent slows amid volatility
After months of gains and record highs, gold's upward momentum has slowed since early November. Prices have dropped 4% from their October peak to US$2,670/oz2. Rising US Treasury yields, a stronger US dollar, moderating inflation concerns, and a slowdown in market momentum following the US Presidential elections have contributed to the decline. Conversely, persistent and emerging geopolitical risks continue to support prices. In the domestic market, gold prices followed global trends with a more moderate 3% drop from October's peak. This was partly due to a 0.8% fall in the Indian rupee against the dollar. By mid-December, domestic gold was priced at INR 77,185/10g, having fluctuated between INR 73,477 and INR 78,669/10g since late October.
Despite this recent weakness, gold remains one of the top-performing assets of the year, with y-t-d returns of 22% in INR and 29% in USD terms.
Domestic gold prices traded at a premium to international prices for most of November. After trading at a marginal discount (average of US$1.2/oz) for the first 10 days of the month, domestic gold prices moved into a premium, ranging from US$0.5/oz to US$7.5/oz. This shift was likely influenced by a rise in investor demand as gold prices weakened. Since early December, domestic prices have shifted to a discount relative to international prices, with the discount widening to US$7/oz by 13 December, coinciding with the start of the inauspicious gold-buying period in the Hindu calendar.
Chart 1: Gold's momentum eases after recent gains
Monthly LBMA Price AM and domestic landed price* changes and movement
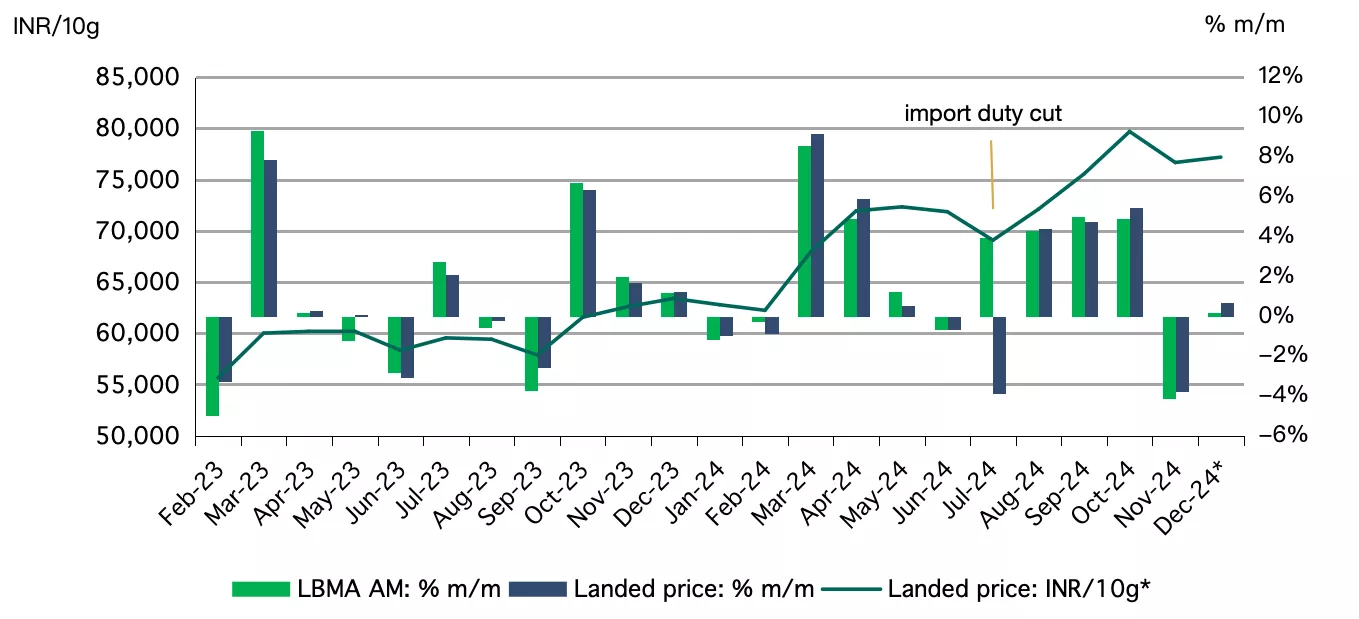
*Based on the LBMA Gold Price AM in USD expressed in local currency as of 13 December 2024. Landed price includes import tariff and tax.
Source: Bloomberg, World Gold Council
Jewellery sales dip, but investment demand continues
Since the peak Diwali buying season, jewellery demand has been lacklustre; gold prices fluctuations have kept consumers on the sidelines despite the onset of the wedding season. But physical investment demand has shown steady growth, with anecdotal reports indicating strong sales of gold bars and coins. The positive sentiment around gold prices and its appeal as an investment asset have likely supported this trend, which is expected to continue.
In the near term, demand could face pressure due to the upcoming inauspicious period for purchasing gold, as per the Hindu calendar, which runs from mid-December to mid-January. Nonetheless, there are expectations of some demand from holiday purchases, particularly from non-resident Indians visiting the country during this period.
Gold ETF demand remains resilient
November’s Indian gold ETF inflows, while lower than the record levels seen in October, remained strong and surpassed the average monthly inflow for 2024. The continued positive sentiment towards gold, coupled with volatility in domestic equity markets, likely fuelled these inflows, even as major global markets experienced outflows. According to the Association of Mutual Funds in India (AMFI), gold ETFs saw net inflows of INR12.6bn (~US$149mn) in November, well above this year’s average monthly inflows of INR9.6bn (US$115mn). These healthy inflows are in line with our initial estimate which was based on partial information.3
Total assets under management (AUM) in Indian gold ETFs stood at INR442bn(~US$5.2bn) at the end of November, a 60% y/y growth. Additionally, collective gold holdings in ETFs grew to 56.6t, marking a 35% y/y growth.
The strong inflows into gold ETFs this year underscore heightened investor interest, with inflows recorded in every month except April. Over the first 11 months of 2024, net inflows into gold ETFs amounted to INR106bn(~US$1265mn), a 3.7-fold increase from last year. During this period, 14.5t of gold was added to the cumulative holdings of these funds. Three new gold ETFs were launched in India this year, bringing the total number of physically backed funds available in the local market to 18.
Chart 2: Above average gold ETF inflows in November
Monthly gold ETF fund flows in INRbn, and total holdings in tonnes*
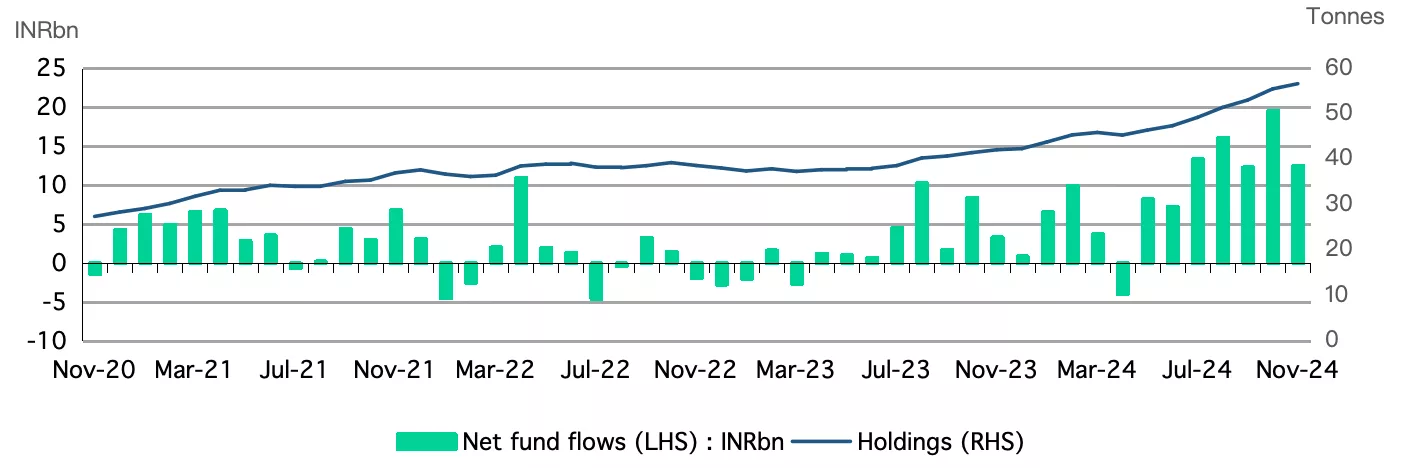
*As of end November 2024.
Source: Company filings, AMFI, CMIE, World Gold Council
RBI piles up more gold
The RBI further added to its gold reserves in November, bringing its total holding to 876t, a 9% increase from the previous year.4 The RBI has been one of the largest gold buyers among central banks this year. According to the banks data5 and our own estimates, 8.4t was added to its gold holdings in November. This marks the 11th consecutive month of gold purchases, with an average monthly acquisition of 6.6t. So far in 2024, the RBI has added 72.6t to its gold reserves significantly outpacing the 16t added in 2023 and the 33t in 2022. Gold now represents 10.2% of the RBI’s forex reserves, up from 7.8% a year ago.
Chart 3: Sizeable addition to RBI’s gold reserves in 2024
RBI’s net purchases and reserves, in tonnes*
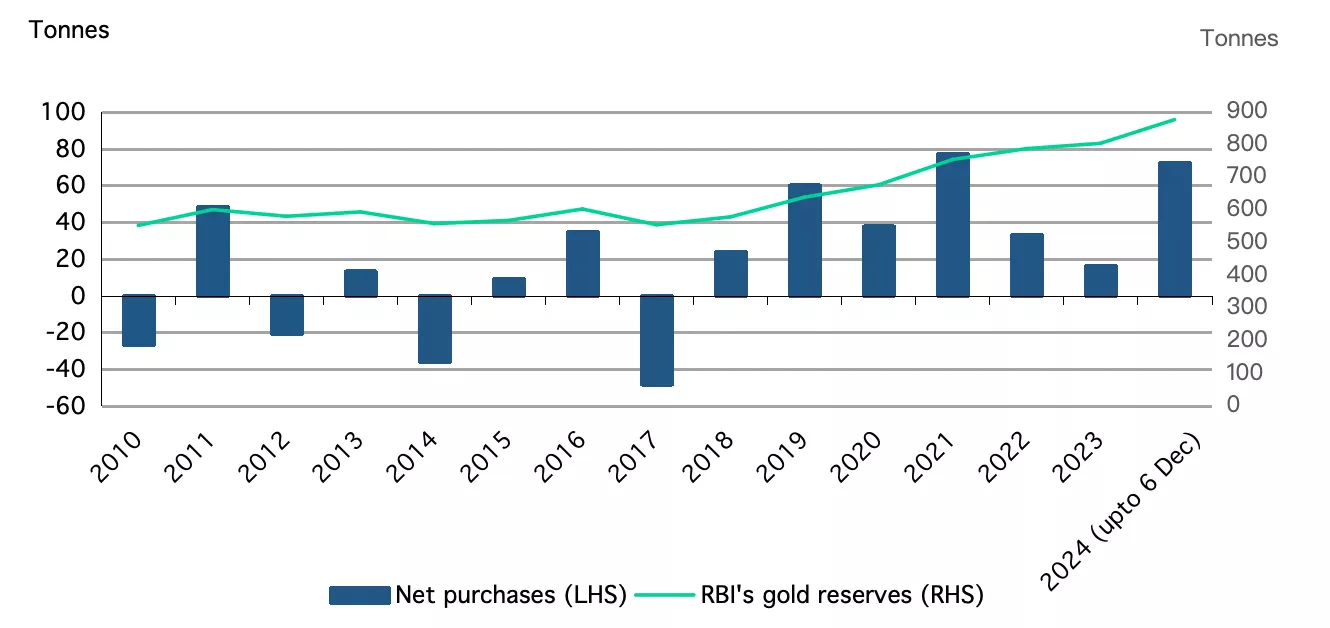
*Data as of 6 December 2024.
Source: RBI, World Gold Council
Gold imports hit a record high
Initial reports suggest that gold imports saw a significant surge in November, reaching record levels. According to data from the Ministry of Commerce, imports in November amounted to US$14.8bn,6 more than double the previous month's total and over four times higher than the same period last year. Our estimates based on this data suggest that the import volume was approximately 170-180t, a substantial increase from October's 86t and the average of 63t over the first 10 months of 2024. Over the first 11 months of 2024 gold imports have risen by 48%, totalling US$59bn (INR4,916bn), with volumes likely exceeding 800t, compared to 689t in the same period of 2023. However, given the sizable figure reported in November, we are having active conversations with local gold industry stakeholders to better understand – if accurate – the drivers of the spike.7
Chart 4: Surge in gold imports
Monthly gold imports; in tonnes and US$bn*
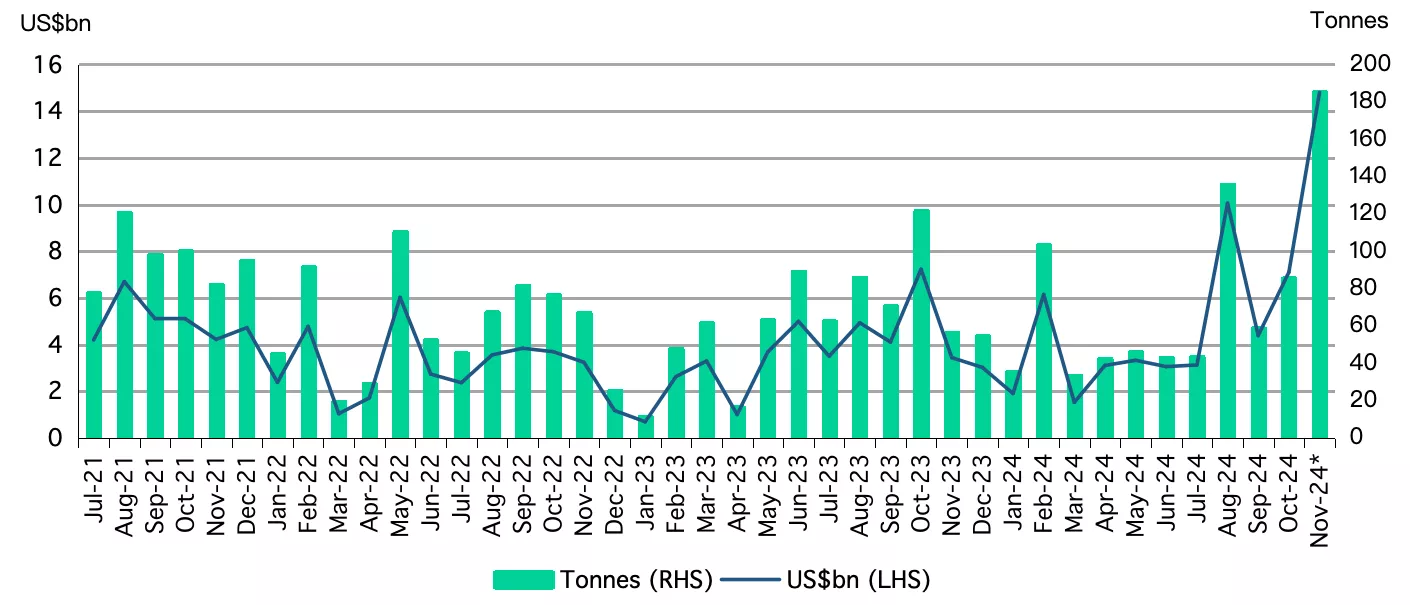
*Includes World Gold Council estimates.
Source: Ministry of Commerce and Industry, CMIE, World Gold Council
Footnotes
1As of end November 2024
2Based on LBMA Gold Price AM as of 13 December 2024
3The daily AUM and NAV data published by AMFI covers 14 of the country’s18 gold ETFs.
4We have revised our estimate of RBI’s October’24 net gold purchase from 27t to 14t.
5Forex reserve data in the Weekly Statistical Supplement.
6 Ministry of Commerce and Industry: India’s Foreign Trade for the month of November 2024
7 India’s record gold imports said to be due to calculation error, Bloomberg, 18 December 2024
India’s gold market update: Festive buying holds ground in the face of high prices
Kavita Chacko
Research Head, India World Gold CouncilPublished 18 November 2024, updated 17 December 2024.
Highlights
- Despite record-high prices Diwali gold demand was healthy, with strong sales driven by investment appeal
- Indian gold ETFs continue to attract strong interest from investors, with October seeing the largest inflows on record
- The Reserve Bank of India (RBI) has purchased 64t1 of gold to date this year, making it the third highest annual purchase on record
- Uptick in gold imports in October.
Looking ahead
- A price correction or stabilisation could stimulate demand after the peak festive season and during the upcoming wedding season from November to March
- Bullish sentiment is likely to sustain investment interest in gold amid ongoing volatility in equity markets.
Gold extended its record-breaking streak into October; momentum softens post US elections
Gold continued its rally in October for the fourth consecutive month, hitting multiple fresh highs and closing the month with a gain of almost 5%, at US$2,779/oz.2 The price rise was driven by event risk and uncertainty surrounding the US elections, along with escalating geopolitical tensions, which outweighed the higher opportunity cost for gold on account of a stronger US dollar and higher bond yields (see Let's tally the rally). The domestic gold price mirrored movements in the international price, although with a slightly higher gain due to the 0.2% depreciation of the Indian rupee (INR) and festive buying support. In the domestic market gold closed the month at INR79,683/10g,3 up 5.5% in the month.
The rally in gold paused post the US election as the dollar strengthened and Treasury yields rose. In fact, both international and domestic gold prices have fallen by 8% since the end of October. Despite this recent pullback, gold remains one of the best-performing assets this year, with a y-t-d return of 17% in INR terms at the time of publication.
Chart 1: Gold’s climb slows after October gains
Monthly LBMA Price AM and domestic landed price* changes and movement
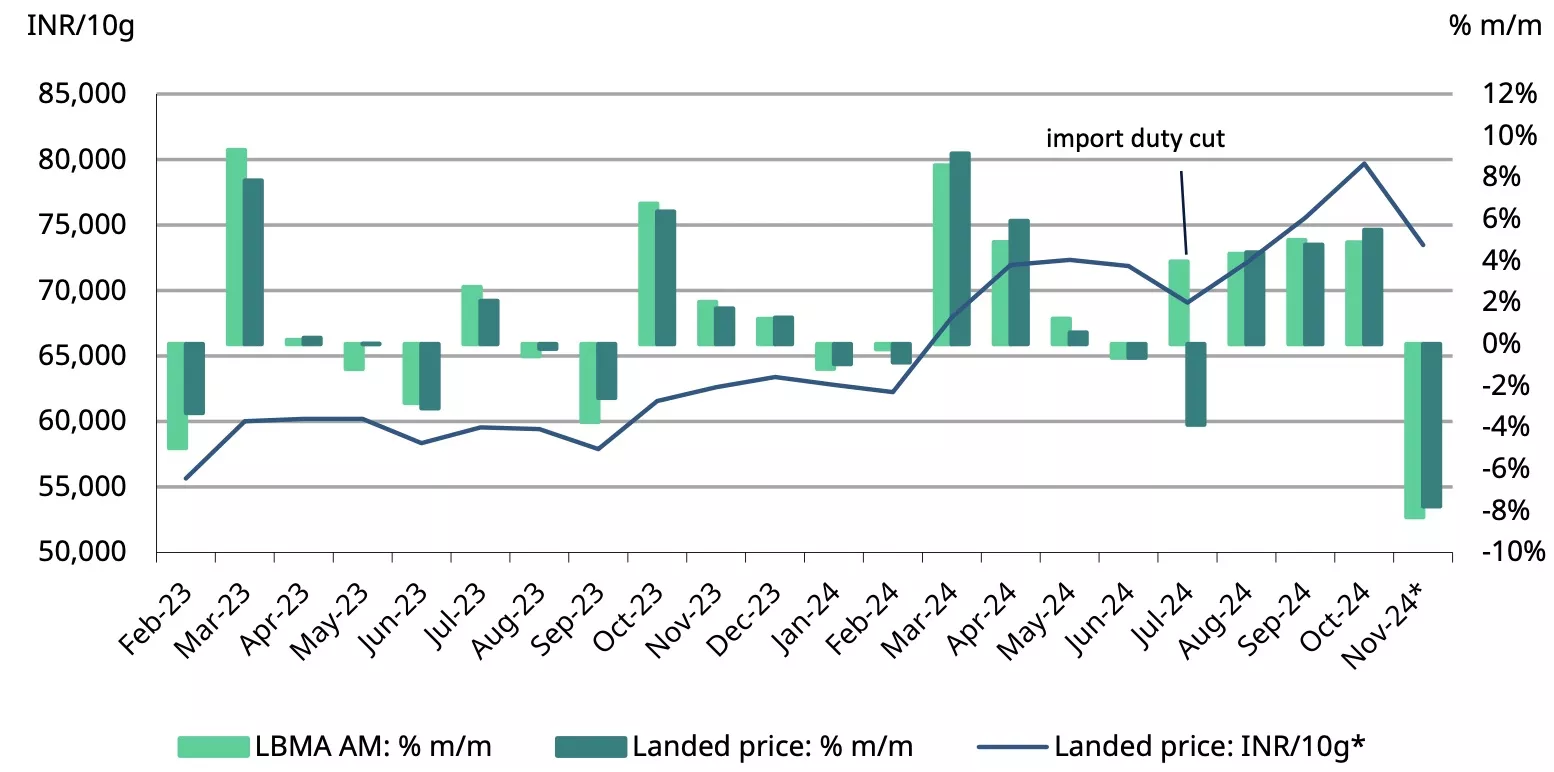
*Based on the LBMA Gold Price AM in USD expressed in local currency as of 14 November 2024. Landed price includes import tariff and tax.
Source: Bloomberg, World Gold Council
Gold in the domestic market has been trading at a slight discount to its international counterpart4 since mid-August, reflecting a balanced demand-supply dynamic. Following the sharp import duty cut in July, the flow of smuggled gold into the country has almost ceased, making way for official imports.
Domestic gold prices were at par with – or even at a slight premium to – the international prices around the peak festive period in late October, reflecting the higher level of demand. The average monthly discount narrowed from US$5/oz in September to US$2.8/oz in October, before tapering to US$1/oz in the first week of November.
Chart 2: Domestic gold prices trade at a marginal discount to international prices
NCDEX gold premium/discount relative to international price*
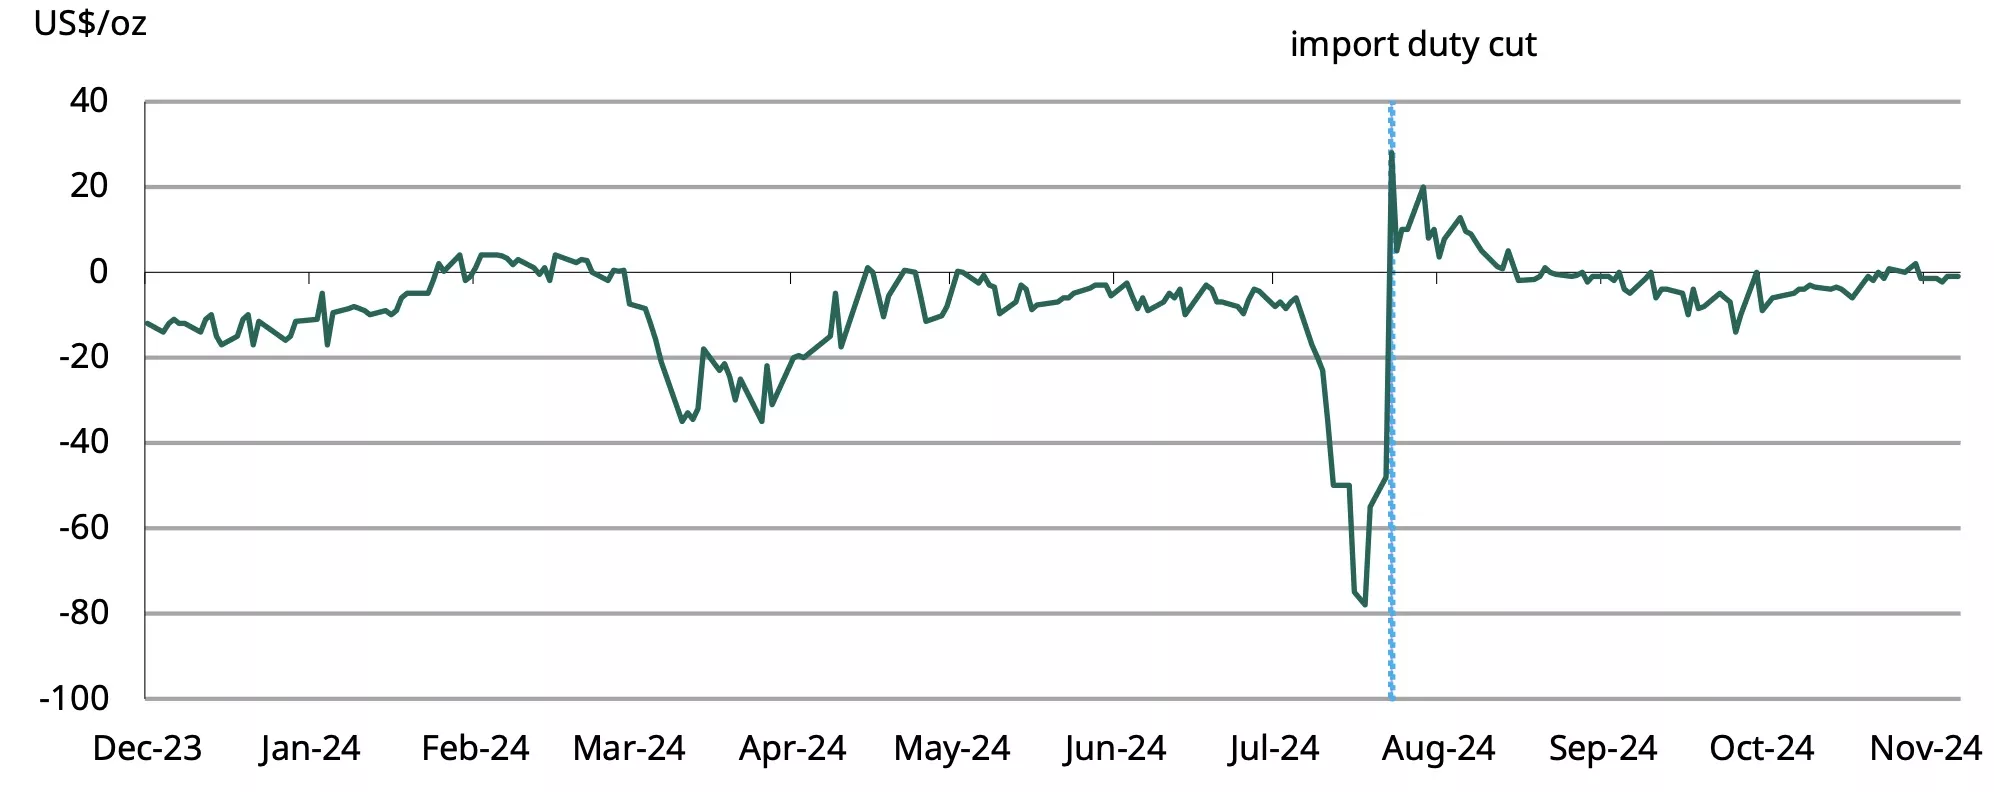
*As of 7 November 2024.
Source: NCDEX, World Gold Council
Festive auspicious buying and bullish sentiment support gold demand
Despite record high prices, consumer buying during Diwali was strong in both gold jewellery and bars and coins.5 Markets and media reported higher footfall at jewellery stores and robust buying of coins via online as well as offline platforms. Promotional events and marketing campaigns undertaken by jewellers to lift sales.6 The price increase since Diwali 2023, has enhanced consumer sentiment, positioning it as a long-term investment. And volatility in domestic equity markets, coupled with rising international prices, has added to gold’s investment appeal. Anecdotal reports suggest that auspicious ‘token’ purchases were rather broad-based, spanning regions and demographics.
Despite a y/y drop in the volume of gold sold,7 the value of sales increased, driven by the higher price.
Consistent demand for gold ETFs
Indian gold ETFs continued to attract strong inflows in October, fuelled by a favourable gold price momentum and increased volatility in domestic stock markets. The long-term capital gains treatment for gold, which was announced in July, has provided a continued boost, as reflected in the significant rise in inflows since that time.
From July to October monthly average net inflows into Indian gold ETFs reached INR15.4bn/US$183mn, a significant increase from the average of INR5.3bn (~US$63mn) in the first half of the year. According to the Association of Mutual Funds in India (AMFI), October saw record net inflows of INR19.6bn (~US$233mn), pushing the total assets under management (AUM) for Indian gold ETFs to a new high of INR445bn(~US$5.3bn). This represented a 12% m/m and a 70% y/y increase. Over the first 10 months of 2024 total net inflows into Indian gold ETFs reached INR93bn(~US$1.11bn), a substantial rise from INR25bn($301mn) during the same period last year. These funds have collectively added 12.2t of gold to date in 2024, bringing their total gold holdings to 54.5t and representing a 32% y/y growth.
Chart 3: Record inflows boost cumulative gold holdings
Monthly gold ETF fund flows in INRbn and total holdings in tonnes*
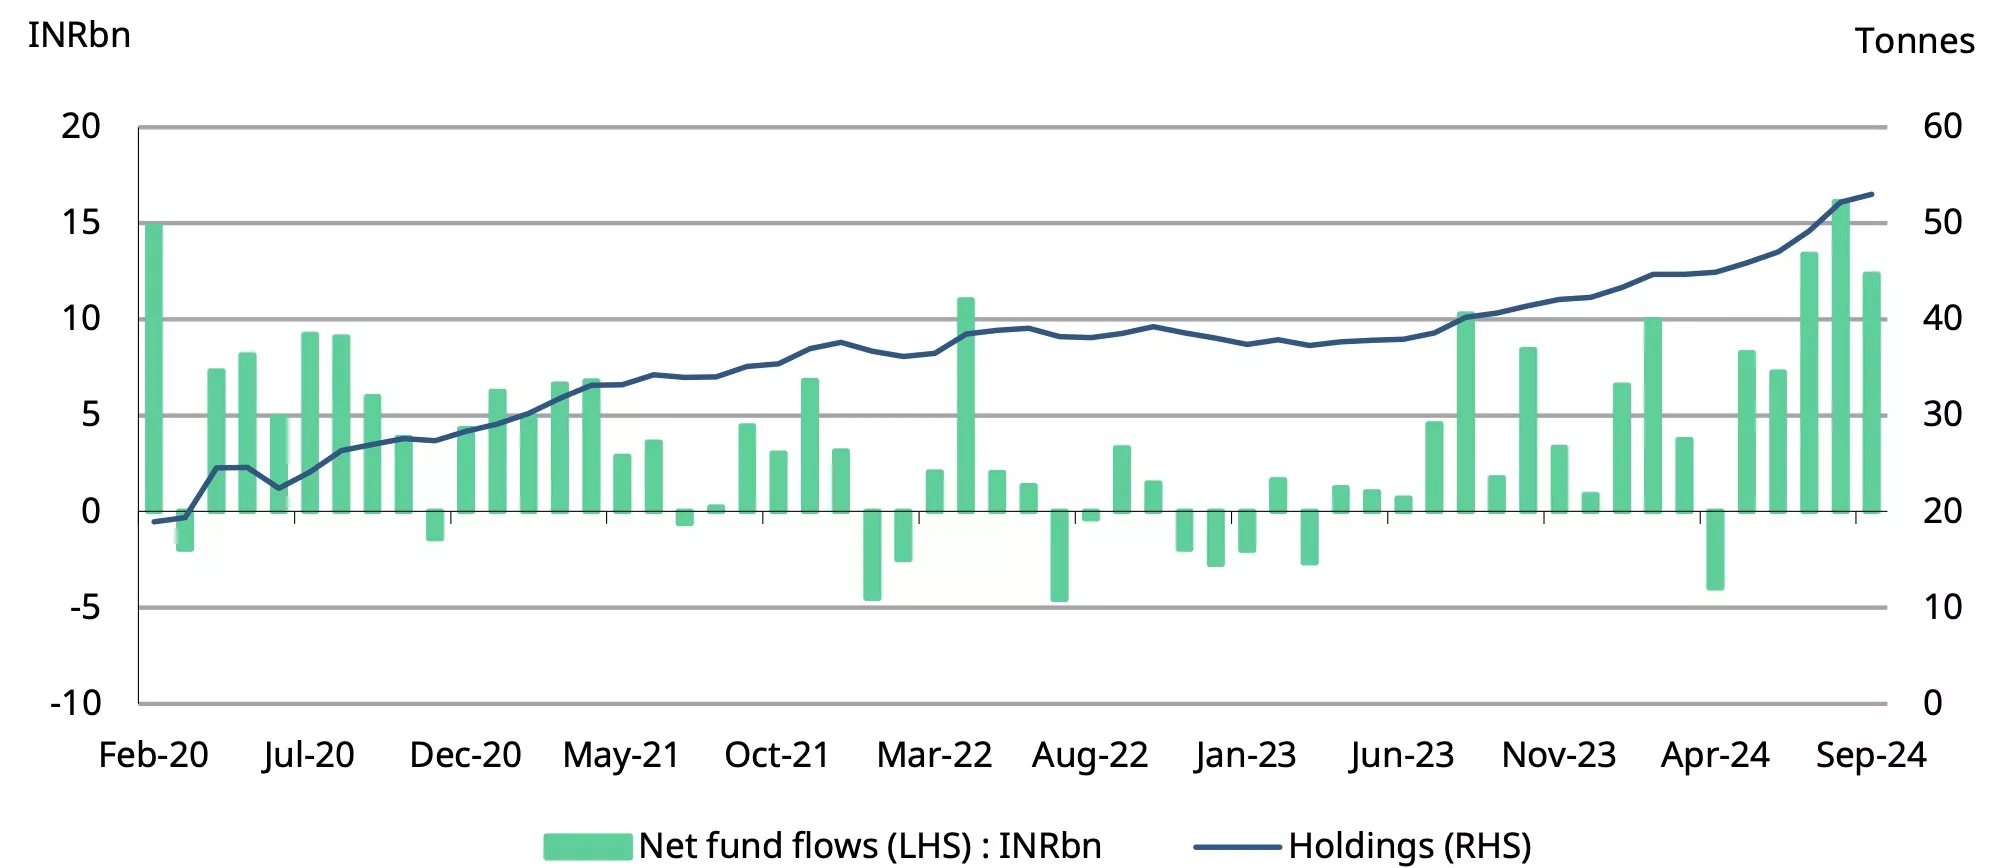
*As of end October 2024.
Source: Bloomberg, company filings, AMFI, CMIE, World Gold Council
Sizeable addition to the RBI’s gold reserves in October
The RBI made significant gold purchases in October, boosting its total reserves by 8% y-t-d to 868t. According to RBI data8 and our own estimates, around 14t of gold was added to the central bank’s foreign exchange reserves in the month, bringing total gold y-t-d purchases to 64t.9 This makes it the third-highest annual net gold purchase by the RBI, after the 257t purchased in 2009 and 77t in 2021. In value terms, gold now accounts for 10% of total foreign exchange reserves, the highest share since 1999.
Alongside this expansion the RBI has focused on holding its gold reserves domestically10 and has reduced the amount kept in safekeeping with the Bank of England and the Bank for International Settlements (BIS). As of end-September 2024, 60% of the RBI’s total gold reserves – equivalent to 510t – were held domestically, an increase of 102t since March 2024. This marks a significant rise from the 38% held in domestic storage in March 2023.
Chart 4: RBI's gold stock hits historic highs
RBI’s net purchases and reserves, in tonnes*
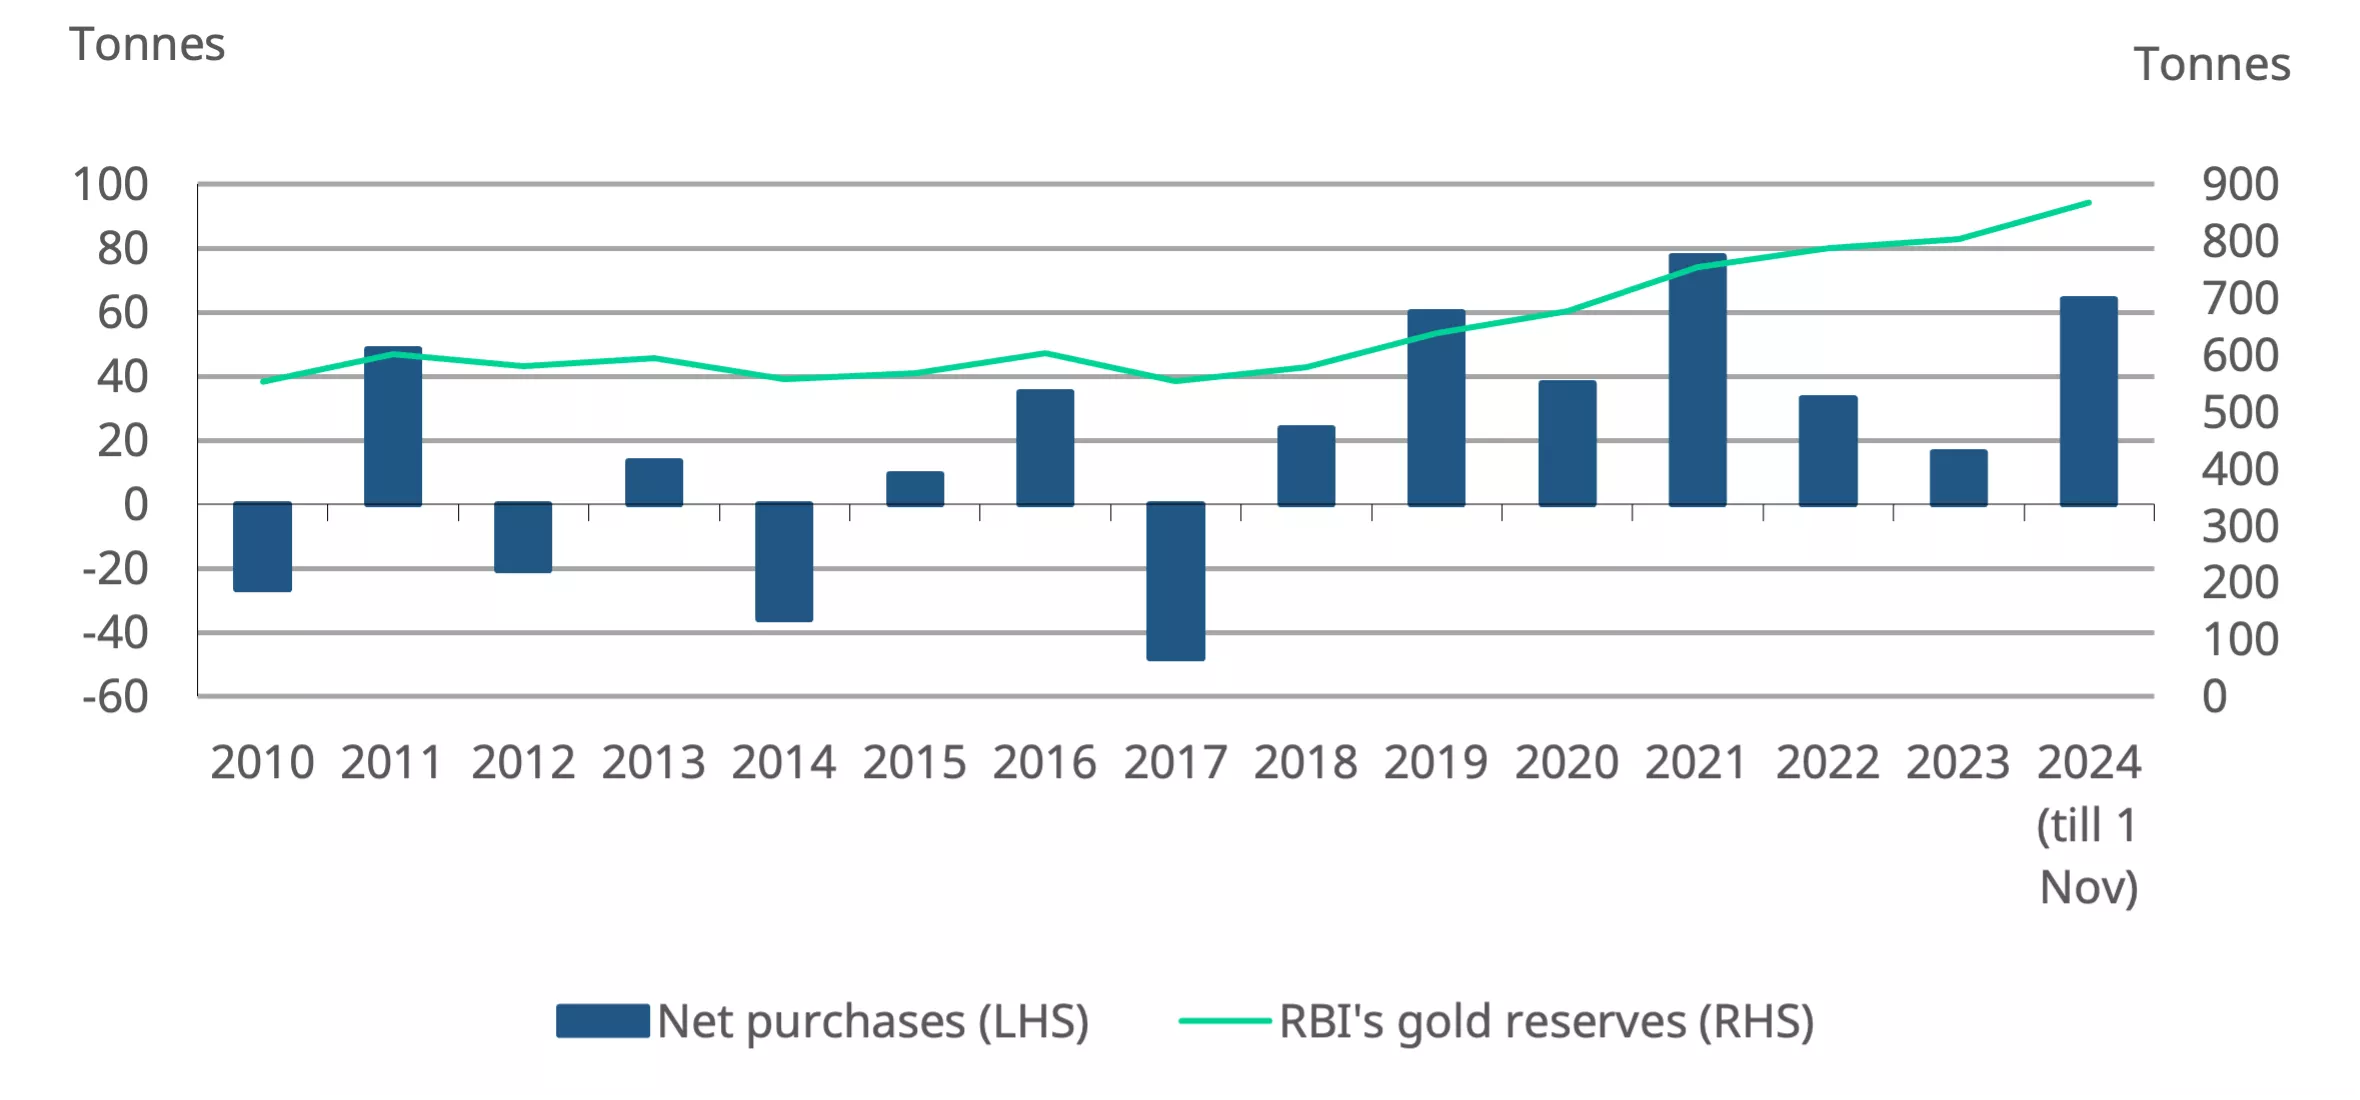
*Data as of 1 November 2024.
Source: RBI, World Gold Council
Imports rise amid seasonal demand
In October, gold imports rose to $7.13bn from $4.39bn in the previous month, reflecting the seasonal uptick in demand for festivals and weddings. Our estimates indicate that the volume of imports was approximately 90-92t, higher than the 59t imported in September. Since the reduction in import duties in July, monthly imports have averaged around 95t, up from 50t earlier in the year. Year-to-date, gold imports have grown by 21%, totaling $44bn, with volumes remaining steady at around 635t.
Chart 5: Gold imports expand
Monthly gold imports; in tonnes and US$bn*
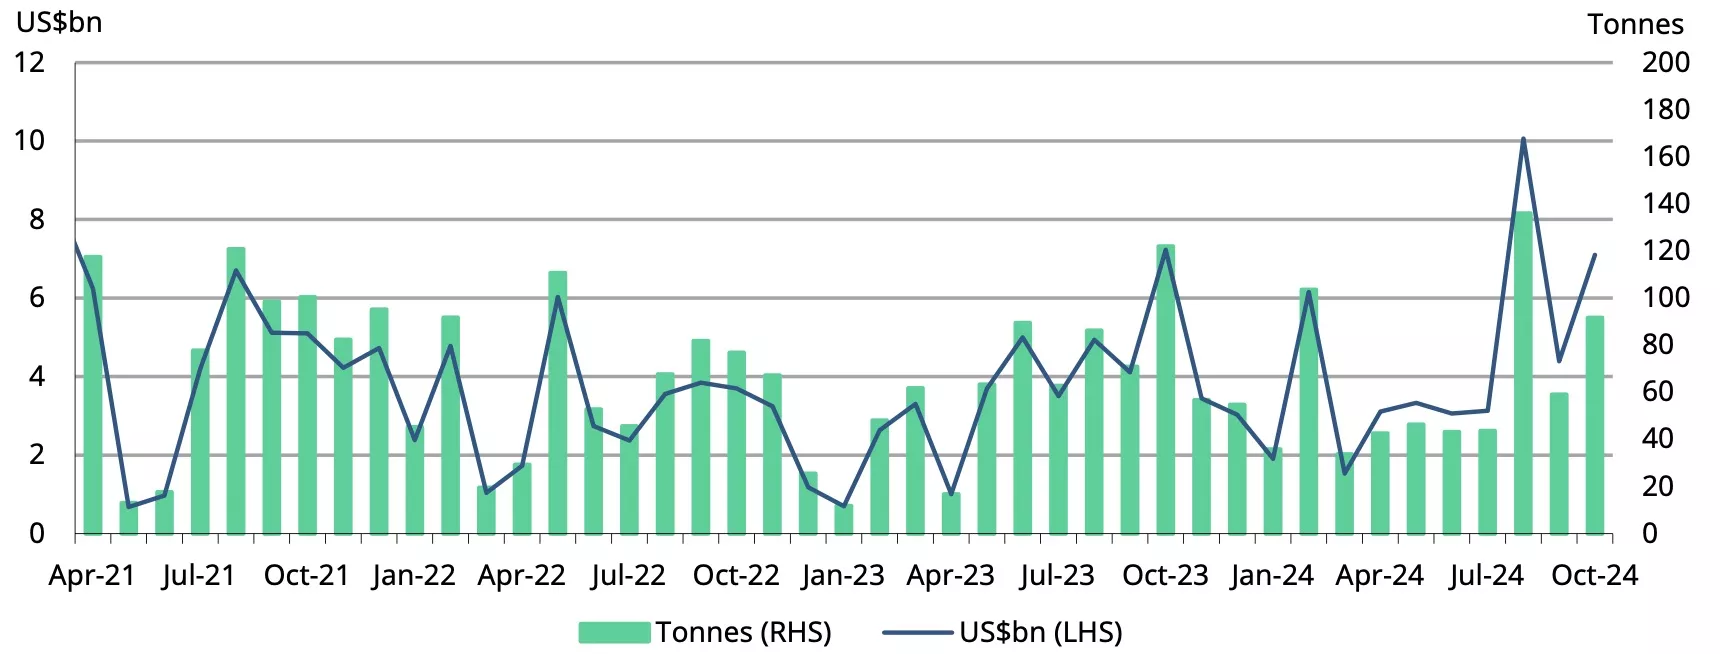
*As of 14 November2024. Includes World Gold Council estimates.
Source: Ministry of Commerce and Industry, CMIE, World Gold Council
Footnotes
1As of 1 November 2024.
2Based on LBMA Gold Price AM.
3Landed price.
4Premium or discount to international price is calculated as the difference between the landed price of gold (which is the international price adjusted for import taxes and exchange rate) and the domestic selling price.
5Dhanteras demand trumps metal price hike, The Telegraph, 8 November 2024.
6Jewellery firms cut making charges, weight to lift sales, The Mint, 23 October 2024.
7As prices jumps, gold buyers keep it light this Dhanteras, The Economic Times, 30 October 2024.
8Forex reserve data in the Weekly Statistical Supplement. This blog was updated on 17 December 2024 to reflect the correct increase in gold reserves (in tonnage terms) in November and year-to-date.
9Up until 1 November 2024.
10Half Yearly Report on Management of Foreign Exchange Reserves: April - September 2024.
