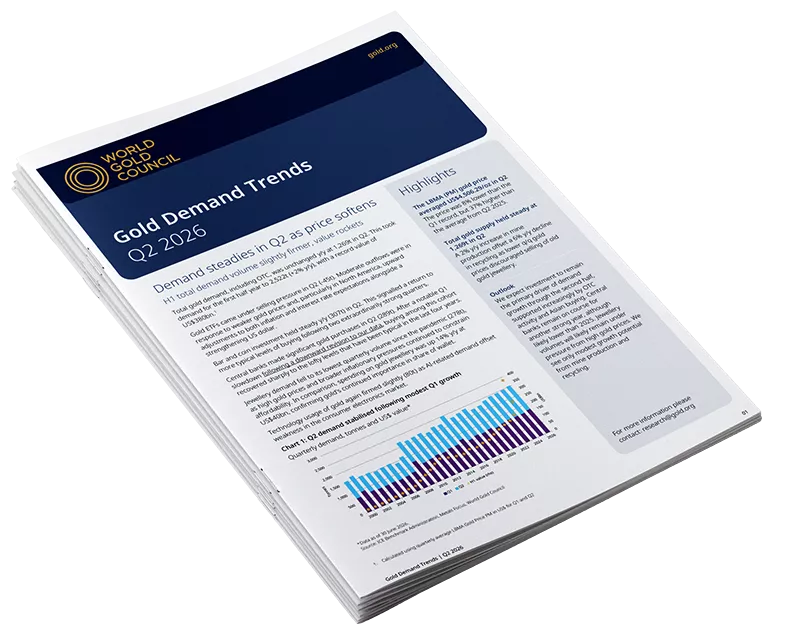
Gold Demand Trends: Q4 and Full Year 2025
Gold demand hit record levels in 2025. Total gold demand (including OTC) topped 5,000t during a year which saw 53 all-time highs in the gold price. Investment fuelled the gold market last year: safe haven and diversification motives drove huge ETF inflows and exceptional bar and coin buying.
Gold Demand Trends: US Focus Q4 and Full Year 2025
US gold demand more than doubled to 679t in 2025, driven almost entirely by strong investment demand in physically-gold‑backed ETFs. US‑listed ETFs added 437t of demand, pushing holdings to a record 2,019t (US$280bn AUM). Jewellery, technology, and bar‑and‑coin demand softened amid historically high gold prices, even as value‑based purchasing – particularly for jewellery – held relatively firm. Geopolitical uncertainty, rate expectations, and a weaker dollar supported strong investor appetite in 2025, reinforcing gold’s role as a strategic asset.
December caps off a record year
Global physically backed gold ETFs extended their inflow streak to seven months, adding US$10bn in December – all regions experienced inflows with North America (+US$6bn) and Asia (+US$2.5bn) taking the charge.
Asia takes the helm
Global physically backed gold ETFs saw inflows six months in a row, adding US$5.2bn in November. Asian investors (+US$3.2bn) bought the most whilst North America (+US$1.1bn) and Europe (US$978mn) also experienced positive flows. Persistent inflows and a rising gold price pushed global gold ETFs’ total AUM to another month-end peak of US$530bn, 5% higher m/m. Continued gold ETF buying also pushed their collective holdings to 3,932t, the highest month-end value on record.
Gold Outlook 2026: Push ahead or pull back
Gold has experienced a remarkable 2025, achieving over 50 all-time highs and returning more than 60% as of the end of November, driven by heightened risk, dollar weakness and price momentum.
Indonesia Consumer Insights Report: Gold for the Nation
Flows rise from Wall Street to the Bund
Global physically backed gold ETFs added US$8.2bn in October, the fifth consecutive monthly inflow. North America (+US$6.5bn) and Asia (US$+6.1bn) led global inflows, while European funds lost US$4.5bn, the only region with outflows in the month. Continued inflows and gold price strength lifted global gold ETFs’ total AUM 6% higher m/m to US$503bn, another month-end peak, and holdings climbed 1% m/m to 3,893t, 1% away from the record level of 3,929t.
US Gold Demand Trends Q3 2025
Overall gold demand in the US rebounded in the third quarter, in which demand of 186t grew 58% y/y. NA ETF inflows reached $16bn (137t) in Q3 and cumulative net inflows his US$37bn through September. Average daily trading volumes of US listed products grew 37% y/y in the quarter, and carried this momentum into October increasing 51% m/m to a new record of US$208bn (1,587t) per day.
