A new gold market outlook is available
Explore the key trends that we expect will influence gold's performance in 2021.
We believe that over the next six to twelve months:
-
Financial market uncertainty and accommodative monetary policy will likely support gold investment demand
-
Price momentum and positioning may fuel rallies and create pullbacks, as investors continuously reassess their expectations based on new information
-
Weaker economic growth may soften gold consumer demand near term, but structural economic reforms in India and China will likely support long-term demand.
Risk off, risk on
The first half of 2019 proved quite eventful for financial markets. Stocks retraced their Q4 2018 losses by the end of April only to pullback again in May.1 A few weeks later, stocks reached new highs yet again. At the same time, central banks across the globe have signalled a more accommodative stance, bringing global bond yields to multi-year – and in some countries, all-time – lows. As investors looked to balance higher stock prices with an increasingly uncertain environment, gold prices surged, making gold one of the best performing assets by the end of June (Chart 1).
Chart 1: Performance of major assets during Q4 2018 and YTD 2019*
Chart 1: Performance of major assets during Q4 2018 and YTD 2019*
Sources:
Bloomberg,
ICE Benchmark Administration,
World Gold Council; Disclaimer
*As of 30 June 2019. Returns based on the LBMA Gold Price, Bloomberg Barclays US Treasury Index and Global Treasury Index ex US, ICE BAML US 3-month T-bill Index, Bloomberg Barclays US Corporate and High Yield Indices, MSCI EM Index, Bloomberg Commodity TR Index, MSCI EAFE Index, S&P 500 & NASDAQ Indices, and Bloomberg Oil TR Index
And while gold’s price increase in June was particularly sharp – driven by falling rates, higher risk and momentum – investors have generally been more bullish this year. This is evidenced by the positive inflows in gold-backed ETFs, capturing US$5.0 billion or 108 tonnes (t) y-t-d led by European funds,2 – as well as higher net longs in COMEX futures which averaged 369t during the first half. In addition, central banks reported net purchases of approx. 247t, equivalent to US$10 billion, through May3 – continuing their expansion of gold holdings as part of foreign reserves.
Easy come, easy go
Global monetary policy has shifted by 180 degrees. Less than a year ago, both Federal Reserve (Fed) board members and US investors expected interest rates to continue to increase, at the very least through 2019. By December, the most likely outcome was for the Fed to remain on hold. Now, the market expects the Fed to cut rates two or three times before the end of the year. And while statements by board members, including Chairman Powell, are signalling a wait-and-see approach, the market has barely changed its forecast. The Fed may not do what the market asks, but it generally doesn’t like to surprise it either. In recent history, the Fed adjusted its funds rate in line with expectations whenever the market’s implied probability of such outcome was 65% or higher (Chart 2); the only notable exception was rate cut announced during an un-scheduled Federal Open Market Committee (FOMC) meeting in January 2008 when the global financial crisis began to unfold.
Chart 2: Fed policy has historically aligned with market expectations*
Chart 2: Fed policy action has historically aligned with market expectations*
Sources:
Bloomberg,
World Gold Council; Disclaimer
*Actual change in the Fed funds rate on the last day of every FOMC meeting between 1 January 2002 and 30 June 2019 compared to the corresponding implied probability, one day prior to each meeting, that the Fed will either cut or hike. Negative probabilities represent an expected cut, positive probabilities an expected hike. The probabilities, derived by Bloomberg, are based on Fed fund futures from 1 January 2015 onward and OIS before, due to data availability.
The Fed is not alone. The European Central Bank’s (ECB) President Draghi recently announced that they are ready to extend bond purchases or cut rates to sustain economic growth. The Bank of Japan (BOJ) is also expected to make policy more accommodative. And emerging market central banks are likely to follow suit.4
The prospect of lower interest rates should support gold investment demand. Our research indicates that the gold price was higher in the 12 months following the end of a tightening cycle.5 Moreover, historical gold returns are more than twice their long-term average during periods of negative real rates (Table 1) – like the one we are likely to see later this year. At the same time, the US dollar – usually a headwind for gold – may remain rangebound as trade tensions and lower rates offset continued economic growth.
Table 1: Gold performance in various real rate environments*
| |
|
Real rate environment |
| |
Long term |
Low (<0%) |
Moderate (0%-2.5%) |
High (>2.5%) |
| Monthly return |
0.6% |
1.2% |
1.0% |
-0.3% |
| Standard error |
0.2% |
0.4% |
0.4% |
0.3% |
| Different from 0? |
Yes |
Yes |
Yes |
No |
*Based on nominal gold returns between January 1971 and June 2019. Real rate regimes based on the 12-month constant maturity US T-bill minus the corresponding y-o-y CPI inflation. Difference from zero computed as a two-way T test at a 5% significance level.
Source: Bureau of Labor Statistics, Federal Reserve, ICE Benchmark Administration, World Gold Council; Disclaimer
Risks come in many flavours
Central banks are not acting in a vacuum. Instead, they stand ready to stimulate their respective economies should risks bubble up and a more significant global slowdown occur. These risks include:
- The potential negative long-term effect of higher tariffs amidst trade tensions between the US and its trade partners
- Geopolitical tensions between the US and Iran
- Uncertainty surrounding Brexit and other political and economic concerns in the UK and Europe
In addition, low interest rates are having the perverse effect of fuelling a decade-long stock market rally with only temporary pullbacks. This has pushed stock valuations to levels not seen since the dot-com bubble (Chart 3). Worryingly, in the event of a recession, central banks – including the Fed – may not be able to rely on cutting interest rates. Instead, they may need to use quantitative easing and, possibly, new non-traditional measures to reinvigorate the global economy.
Chart 3: Stock price valuations and long-term interest rates*
Chart 3: Stock price valuations and long-term interest rates*
Sources:
Bloomberg,
Robert J. Schiller,
World Gold Council; Disclaimer
*As of 30 June 2019. Based on Yale Prof. Robert Shiller's research. The P/E 10 ratio is calculated by: 1) taking the annual earnings per share (EPS) of the S&P 500 for the past 10 years; 2) adjusting EPS for inflation using US CPI; 3) taking the average of the real EPS figures over the 10-year period; and 4) dividing the current level of the S&P 500 by the 10-year average EPS number to obtain the cyclically-adjusted P/E (CAPE) ratio.
Investors are facing a conundrum. Traditionally, bond holdings provide diversification and hedge their stock market investments. But both high- and low-quality bonds are expensive as yields have generally fallen and credit spreads compressed since 2011. In fact, more than US$13 trillion of global debt is currently trading with nominal negative yields.6 And our analysis shows that 70% of all developed market debt is trading with real negative yields with the remaining 30% close to or below 1% (Chart 4).
Against this backdrop, alternative high quality, liquid assets such as gold may help investors balance risks more effectively, while providing uncorrelated long-term returns.
Chart 4: A large portion of sovereign debt now carries negative real interest rates*
Chart 4: A large portion of sovereign debt now carries negative real interest rates*
Sources:
Bloomberg,
World Gold Council; Disclaimer
*As of 30 June 2019. Includes sovereign debt from Australia, Canada, Denmark, Euro area (investment grade), Japan, Sweden, Switzerland, the United Kingdom and the United States. Real yields computed as nominal yield minus the most recently available y-o-y CPI inflation rate. Totals may not equal 100% due to rounding.
Mixed EM demand
Weaker economic growth and the possible impact of higher gold price volatility may result in softer consumer demand this year, especially in emerging markets that make up the lion share of annual demand.7 In addition, we estimate that the recent announcement of a 2.5% increase to gold’s import duty by the Indian Ministry of Finance may result in a reduction to 2019 demand of approx. 2.4%.8 And that, if the higher levy were to become permanent, it could reduce long-term Indian consumer demand by slightly less than 1% per year.9 However, we believe that the broad structural economic reforms being implemented in both India and China will likely support long-term gold demand.
In addition, we expect central bank gold demand – led by emerging markets – to remain positive for the foreseeable future.
It’s all connected
Contrary to popular belief, gold’s performance is well explained by its supply and demand dynamics (see Appendix).
Gold demand is linked to jewellery, technology and long-term savings, and these are important determinants of long-term performance. In the short and medium term their impact is felt predominantly when there are significant changes to demand. Conversely, gold investment demand amidst higher uncertainty – including speculative activity – can sway prices in a meaningful way in the short and medium term but its effects level off in the long run. In addition, gold supply through mining or recycling bring balance to the market.
As we look forward to the rest of the year, we believe that consumer demand may be soft and speculative activity could amplify price movements but, overall, it is likely that investment demand will remain robust and central banks will continue their net purchasing trend.
Appendix
Drivers of gold and its role in portfolios
There are four attributes that make gold a valuable strategic asset,10 by providing investors with:
- a source of return
- low correlation to major asset classes in both expansionary and recessionary periods
- a mainstream asset that is as liquid as other financial securities
- a history of improved portfolio risk-adjusted returns.
These attributes are by-products of the dual nature of gold as a consumer good and an investment (Chart 5).
Gold demand and price performance, in turn, respond to four broad set of drivers:
- Economic expansion: periods of growth are very supportive of jewellery, technology and long-term savings
- Risk and uncertainty: market downturns often boost investment demand for gold as a safe haven
- Opportunity cost: the price of competing assets, such as bonds (through interest rates), currencies and other assets, influence investor attitudes towards gold
- Momentum: capital flows, positioning and price trends can ignite or dampen gold's performance.
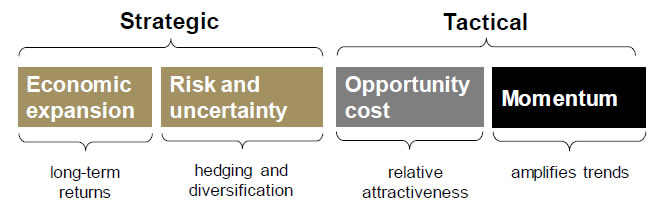
Chart 5: Gold is bought as a luxury good, a component in high-end electronics, a safe-haven investment or a portfolio diversifier
Chart 5a: Gold is bought as a luxury good, a component in high-end electronics, a safe-haven investment or a portfolio diversifier
(a) 10-year average gold demand by source*
Sources:
ETF company filings,
Metals Focus,
Refinitiv GFMS,
World Gold Council; Disclaimer
*Computed using annual demand from 2009 to 2018. Regional breakdown excludes central bank demand due to data availability.
Chart 5b: Gold is bought as a luxury good, a component in high-end electronics, a safe-haven investment or a portfolio diversifier
(b) 10-year average gold demand by region*
Sources:
ETF company filings,
Metals Focus,
Refinitiv GFMS,
World Gold Council; Disclaimer
*Computed using annual demand from 2009 to 2018. Regional breakdown excludes central bank demand due to data availability.
Sources: ETF company filings, Metals Focus, Refinitiv GFMS, World Gold Council; Disclaimer
*Computed using annual demand from 2009 to 2018. Regional breakdown excludes central bank demand due to data availability.
Copyright and other rights
© 2019 World Gold Council. All rights reserved. World Gold Council and the Circle device are trademarks of the World Gold Council or its affiliates.
All references to LBMA Gold Price are used with the permission of ICE Benchmark Administration Limited and have been provided for informational purposes only. ICE Benchmark Administration Limited accepts no liability or responsibility for the accuracy of the prices or the underlying product to which the prices may be referenced. Other third-party content is the intellectual property of the respective third party and all rights are reserved to them. Metals Focus is an affiliate of World Gold Council
Reproduction or redistribution of any of this information is expressly prohibited without the prior written consent of World Gold Council or the appropriate copyright owners, except as specifically provided below.
The use of the statistics in this information is permitted for the purposes of review and commentary (including media commentary) in line with fair industry practice, subject to the following two pre-conditions: (i) only limited extracts of data or analysis be used; and (ii) any and all use of these statistics is accompanied by a citation to World Gold Council and, where appropriate, to Metals Focus or other identified third-party source, as their source.
World Gold Council does not guarantee the accuracy or completeness of any information. World Gold Council does not accept responsibility for any losses or damages arising directly or indirectly from the use of this information.
This information is not a recommendation or an offer for the purchase or sale of gold, any gold-related products or services or any other products, services, securities or financial instruments (collectively, “Services”). Investors should discuss their individual circumstances with their appropriate investment professionals before making any decision regarding any Services or investments.
This information contains forward-looking statements, such as statements which use the words “believes”, “expects”, “may”, or “suggests”, or similar terminology, which are based on current expectations and are subject to change. Forward-looking statements involve a number of risks and uncertainties. There can be no assurance that any forward-looking statements will be achieved. We assume no responsibility for updating any forward-looking statements.