Unearthed: Gold Nanoparticles Under the Microscope ft. Dr. Laura Fabris
Unearthed Podcast
World Gold CouncilIn this episode, hosts John Reade and Joe Cavatoni speak with Dr. Laura Fabris about the fascinating world of gold nanoparticles. Laura explains what gold nanoparticles are and their significant role in modern life. She shares her journey into working with gold and how it has influenced her career.
The discussion highlights the impact of her research on healthcare, particularly in medical applications of gold nanoparticles. Laura addresses the critical energy transition challenge, exploring how gold nanoparticles could contribute. She also shares insights into the future advancements and potential breakthroughs in the field of gold nanoparticles.
Disclaimer
Important information and disclaimers
© 2025 World Gold Council. All rights reserved. World Gold Council and the Circle device are trademarks of the World Gold Council or its affiliates.
All references to LBMA Gold Price are used with the permission of ICE Benchmark Administration Limited and have been provided for informational purposes only. ICE Benchmark Administration Limited accepts no liability or responsibility for the accuracy of the prices or the underlying product to which the prices may be referenced. Other content is the intellectual property of the respective third party and all rights are reserved to them.
Reproduction or redistribution of any of this information is expressly prohibited without the prior written consent of World Gold Council or the appropriate copyright owners, except as specifically provided below. Information and statistics are copyright © and/or other intellectual property of the World Gold Council or its affiliates or third-party providers identified herein. All rights of the respective owners are reserved.
The use of the statistics in this information is permitted for the purposes of review and commentary (including media commentary) in line with fair industry practice, subject to the following two pre-conditions: (i) only limited extracts of data or analysis be used; and (ii) any and all use of these statistics is accompanied by a citation to World Gold Council and, where appropriate, to Metals Focus or other identified copyright owners as their source. World Gold Council is affiliated with Metals Focus.
The World Gold Council and its affiliates do not guarantee the accuracy or completeness of any information nor accept responsibility for any losses or damages arising directly or indirectly from the use of this information.
This information is for educational purposes only and by receiving this information, you agree with its intended purpose. Nothing contained herein is intended to constitute a recommendation, investment advice, or offer for the purchase or sale of gold, any gold-related products or services or any other products, services, securities or financial instruments (collectively, “Services”). This information does not take into account any investment objectives, financial situation or particular needs of any particular person.
Diversification does not guarantee any investment returns and does not eliminate the risk of loss. Past performance is not necessarily indicative of future results. The resulting performance of any investment outcomes that can be generated through allocation to gold are hypothetical in nature, may not reflect actual investment results and are not guarantees of future results. The World Gold Council and its affiliates do not guarantee or warranty any calculations and models used in any hypothetical portfolios or any outcomes resulting from any such use. Investors should discuss their individual circumstances with their appropriate investment professionals before making any decision regarding any Services or investments.
This information may contain forward-looking statements, such as statements which use the words “believes”, “expects”, “may”, or “suggests”, or similar terminology, which are based on current expectations and are subject to change. Forward-looking statements involve a number of risks and uncertainties. There can be no assurance that any forward-looking statements will be achieved. World Gold Council and its affiliates assume no responsibility for updating any forward-looking statements.
Information regarding QaurumSM and the Gold Valuation Framework
Note that the resulting performance of various investment outcomes that can be generated through use of Qaurum, the Gold Valuation Framework and other information are hypothetical in nature, may not reflect actual investment results and are not guarantees of future results. Neither World Gold Council (including its affiliates) nor Oxford Economics provides any warranty or guarantee regarding the functionality of the tool, including without limitation any projections, estimates or calculations.
India’s gold market update: Gold market broadens; expansion in physical and financial holdings
Kavita Chacko
Research Head, India World Gold CouncilHighlights:
- Domestic gold price tracks the upward trend in international prices
- Consumer demand stabilises but maintains strength; festive season momentum key
- Premium of domestic gold prices over landed cost shrinks
- The Reserve Bank of India (RBI) has added 50t to its gold reserves so far this year
- Streak of fund inflows into Indian gold ETFs continues, with highest monthly inflows on record in August
- Gold imports hit a new high in August
Looking ahead:
- Momentum in gold jewellery buying and investment expected to continue; rural buying to provide impetus.
Domestic gold price moves in tandem with international price
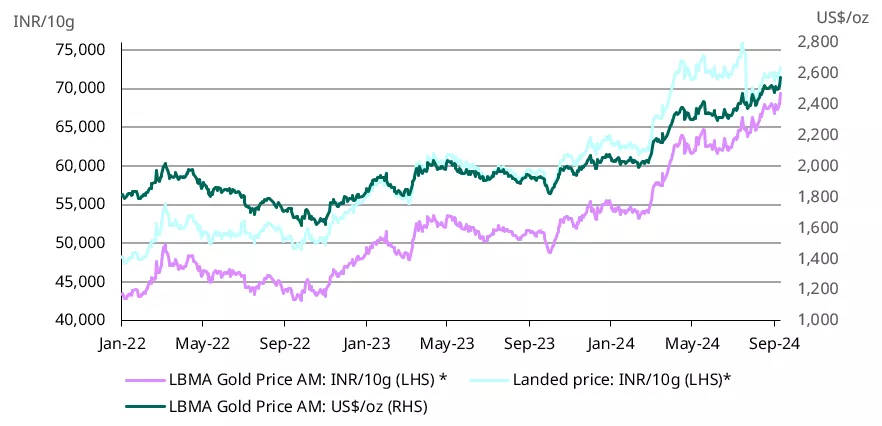
Gold experienced strong gains in August, with international prices rising 3.7% and domestic prices by 3.9%, driven by expectation of easing interest rates in the US and the resultant drop in the US dollar. Gold’s strength was extended to September; the international and domestic price has increased by 2.8% and 1.6% respectively, at the time of writing.
Despite these gains, domestic prices remain 2% below their levels before the Union Budget announcement (on 23 July), due to the 9% reduction in import duty.
Chart 1: Domestic gold price mirrors rise in international price
LBMA Price AM and domestic landed price by month, US$ and INR*
Gold demand stabilises and remains strong; festive season momentum key
Following an initial surge in consumer demand (for jewellery and bars and coins) due to the sharp import duty cut, demand is reported to have since normalised. However, market reports indicate that overall buying momentum remains healthy, with an uptick compared to the period before the import duty reduction. Purchases previously deferred are now materialising, and there is increased interest in heavier pieces of jewellery. Industry participants anticipate that this momentum will continue, though they are closely monitoring the crucial festive and wedding season sales that run through late August to December. Media and market reports indicate that festive buying has started on a strong note.1
Rural consumption demand has been showing signs of improvement and given the favourable monsoons and higher crop sowing this year, economic conditions there are expected to improve. This could lead to increased gold buying interest, particularly during the ongoing festive period.
Domestic gold price spread narrows
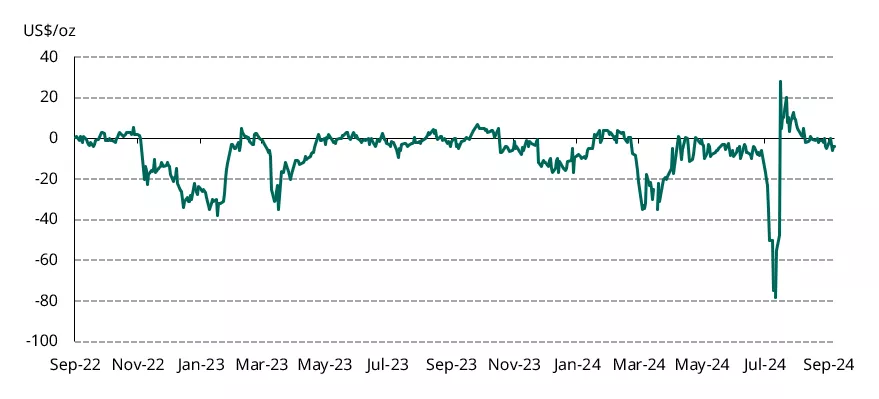
The rise in international gold prices, combined with increased supply from higher imports has led to a narrowing of the spread between domestic and international gold prices. Following the import duty cut announced on 23 July, domestic gold prices initially traded at a premium 2 of US$5-US$28/oz over international prices from late July to mid-August. Wholesalers and bullion dealers, facing losses on inventory purchased under higher import duties, increased their prices up to offset these losses. However, a strong initial spurt in consumer demand enabled adjustment in inventory valuations. In recent weeks, amid the normalising, but still healthy demand, domestic gold prices have been trading either at a slight discount to or in line with international prices.
Chart 2: Premium on domestic gold prices declines
NCDEX gold premium/discount relative to international price*
Indian ETFs enjoy stream of inflows
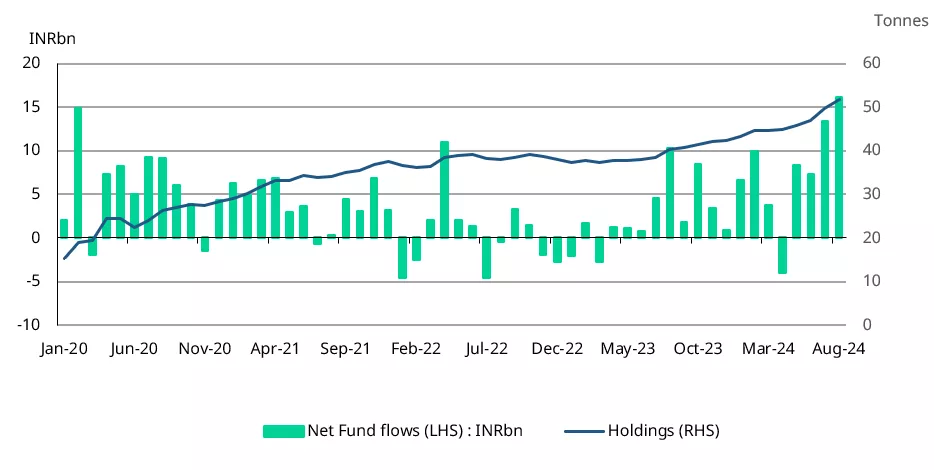
Since the end of July, Indian gold ETFs have seen a surge in investor interest. The import duty cut and the changes to the long-term capital gains for gold ETFs announced in the Union Budget have been factors behind the increased inflows into gold ETFs. Our initial estimates based on partial information pointed to another positive month for Indian funds. And according to the Association of Mutual Funds (AMFI), August saw record gross fund inflows of INR 21bn (~US$238mn),3 significantly higher than the average monthly (gross) inflows of INR8bn during H12024. Net inflows for the month also reached a record INR16bn (~US$192mn).
As of the end of August, the total assets under management (AUM) for Indian gold ETFs, as reported by AMFI have increased to INR374bn(~US$4.4bn), marking an 8% m/m rise and 54% y/y increase. So far in 2024,4 net inflows into Indian gold ETFs have amounted to INR61bn(~US$735mn), a significant increase from INR15bn in the same period last year, according to AMFI data. These funds have collectively added 9.5t of gold this year, bringing their total gold holdings to 51.8t, which represents a 29% y/y increase.
The steady inflow into Indian gold ETFs reflects a global trend of expanding investments in gold ETFs, driven by lower opportunity cost, strong gold price performance, and safe haven demand.
Chart 3: Indian gold ETFs keep drawing inflows
Monthly gold ETF fund flows in INRbn and total holdings in tonnes*
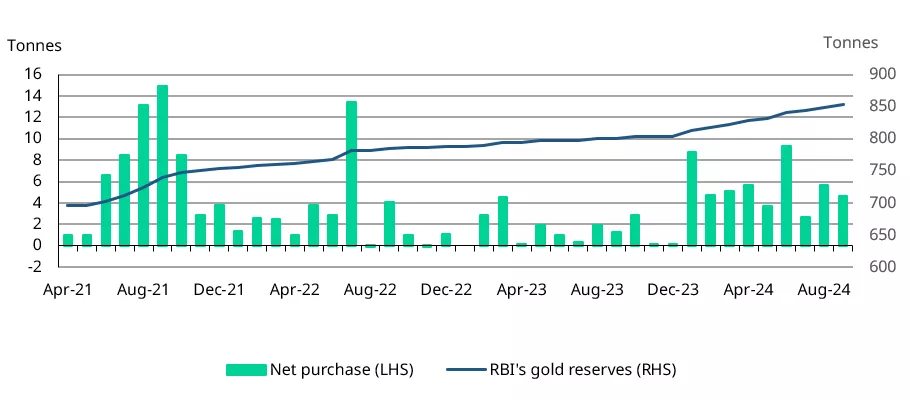
RBI’s steady gold accumulation
The Reserve Bank of India’s demand for gold remains strong, as evidenced from its recent purchases. According to RBI data and our estimates, the central bank acquired a total of 10.3t of gold over the six weeks leading up to 6 September.5 Over the first eight months of the year, the RBI has purchased a total of 50t of gold, with acquisitions in each month. This accumulation significantly surpasses the net purchases of 2022 and 2023.6 The RBI has emerged as a leading gold buyer this year.
The RBI’s gold reserves have now reached a record 853.6t, accounting for 9% of its total foreign reserves, up from 7.5% a year ago.
Chart 4: Sustained expansion of RBI’s gold holdings
RBI’s monthly net purchases and reserves; in tonnes*
Record surge in gold imports
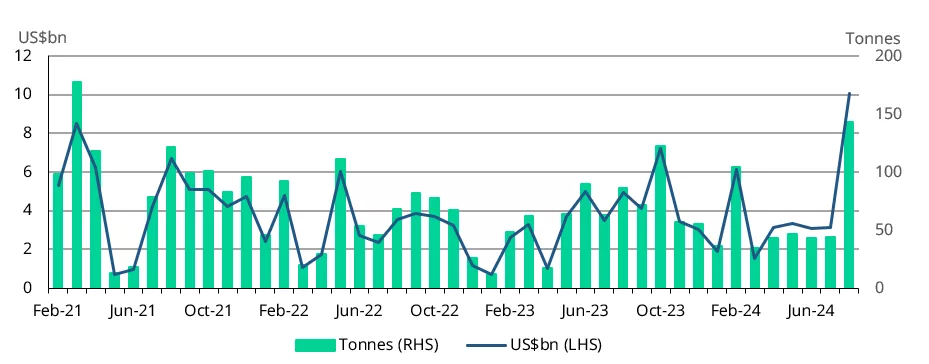
August saw a new record for gold imports, totaling US$10.1bn. This represents over a threefold increase compared to the previous month and double the value from a year ago. Our estimates suggest that in volume terms, imports for the month were approximately 140t, a more than threefold increase from the previous month. This surge can be attributed to the reduction in import duties announced towards the end of July and increased seasonal demand for gold ahead of the festive period. For the period from January to August, gold imports have risen by 30% y/y, reaching US$32bn.
Chart 5: New record for gold imports
Monthly gold imports; in tonnes and US$bn*
Footnotes
1Mumbaikars buy 55 kg gold to offer to Ganpati, Economic Times, 10 September,2024.
2Premium or discount to international price is calculated as the difference between the landed price of gold (which is the international price adjusted for import taxes and exchange rate) and the domestic selling price.
3The AUM and fund flow figures published by AMFI include most but not all inter-scheme investments. As such, provisional fund flow estimates from the World Gold Council may differ from that reported by AMFI.
4January to August.
5As per RBI data on 13 September 2024.
6RBI’s net gold purchase in 2022 was 33t and 16t in 2023.
Unearthed: How Rate Cuts and Policy Decisions Will Impact Gold Markets
Unearthed Podcast
World Gold CouncilIn this special episode of "Unearthed", John Reade and Joe Cavatoni from the World Gold Council discuss the 50 basis point interest rate cut by the U.S. Federal Reserve and its impact on the gold market.
They emphasize that the direction toward lower rates is crucial, as it reduces barriers for Western investment in gold. They anticipate further, more measured rate cuts, which should support gold in the medium to long term.
Disclaimer
Important information and disclaimers
© 2025 World Gold Council. All rights reserved. World Gold Council and the Circle device are trademarks of the World Gold Council or its affiliates.
All references to LBMA Gold Price are used with the permission of ICE Benchmark Administration Limited and have been provided for informational purposes only. ICE Benchmark Administration Limited accepts no liability or responsibility for the accuracy of the prices or the underlying product to which the prices may be referenced. Other content is the intellectual property of the respective third party and all rights are reserved to them.
Reproduction or redistribution of any of this information is expressly prohibited without the prior written consent of World Gold Council or the appropriate copyright owners, except as specifically provided below. Information and statistics are copyright © and/or other intellectual property of the World Gold Council or its affiliates or third-party providers identified herein. All rights of the respective owners are reserved.
The use of the statistics in this information is permitted for the purposes of review and commentary (including media commentary) in line with fair industry practice, subject to the following two pre-conditions: (i) only limited extracts of data or analysis be used; and (ii) any and all use of these statistics is accompanied by a citation to World Gold Council and, where appropriate, to Metals Focus or other identified copyright owners as their source. World Gold Council is affiliated with Metals Focus.
The World Gold Council and its affiliates do not guarantee the accuracy or completeness of any information nor accept responsibility for any losses or damages arising directly or indirectly from the use of this information.
This information is for educational purposes only and by receiving this information, you agree with its intended purpose. Nothing contained herein is intended to constitute a recommendation, investment advice, or offer for the purchase or sale of gold, any gold-related products or services or any other products, services, securities or financial instruments (collectively, “Services”). This information does not take into account any investment objectives, financial situation or particular needs of any particular person.
Diversification does not guarantee any investment returns and does not eliminate the risk of loss. Past performance is not necessarily indicative of future results. The resulting performance of any investment outcomes that can be generated through allocation to gold are hypothetical in nature, may not reflect actual investment results and are not guarantees of future results. The World Gold Council and its affiliates do not guarantee or warranty any calculations and models used in any hypothetical portfolios or any outcomes resulting from any such use. Investors should discuss their individual circumstances with their appropriate investment professionals before making any decision regarding any Services or investments.
This information may contain forward-looking statements, such as statements which use the words “believes”, “expects”, “may”, or “suggests”, or similar terminology, which are based on current expectations and are subject to change. Forward-looking statements involve a number of risks and uncertainties. There can be no assurance that any forward-looking statements will be achieved. World Gold Council and its affiliates assume no responsibility for updating any forward-looking statements.
Information regarding QaurumSM and the Gold Valuation Framework
Note that the resulting performance of various investment outcomes that can be generated through use of Qaurum, the Gold Valuation Framework and other information are hypothetical in nature, may not reflect actual investment results and are not guarantees of future results. Neither World Gold Council (including its affiliates) nor Oxford Economics provides any warranty or guarantee regarding the functionality of the tool, including without limitation any projections, estimates or calculations.
Unearthed: Refining, Minting and More ft. Lorne Whitmore, Royal Canadian Mint
Unearthed Podcast
World Gold CouncilIn this episode, hosts John Reade and Joe Cavatoni from the World Gold Council interview Lorne Whitmore, Managing Director Sales, Precious Metal Products and Services, Royal Canadian Mint, to discuss the comprehensive products and services that the Royal Canadian Mint provides across mining and refining, minting and vaulting.
Whitmore dives into how the Royal Canadian Mint supports each facet of the supply chain and shares some of the key trends that are currently impacting its client base regarding demand for precious metals.
He concludes the conversation by showcasing examples of the types of physical bullion in which one can invest.
Disclaimer
Important information and disclaimers
© 2025 World Gold Council. All rights reserved. World Gold Council and the Circle device are trademarks of the World Gold Council or its affiliates.
All references to LBMA Gold Price are used with the permission of ICE Benchmark Administration Limited and have been provided for informational purposes only. ICE Benchmark Administration Limited accepts no liability or responsibility for the accuracy of the prices or the underlying product to which the prices may be referenced. Other content is the intellectual property of the respective third party and all rights are reserved to them.
Reproduction or redistribution of any of this information is expressly prohibited without the prior written consent of World Gold Council or the appropriate copyright owners, except as specifically provided below. Information and statistics are copyright © and/or other intellectual property of the World Gold Council or its affiliates or third-party providers identified herein. All rights of the respective owners are reserved.
The use of the statistics in this information is permitted for the purposes of review and commentary (including media commentary) in line with fair industry practice, subject to the following two pre-conditions: (i) only limited extracts of data or analysis be used; and (ii) any and all use of these statistics is accompanied by a citation to World Gold Council and, where appropriate, to Metals Focus or other identified copyright owners as their source. World Gold Council is affiliated with Metals Focus.
The World Gold Council and its affiliates do not guarantee the accuracy or completeness of any information nor accept responsibility for any losses or damages arising directly or indirectly from the use of this information.
This information is for educational purposes only and by receiving this information, you agree with its intended purpose. Nothing contained herein is intended to constitute a recommendation, investment advice, or offer for the purchase or sale of gold, any gold-related products or services or any other products, services, securities or financial instruments (collectively, “Services”). This information does not take into account any investment objectives, financial situation or particular needs of any particular person.
Diversification does not guarantee any investment returns and does not eliminate the risk of loss. Past performance is not necessarily indicative of future results. The resulting performance of any investment outcomes that can be generated through allocation to gold are hypothetical in nature, may not reflect actual investment results and are not guarantees of future results. The World Gold Council and its affiliates do not guarantee or warranty any calculations and models used in any hypothetical portfolios or any outcomes resulting from any such use. Investors should discuss their individual circumstances with their appropriate investment professionals before making any decision regarding any Services or investments.
This information may contain forward-looking statements, such as statements which use the words “believes”, “expects”, “may”, or “suggests”, or similar terminology, which are based on current expectations and are subject to change. Forward-looking statements involve a number of risks and uncertainties. There can be no assurance that any forward-looking statements will be achieved. World Gold Council and its affiliates assume no responsibility for updating any forward-looking statements.
Information regarding QaurumSM and the Gold Valuation Framework
Note that the resulting performance of various investment outcomes that can be generated through use of Qaurum, the Gold Valuation Framework and other information are hypothetical in nature, may not reflect actual investment results and are not guarantees of future results. Neither World Gold Council (including its affiliates) nor Oxford Economics provides any warranty or guarantee regarding the functionality of the tool, including without limitation any projections, estimates or calculations.
Unearthed: Gold Prices Respond to U.S. Unemployment and Rate Cut Cycle
Unearthed Podcast
World Gold CouncilIn this episode of "Unearthed," John and Joe discuss the recent U.S. Nonfarm Payrolls report and its impact on the gold market. The stronger-than-expected employment data has shifted expectations around Federal Reserve rate cuts, leading to a dip in gold prices. While Western investors are adjusting expectations for future rate cuts, China’s market absence also influenced gold prices this week.
Despite some corrections, overall sentiment towards gold remains strong, driven in part by rising inflows into ETFs. Many investors are looking to buy on dips, but with limited opportunities for lower prices, gold continues to be a sought-after asset for risk mitigation and diversification.
Disclaimer
Important information and disclaimers
© 2025 World Gold Council. All rights reserved. World Gold Council and the Circle device are trademarks of the World Gold Council or its affiliates.
All references to LBMA Gold Price are used with the permission of ICE Benchmark Administration Limited and have been provided for informational purposes only. ICE Benchmark Administration Limited accepts no liability or responsibility for the accuracy of the prices or the underlying product to which the prices may be referenced. Other content is the intellectual property of the respective third party and all rights are reserved to them.
Reproduction or redistribution of any of this information is expressly prohibited without the prior written consent of World Gold Council or the appropriate copyright owners, except as specifically provided below. Information and statistics are copyright © and/or other intellectual property of the World Gold Council or its affiliates or third-party providers identified herein. All rights of the respective owners are reserved.
The use of the statistics in this information is permitted for the purposes of review and commentary (including media commentary) in line with fair industry practice, subject to the following two pre-conditions: (i) only limited extracts of data or analysis be used; and (ii) any and all use of these statistics is accompanied by a citation to World Gold Council and, where appropriate, to Metals Focus or other identified copyright owners as their source. World Gold Council is affiliated with Metals Focus.
The World Gold Council and its affiliates do not guarantee the accuracy or completeness of any information nor accept responsibility for any losses or damages arising directly or indirectly from the use of this information.
This information is for educational purposes only and by receiving this information, you agree with its intended purpose. Nothing contained herein is intended to constitute a recommendation, investment advice, or offer for the purchase or sale of gold, any gold-related products or services or any other products, services, securities or financial instruments (collectively, “Services”). This information does not take into account any investment objectives, financial situation or particular needs of any particular person.
Diversification does not guarantee any investment returns and does not eliminate the risk of loss. Past performance is not necessarily indicative of future results. The resulting performance of any investment outcomes that can be generated through allocation to gold are hypothetical in nature, may not reflect actual investment results and are not guarantees of future results. The World Gold Council and its affiliates do not guarantee or warranty any calculations and models used in any hypothetical portfolios or any outcomes resulting from any such use. Investors should discuss their individual circumstances with their appropriate investment professionals before making any decision regarding any Services or investments.
This information may contain forward-looking statements, such as statements which use the words “believes”, “expects”, “may”, or “suggests”, or similar terminology, which are based on current expectations and are subject to change. Forward-looking statements involve a number of risks and uncertainties. There can be no assurance that any forward-looking statements will be achieved. World Gold Council and its affiliates assume no responsibility for updating any forward-looking statements.
Information regarding QaurumSM and the Gold Valuation Framework
Note that the resulting performance of various investment outcomes that can be generated through use of Qaurum, the Gold Valuation Framework and other information are hypothetical in nature, may not reflect actual investment results and are not guarantees of future results. Neither World Gold Council (including its affiliates) nor Oxford Economics provides any warranty or guarantee regarding the functionality of the tool, including without limitation any projections, estimates or calculations.
China’s gold market in September: demand rebounds seasonally, further strength may lie ahead
Ray Jia
Head of Research (Asia Pacific, ex-India) and Deputy Head of Trade Engagement (China) World Gold CouncilKey highlights:
- Gold kept surging: the LBMA Gold Price AM in USD and the Shanghai Gold Benchmark PM (SHAUPM) in RMB rose by 5.0% and 3.7% respectively in September, both ending Q3 with sizable gains
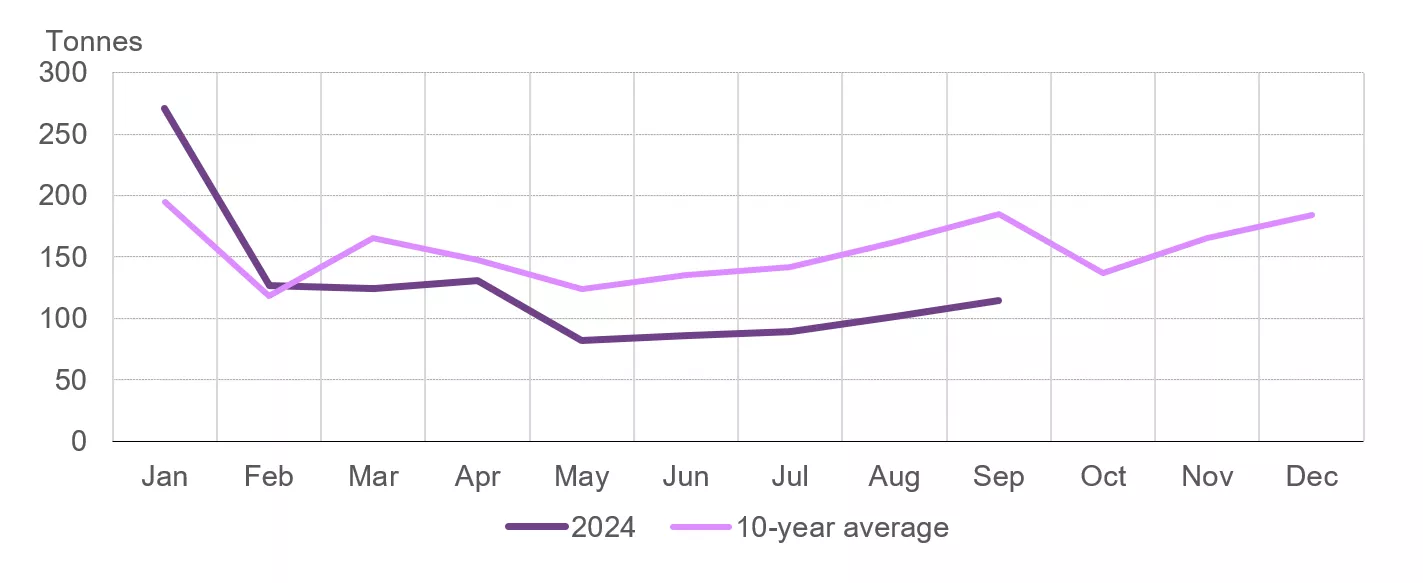
- The industry withdrew 118t gold from the Shanghai Gold Exchange (SGE) during September, an 11% m/m seasonal rebound amid active replenishment from jewellers in preparation for the expected sales boost during the early October National Day Holiday. Yet total withdrawals remain 18% below the 10-year average. Y-t-d, wholesale demand totalled 1,128t, an 11% y/y fall
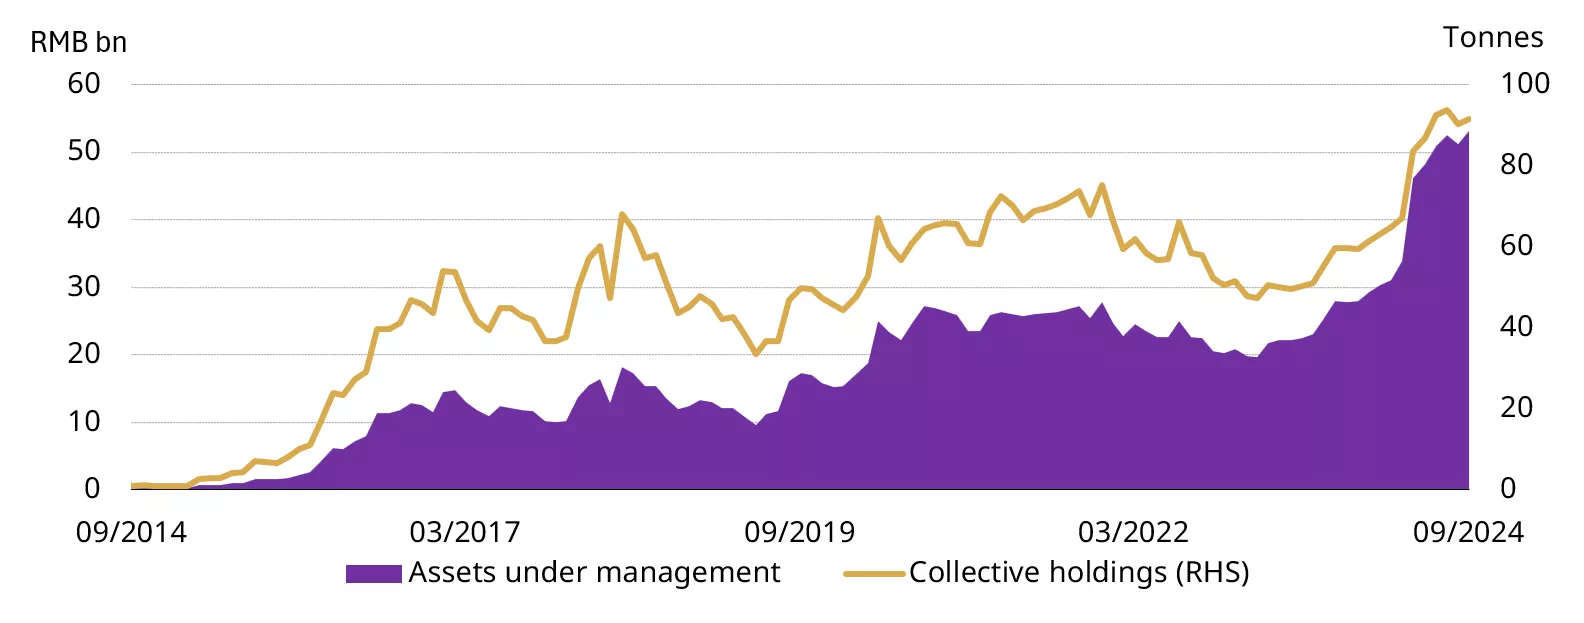
- Chinese gold ETF flows flipped positive in September, attracting RMB794mn (+US$110mn, +1.2t) amid the strong local gold price performance and pushing their total assets under management (AUM) to RMB53bn (US$7.8bn, 91.4t). Chinese gold ETF inflows have piled up to RMB16bn (+US$2.3bn, +30t) y-t-d, leading all other countries
- In contrast, volumes of gold futures at the Shanghai Futures Exchange (SHFE) declined by 25% m/m as the strong equity market performance and falling RMB gold price volatility likely distracted gold investors.
Looking ahead
- As Q4 arrives – the peak season for gold consumption – we expect gold demand to improve. And as the government’s aggressive stimulus package gradually unfolds and the potential of further fiscal support lies ahead,1 we believe an uplift in consumer confidence and disposable income should help support gold jewellery consumption.
- But on the other hand, as investor risk appetite picks up, investment demand for gold may slow.
Our upcoming report provides detailed analysis of the Chinese stimulus’ impacts on local gold demand in the future. Stay tuned!
Gold surged to another record high in September (Chart 1). Lower US Treasury yields and a weakening dollar – the Fed’s rate cut was larger than expected and investors anticipate further reductions – along with rising geopolitical tensions in the Middle East lifted gold prices. But due to a rapid appreciation in the RMB, driven by dollar weakness and an improved Chinese economic outlook, the SHAUPM in RMB saw limited gains relative to its USD peer.
Chart 1: Gold prices saw notable rises in September
Monthly changes of SHAUPM and LBMA Gold Price AM*
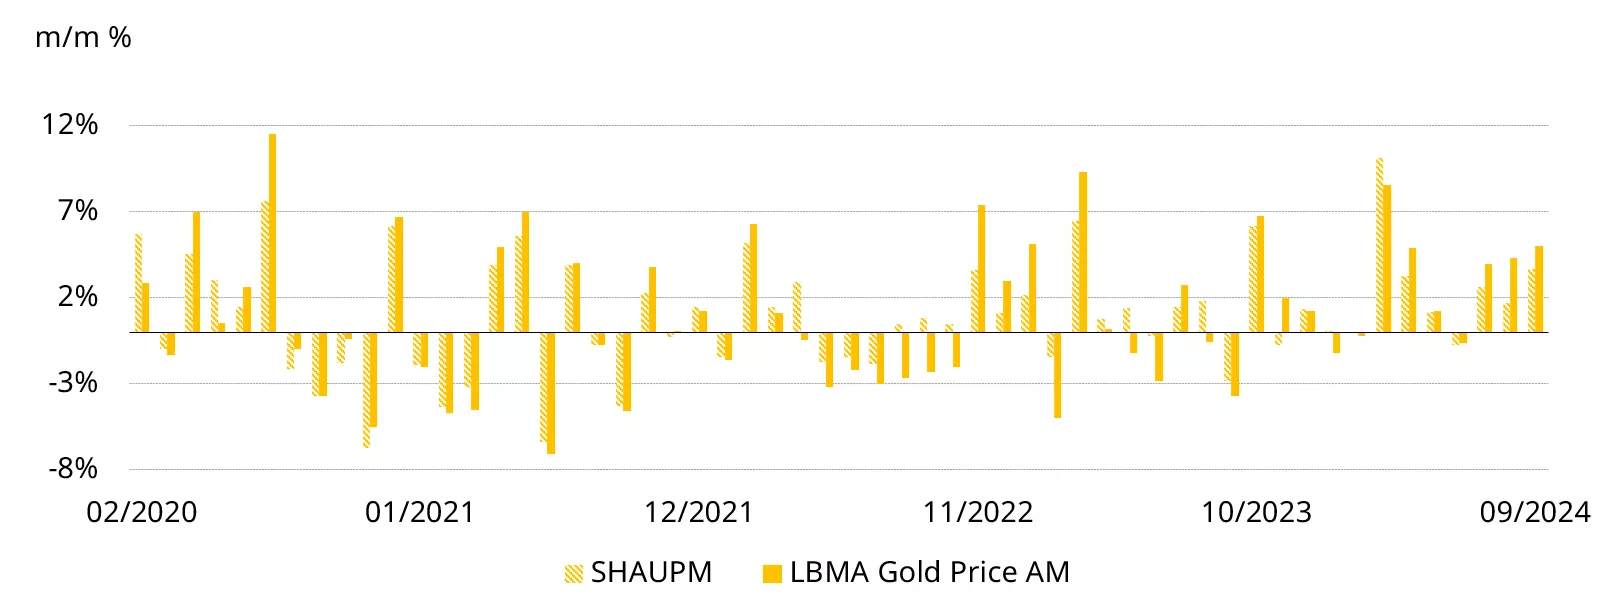
*Note: We compare the LBMA Gold Price AM to SHAUPM because the trading windows used to determine them are closer to each other than those for the LBMA Gold Price PM. For more information about Shanghai Gold Benchmark Prices please visit Shanghai Gold Exchange.
Source: Bloomberg, Shanghai Gold Exchange, World Gold Council
Chart 2: Gold has outperformed major assets so far in 2024*
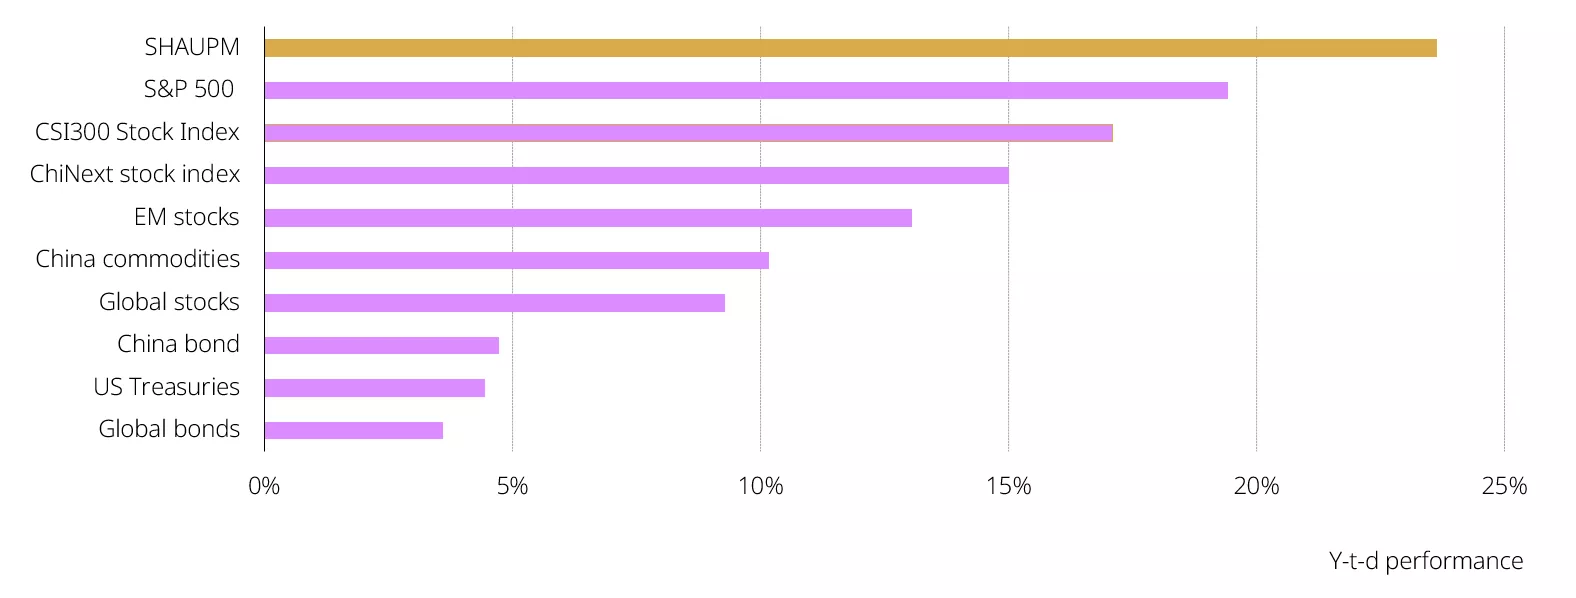
*As of 30 September 2024. All calculations in RMB. Based on the SHAUPM, S&P500 Index, WTI Crude Oil, Bloomberg US Treasury Aggregate, CSI China Money Market Fund Index, Wind China Commodity Index, Bloomberg China Bond Aggregate, Shanghai Shenzhen 300 Stock Index, and the ChiNext Stock Index.
Source: Bloomberg, Shanghai Gold Exchange, World Gold Council
Gold withdrawals from the SGE continued to rebound in September, amounting to 115t, a 13% m/m rise (Chart 3). This is seasonal: retailers’ replenishment for the anticipated sales boost during the early October National Day Holiday and the upcoming peak season in Q4 drove up wholesale gold demand during September. But the y/y decline (-32%) reflects continued weakness in gold jewellery consumption amid a record-level gold price and decelerating economic growth. Bar and coin investment cooled too, impacted by uncertainty in the future price direction of gold and strength in competing assets; notably, equities were boosted by the recent aggressive economic stimuli announcement.
Chart 3: Wholesale gold demand continued its seasonal rebound
Gold withdrawals from the SGE in 2024 and the 10-year average*
*10-year average based on data between 2014 and 2023.
Source: Shanghai Gold Exchange, World Gold Council
During the first three quarters, gold withdrawals from the SGE amounted to 1,128t, an 11% fall y/y and 18% below the 10-year average. In general, weakening gold jewellery demand and the deceleration in investment growth were the main contributors.
September saw Chinese gold ETF flows flip positive, attracting RMB794mn (+US$110mn) (Chart 4). While collective holdings increased by just 1.2t to 91.4t, the total AUM climbed 4% to RMB53bn (US$7.8bn), supported by inflows and a rising gold price. In general, we believe the record-shattering RMB gold price performance has been key in driving gold ETF inflows during the month. We believe that demand for gold ETFs would have been even stronger had investor attention not been diverted to Chinese equities.
Chart 4: Chinese gold ETFs attracted inflows in September
Chinese gold ETF AUM and holdings*
Source: ETF providers, Shanghai Gold Exchange, World Gold Council
Negative flows in August outweighed inflows during July and September, leading to mild net outflows of RMB533mn (-US$74mn, -1t) in Q3, the first quarterly outflow since Q2 2023. Nonetheless, thanks to strong inflows during H1, Chinese gold ETFs have captured RMB16bn (+US$2.3bn, +30t) y-t-d, outpacing every other country.
Gold futures trading volumes at the SHFE fell, averaging 172t in September, 25% lower m/m but 5% above their five-year average (Chart 5). The jump in local equities, which attracted tremendous attention from investors, and the declining RMB gold price volatility may have lowered interest from tactical traders.
Chart 5: SHFE gold futures volumes fell m/m in September
Monthly and five-year average trading volumes in the active gold futures contract*
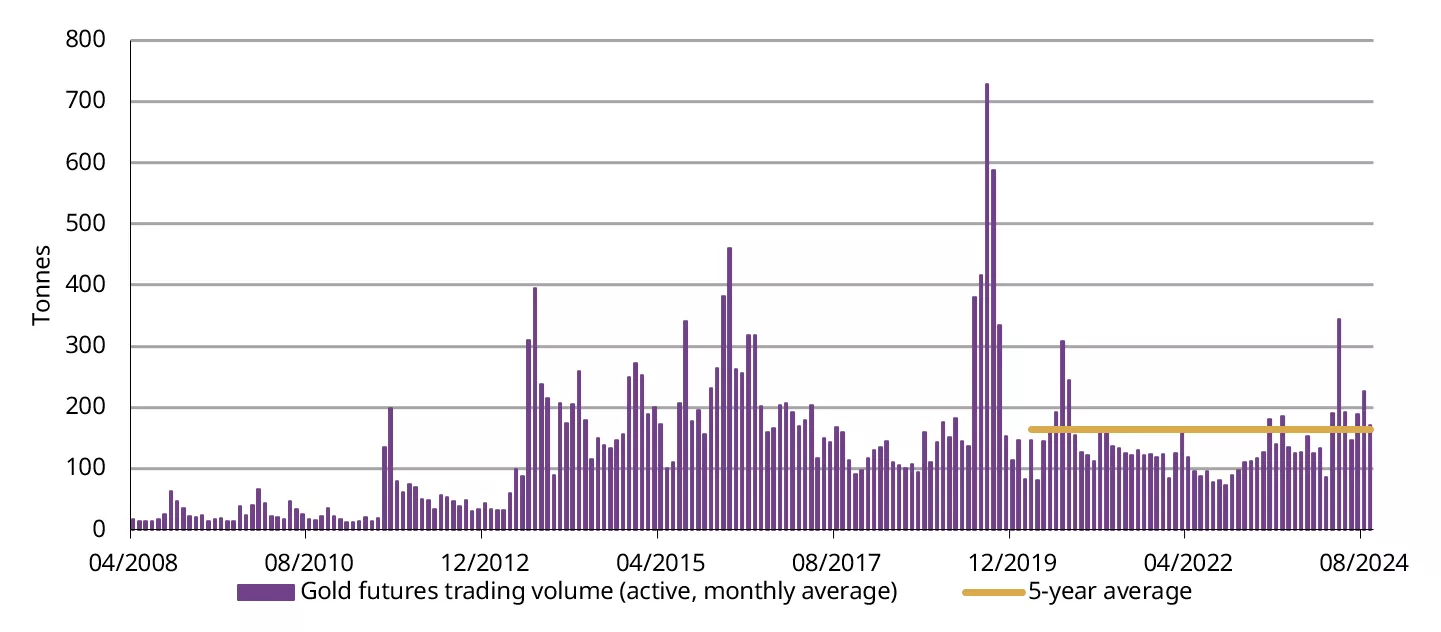
*Based on the average daily trading volumes (by month) of the active gold futures contract.
Source: Shanghai Futures Exchange, World Gold Council
Gold imports almost came to a halt in August, based on the latest data from China Customs (Chart 6). Despite a mild m/m rebound in wholesale gold demand during August, China’s net gold imports only amounted to 10t, 27t lower than a very weak July, marking the lowest since February 2021 when COVID-related restrictions limited imports. We believe this was mainly driven by:
- The local gold price discount, which discouraged importers
- Still subdued gold demand – while there was a m/m rebound in gold withdrawals from the SGE in August, they stayed well below the 2023 level and the long-term average.
Chart 6: Gold imports kept falling*
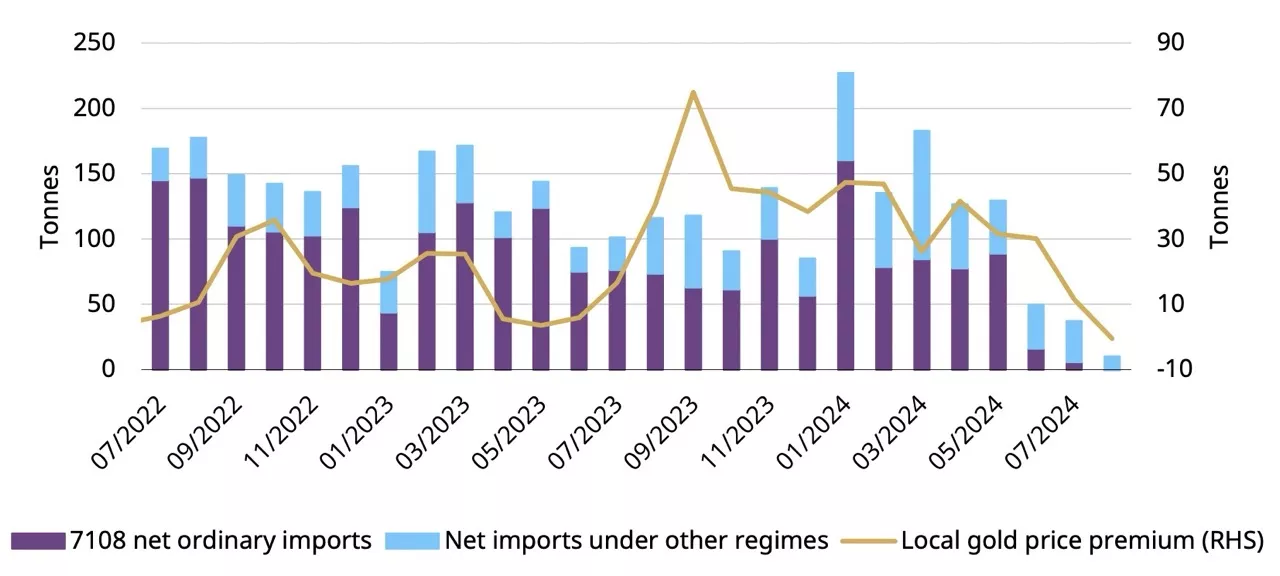
*Based on all imports under HS code 7108 reported by China Customs and excluding exports.
Source: China Customs, World Gold Council
China’s official gold holdings stood at 2,264t in September, unchanged for the fifth consecutive month. Nonetheless, by the end of the month, gold’s share of China’s foreign exchange reserves rose to 5.4%, thanks to the higher gold price. So far in 2024, China’s reported gold purchases total 29t, all of which were accumulated between January and April.
For more information on central bank gold purchases, please visit: Central Banks Gold Reserves by Country
Footnotes
India’s gold market update: Anticipating a festive boost
Kavita Chacko
Research Head, India World Gold CouncilHighlights:
- The surge in demand from the import duty cut was tempered by fresh record-high prices and an inauspicious period in September according to the Hindu calendar
- Domestic gold prices are currently at a slight discount over landed cost1 amid normalising demand
- However, signs of festive buying are beginning to emerge
- With an addition of 54.7t y-t-d,2 the Reserve Bank of India’s (RBI) gold reserves have grown by 7%
- Increased interest in Indian gold ETFs; inflow momentum remains strong
- Gold imports see moderation in imports after August surge.
Looking ahead:
- Anticipation of festive demand; rural purchases expected to provide support.
Gold prices stay elevated after touching record highs
Gold prices continued to rise in September, building on the strong gains from July and August, and reaching multiple new highs. By the end of September, international prices had increased by 5% to US$2,650/oz,3 bringing year-to-date gains to 28%. Domestic landed prices mirrored this trend for the month, surpassing pre-import duty cut levels to INR 75,549/10g,4 aided by the relative stability of the INR against the USD.
The price increases were primarily driven by a decline in the US dollar, as the Federal Reserve initiated monetary policy easing with a significant 50bps interest rate cut. Additionally, ongoing geopolitical tensions contributed to the price rally. While prices have slightly moderated by 1% in October, they remain elevated, with y-t-d international price increases at 27% at the time of writing.
Chart 1: Gold price sees sharp gains
LBMA Price AM and domestic landed price by month, US$ and INR*
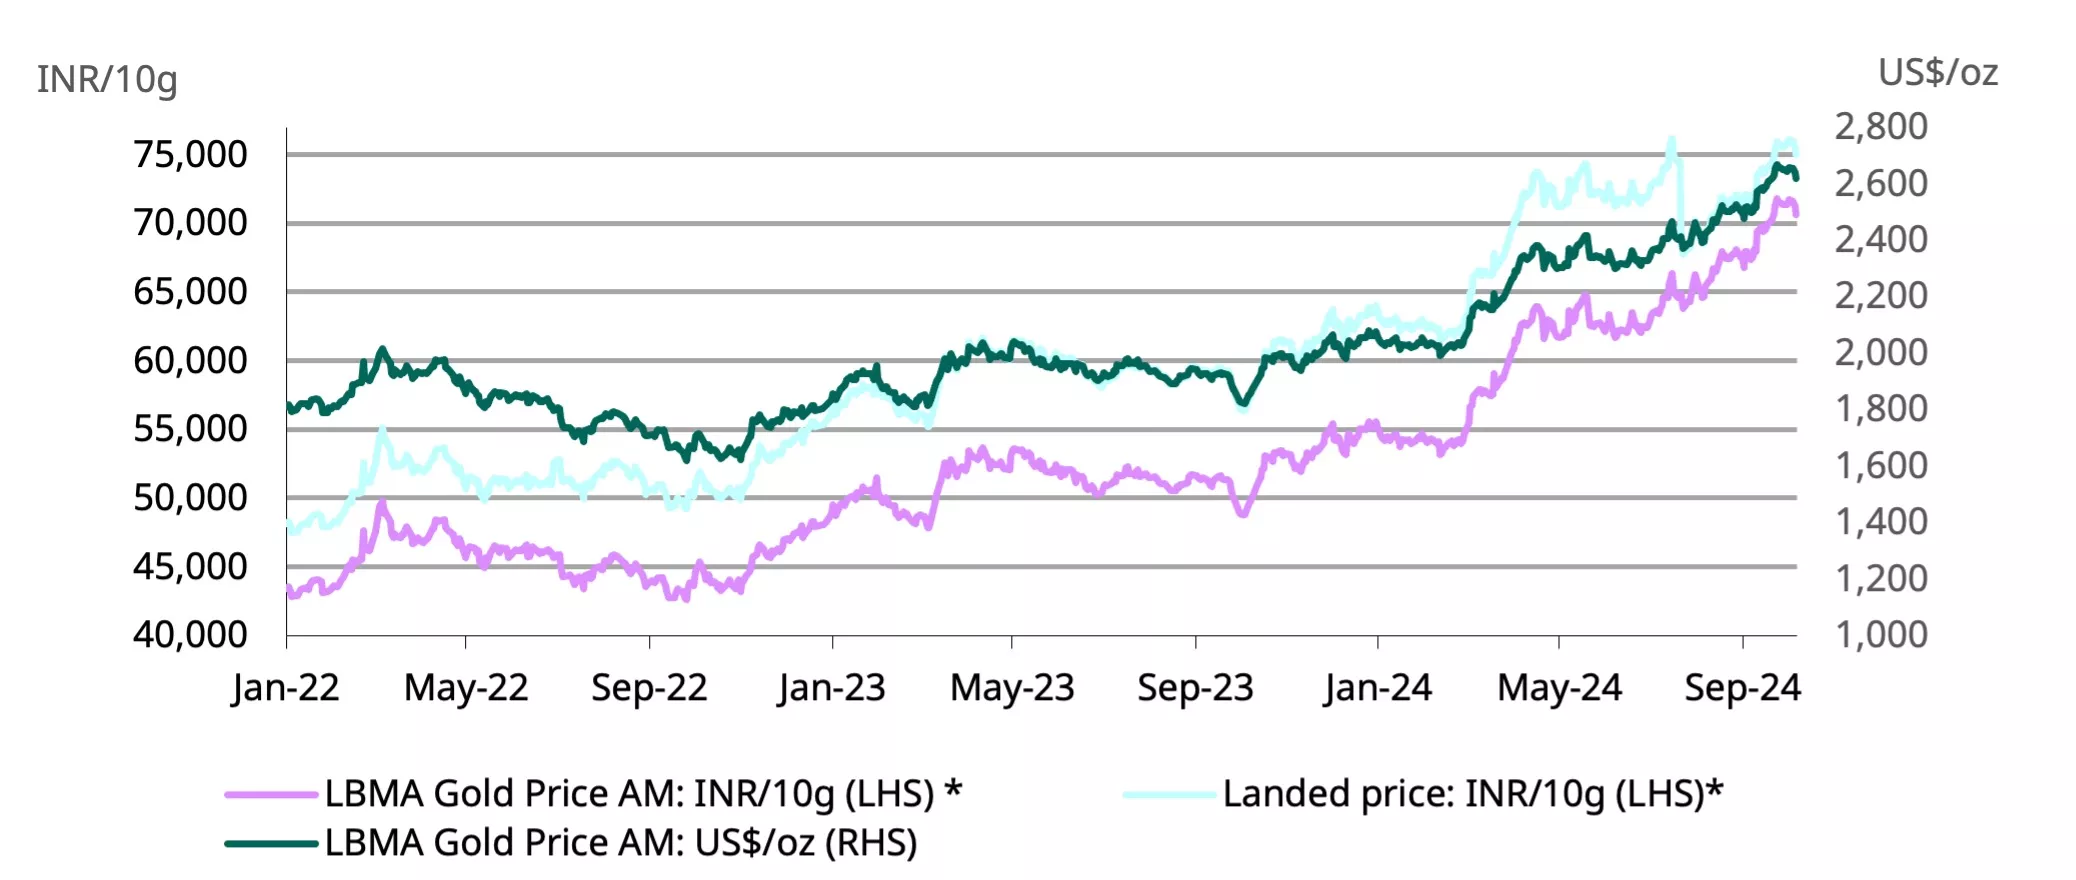
*Based on the LBMA Gold Price AM in USD expressed in local currency as of 9 October 2024. Landed price includes import tariff and tax.
Source: Bloomberg, World Gold Council
Festive buying to support demand: high prices a challenge
High prices coupled with an inauspicious period in the Hindu calendar for making purchases of valuable items from mid-September to early October, kept consumers away from jewellery buying. However, market reports indicate early signs of a resurgence in gold buying due to various ongoing festivals, with demand largely driven by wedding purchases. Retailers are actively implementing marketing campaigns to stimulate sales.
The surge in demand following the import duty cut, which coincided with some festivals, has been tempered by record-high prices. There is an expectation of increased demand from rural areas, driven by improvements in overall consumption. Favourable monsoons and higher crop sowing this year are anticipated to boost rural incomes, potentially leading to higher gold purchases.
Investment demand for gold bars and coins remains strong, in part fuelled by the rise in gold prices and expectations of further increases. This trend is further enhanced by sales across online marketplaces,5 making gold more accessible.
Domestic gold price trading at a modest discount
Gold prices in the domestic market are trading at a slight discount to the landed price since mid-August. This trend reflects a normalization in demand after the initial surge following the reduction in import duty. Currently, the discounts average US$4/oz, a shift from the premium6 of US$5-$28/oz that was observed for approximately three weeks post-duty cut.
Chart 2: Domestic gold prices trade at marginal discount
NCDEX gold premium/discount relative to international price*
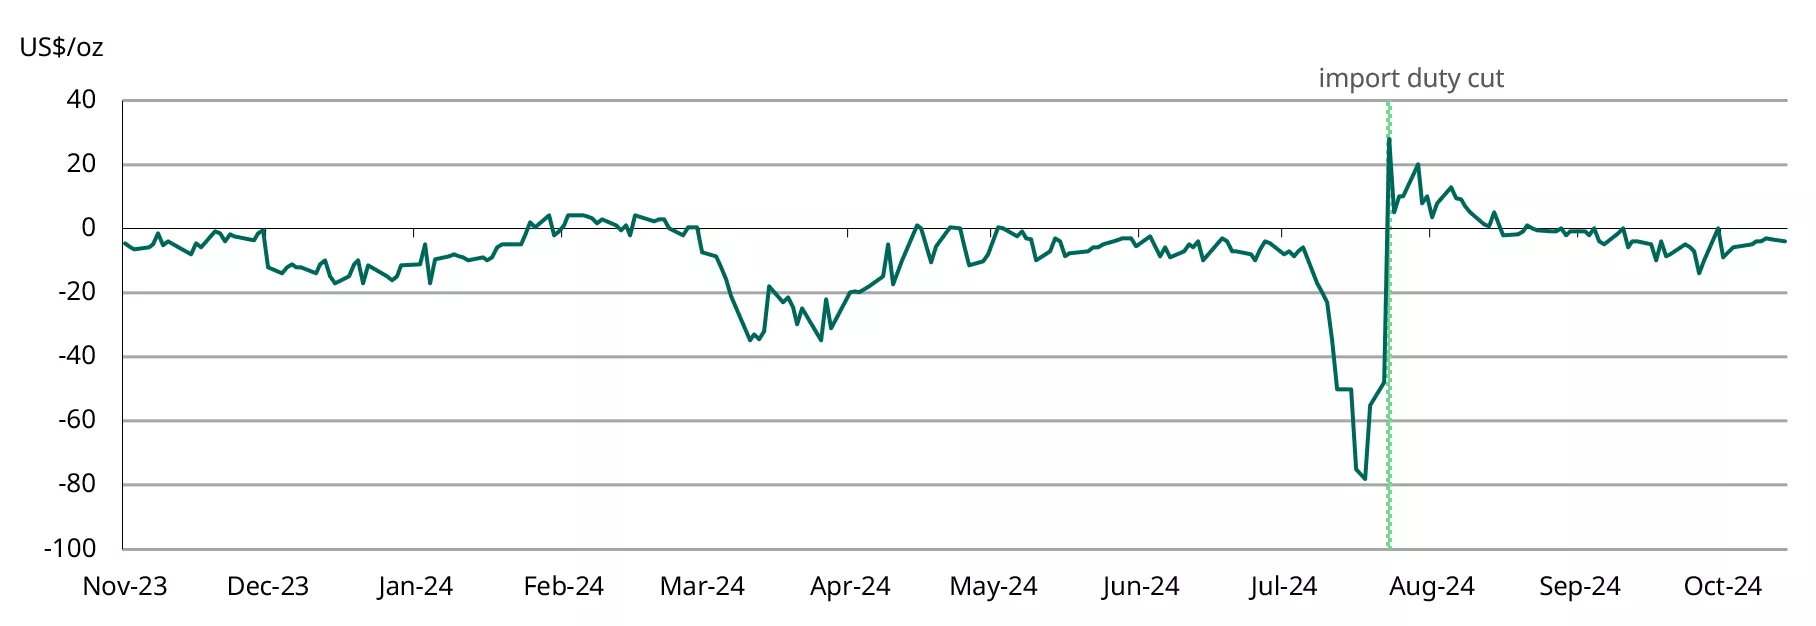
*As of 14 October 2024.
Source: NCDEX, World Gold Council
Significant growth in Indian gold ETF investments
Investor interest in Indian gold ETFs has remained strong since the taxation changes announced in the Union Budget in July, as evidenced by the notably higher inflows during this period. The strong gold price momentum and elevated geopolitical risk also contributed to inflows from investors seeking, higher returns. Anecdotal reports indicate an increase in retail investor participation. Our initial estimates based on partial information pointed to another positive month for Indian funds. And according to the Association of Mutual Funds in India (AMFI), September saw net inflows of INR12bn (~US$147mn), lower than the previous months record inflows (by 20%) but significantly higher than the average net inflows of INR 5.3bn (~US$63mn) in the first half of the year.
These sustained inflows and higher gold prices pushed up the cumulative assets under management (AUM) for Indian gold ETFs to a record INR398bn(~US$4.7bn), a 7% increase m/m and a 67% rise from a year ago, as per AMFI data. So far in 2024,7 net inflows into Indian gold ETFs have amounted to INR74bn(~US$879mn), a substantial increase from INR17bn in the same period last year. Collectively, these funds have added 10.3t of gold this year, bringing their total gold holdings to 52.6t, which represents a 29% y/y increase.
The steady inflow into Indian gold ETFs aligns with the global trend of ongoing investments in gold ETFs, driven by lower opportunity cost associated with interest rates and the US dollar, surging gold price, and demand for safe-haven assets.
Chart 3: Healthy demand for Indian gold ETFs
Monthly gold ETF fund flows in INRbn and total holdings in tonnes*
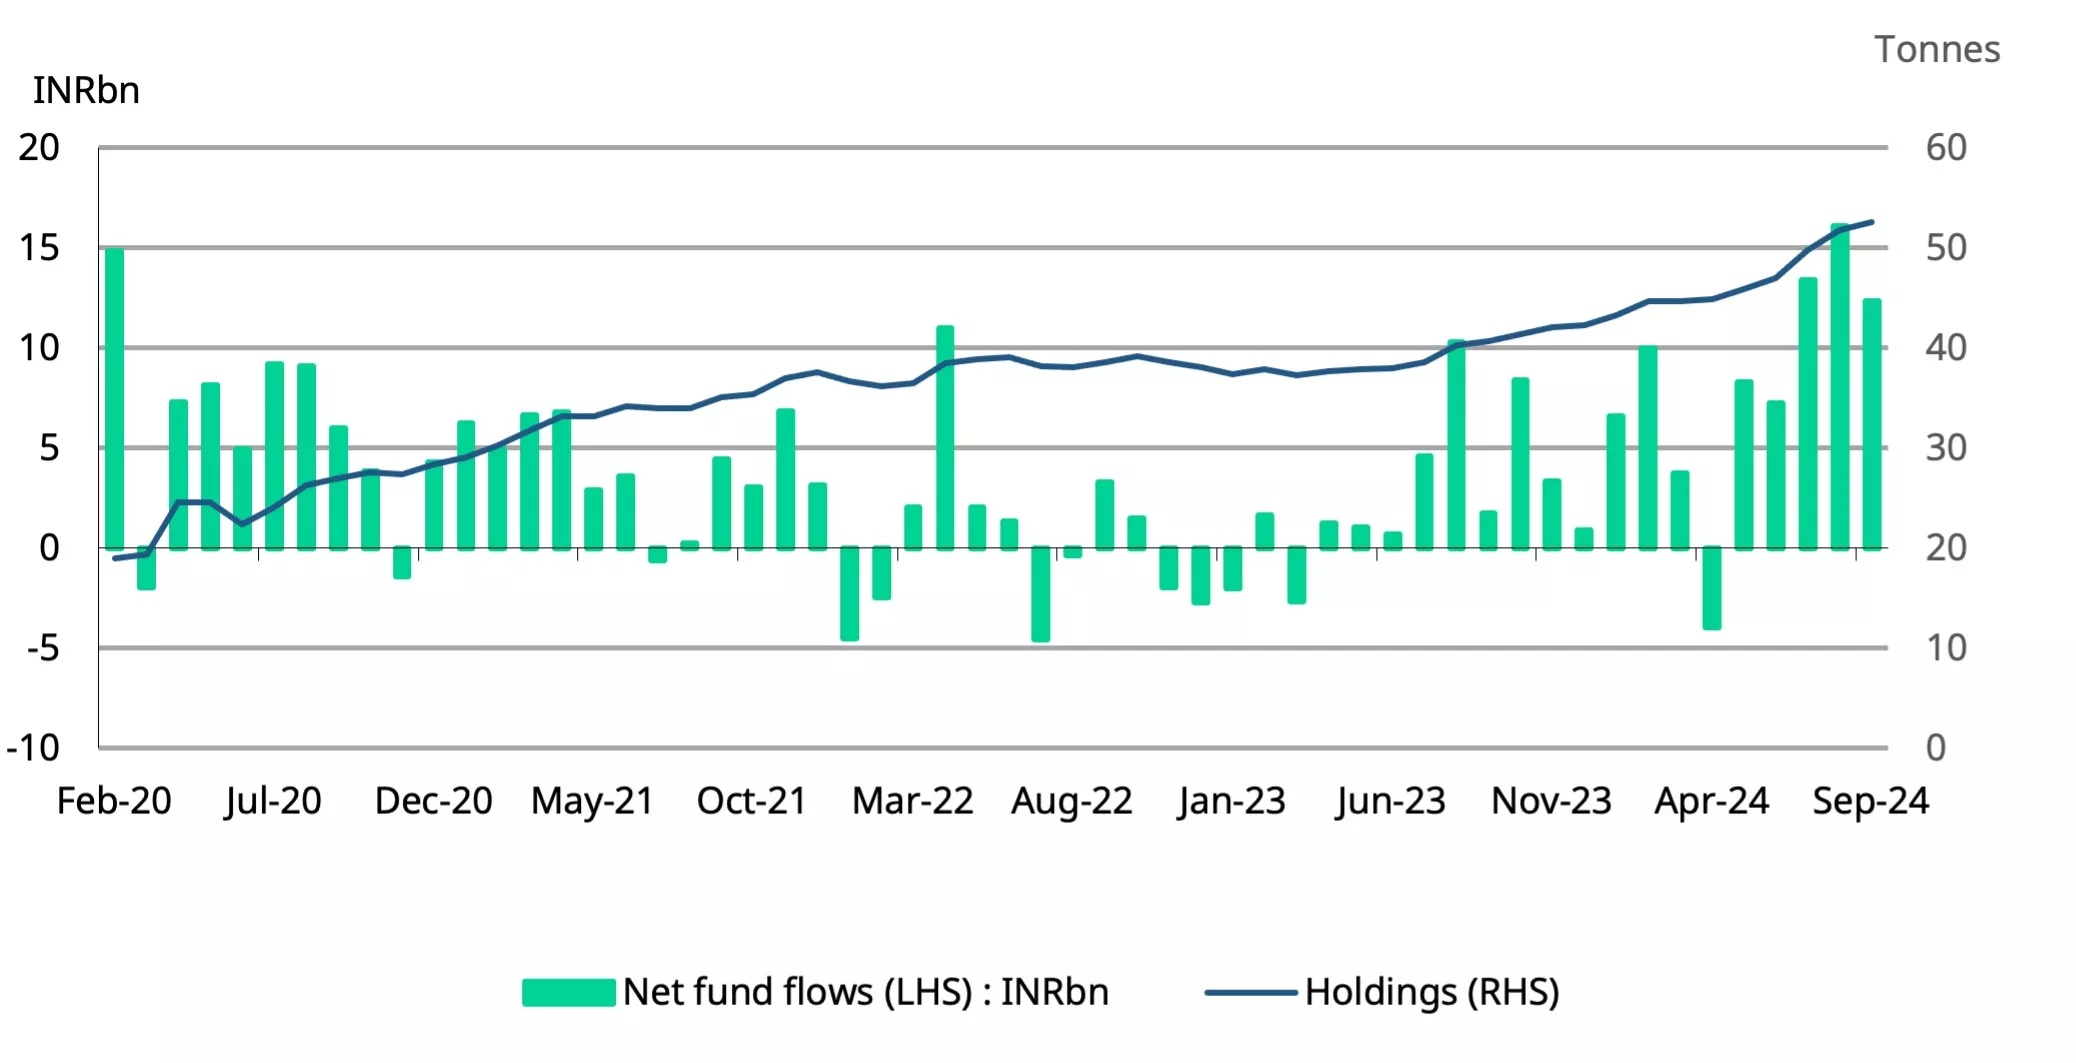
*As of end September 2024.
Source: Bloomberg, company filings, AMFI, CMIE, World Gold Council
RBI’s strategic gold buying hits new highs
In an effort to diversify its forex reserves and to hedge against external uncertainties,8 the Reserve Bank of India has been strategically increasing its gold holdings. So far in 2024, the RBI has made substantial purchases, adding a total of 54.7t to its reserves since the end of 2023 - the highest acquisition in three years. This increase reflects a y-t-d rise of 6% in reserves, bringing the RBI’s total gold holdings to a record 858.3t, positioning it as one of the leading buyers of gold this year.
Chart 4: RBI's gold purchases reach three-year high in 2024
RBI’s net purchases and reserves; in tonnes*
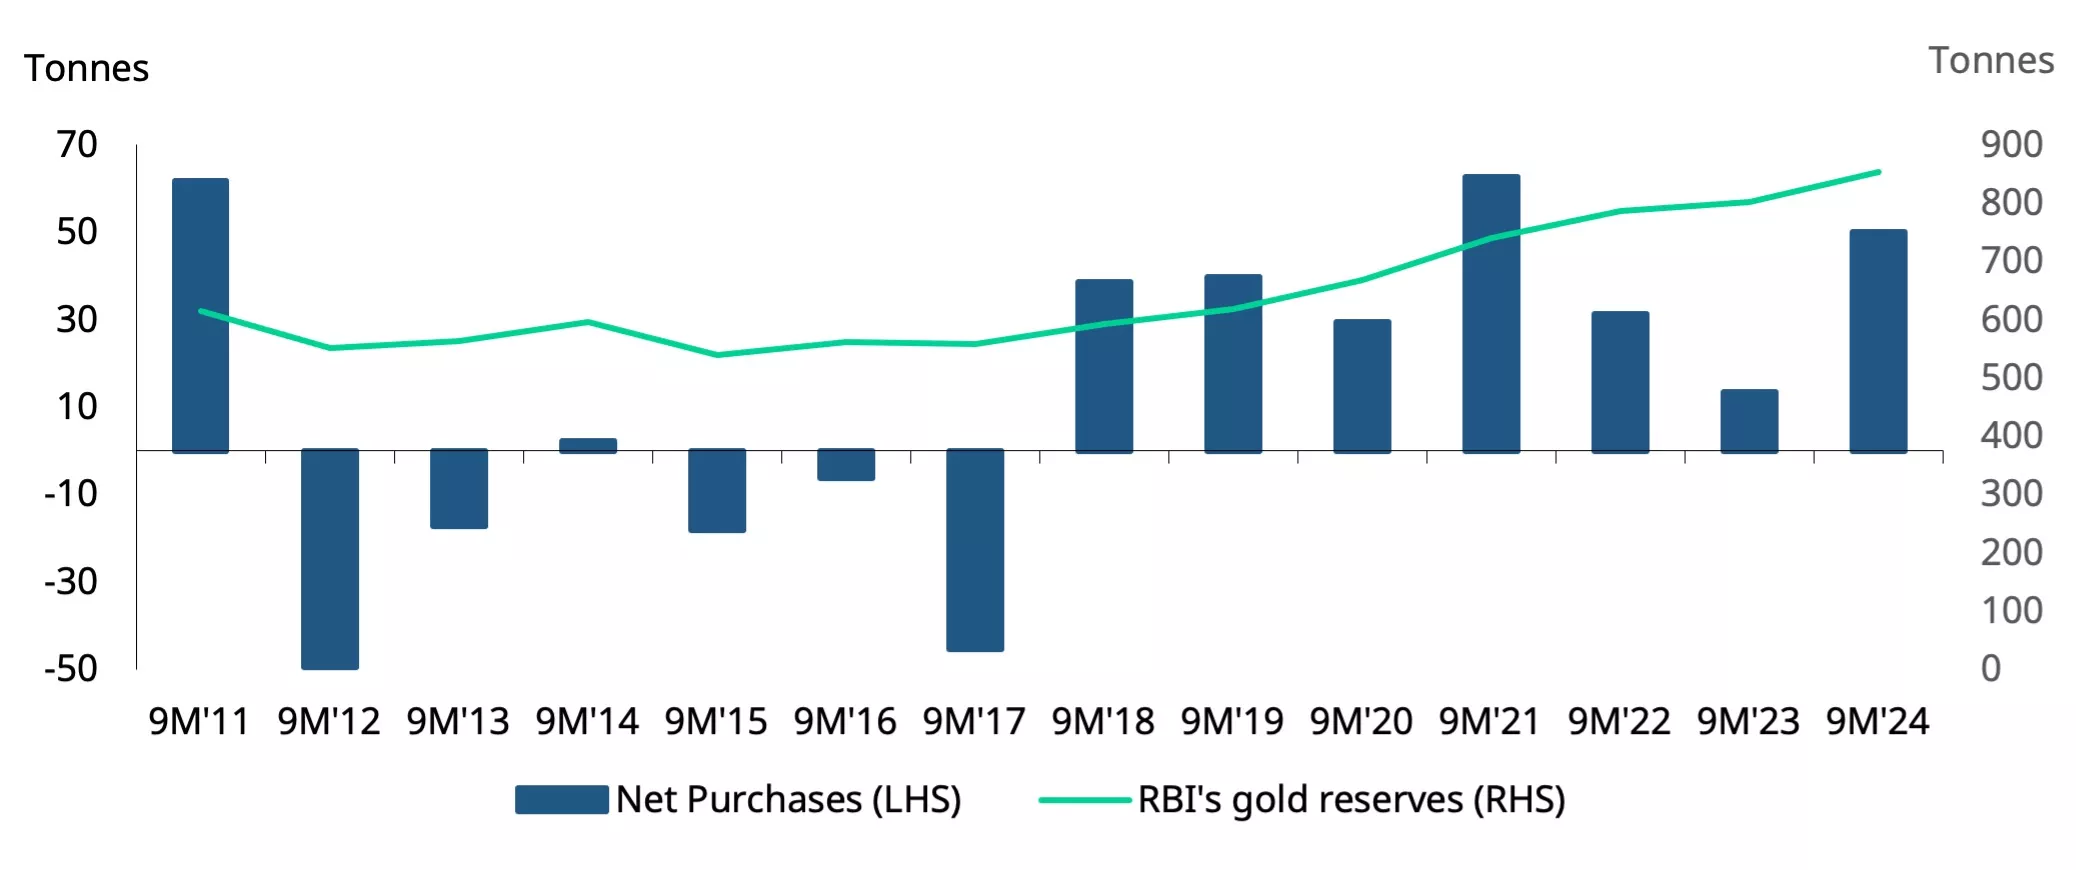
*Data as of 4 October 2024.
Source: RBI, World Gold Council
Gold imports moderate
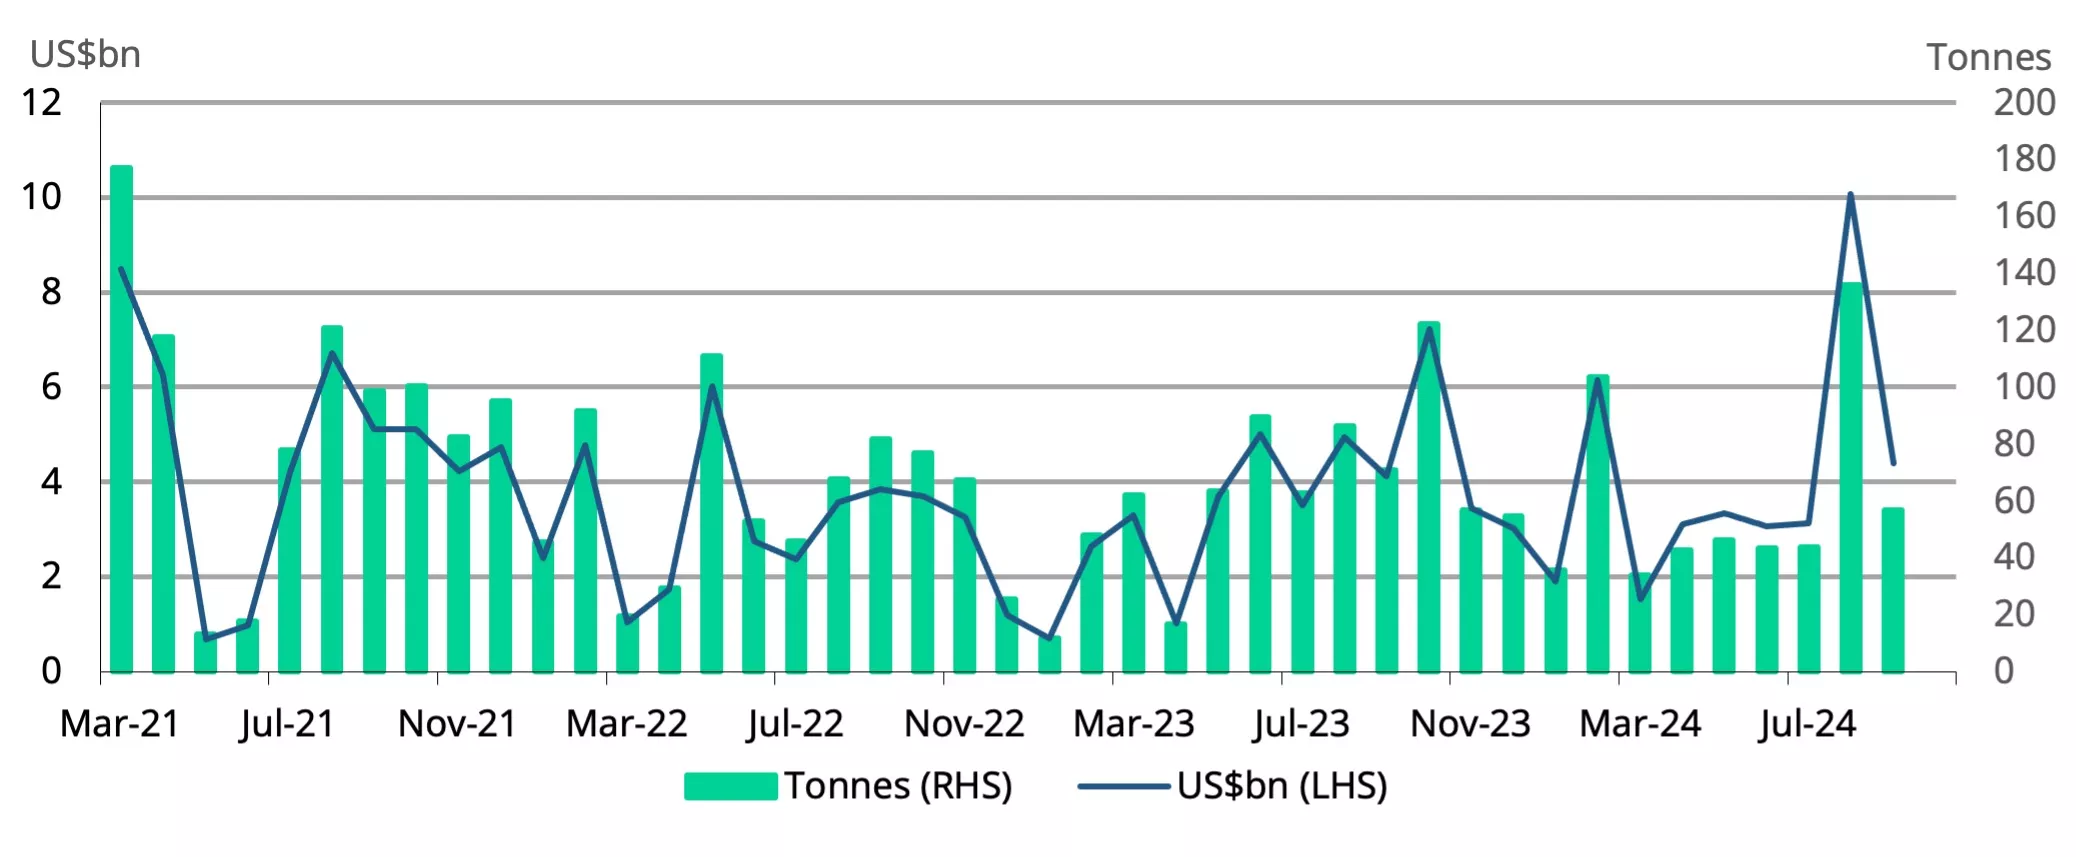
September saw a drop in gold imports from the unprecedented levels recorded in August. However, at US$ 4.4bn, imports remained significantly higher than the average of US$3.18bn during January to July. Our estimates indicate that in volume terms, imports for the month were around 55-57t, markedly lower than the 136t imported in August. This drop can be attributed to normalising demand and the substantial festival-related imports made by bullion dealers and manufacturers the previous month. From January to August, gold imports increased by 27% y/y, totaling US$37bn; in volume terms, the increase is estimated to be around 6%, approximately 540t.
Chart 5: Gold imports slowed in September
Monthly gold imports; in tonnes and US$bn*
*As of 16 October 2024. Includes World Gold Council estimates.
Source: Ministry of Commerce and Industry, CMIE, World Gold Council
Footnotes
1 Landed price of gold is the international price adjusted for import taxes and exchange rate.
2 As of 4 October, 2024
3 Based on LBMA Gold Price AM.
4 Landed price
5 Hallmarked gold coins, bars see 35-80% sales surge on the e-commerce platforms, The Economic Times, 24 September 2024.
6 Premium or discount to international price is calculated as the difference between the landed price of gold (which is the international price adjusted for import taxes and exchange rate) and the domestic selling price.
7 January to September.
8 Buying gold annually to diversify allocation of forex reserves. The EconomicTimes, 19 June, 2024
Gold Cost Drivers: A Veritable Pick and Mix
Sarah Tomlinson
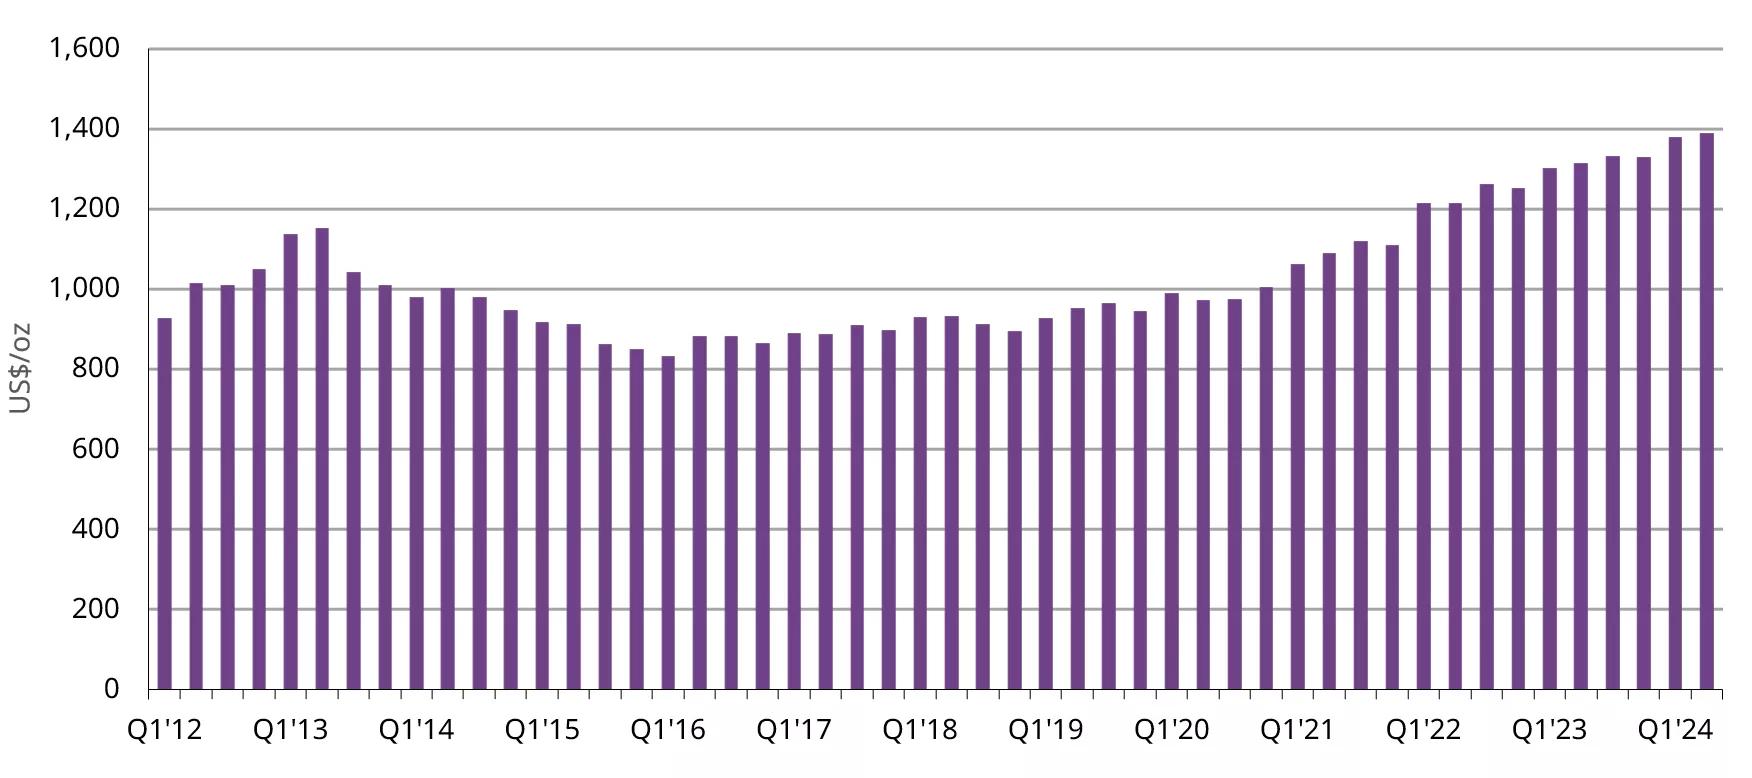
Director of Mine Supply Metals FocusIn Q2’24, dare it be written, All-In Sustaining Costs (AISC) rose again, creeping up by 1% q/q, or a more substantial 6% y/y to US$1,388/oz. In some ways, the onward march of AISC in the last couple of years is reminiscent of hill-walking; just when you think you’ve reached the top, there’s always that little bit more hill to climb. And yet, in Q2’24, it isn’t just the usual suspects driving this growth.
Gold production costs continued to climb in Q2’24
Monthly gold AISC, US$/oz*
*Data to 30 June 2024.
Source: Metals Focus Gold Mine Cost Service
On average, cash operating costs were down 2% q/q to US$938/oz, but compared to Q2’23 were up 5% y/y. Inflation in key producing countries such as Australia, Canada and the United States fell q/q, driven by lower fuel prices. The quarterly average Brent Crude price of US$77.3/barrel was 3% lower q/q and down 6% y/y. While this would have brought some relief to producers it is still considerably higher than oil prices of a few years ago, with a real risk that it may rise further before the end of the year.
One key element of cash operating costs, labour, remains elevated. In Australia, the Australian Bureau of Statistics reported that the mining industry had the highest quarterly rise in wages out of all the industry sectors it monitors during Q2’24, up 1.3% q/q, or 4% y/y. This issue isn’t just limited to Australia however. Newmont recorded higher labour costs at both Cero Negro in Argentina and Ahafo in Ghana. AngloGold Ashanti reported increased labour costs at Iduapriem, also in Ghana, while Harmony disclosed a 9% y/y rise for H1’24 for its operations in South Africa and Papua New Guinea.
In terms of production, the higher gold price has enabled some companies to process lower grade ore and stockpiles. Agnico Eagle processed lower grade material at Goldex and Macassa in Canada and Fosterville in Australia. Northern Star processed more stockpiled material at KCGM, lowering the head grade and AngloGold Ashanti mined lower grade ore at Sunrise Dam in Australia. Furthermore, some operations were affected by further weather events, for example Evolution Mining’s Mungari in Australia, and others by unforeseen incidents such as the fire in Northern Star’s Jundee processing plant. All these factors led to a drop in gold production and a rise in on-site production costs.
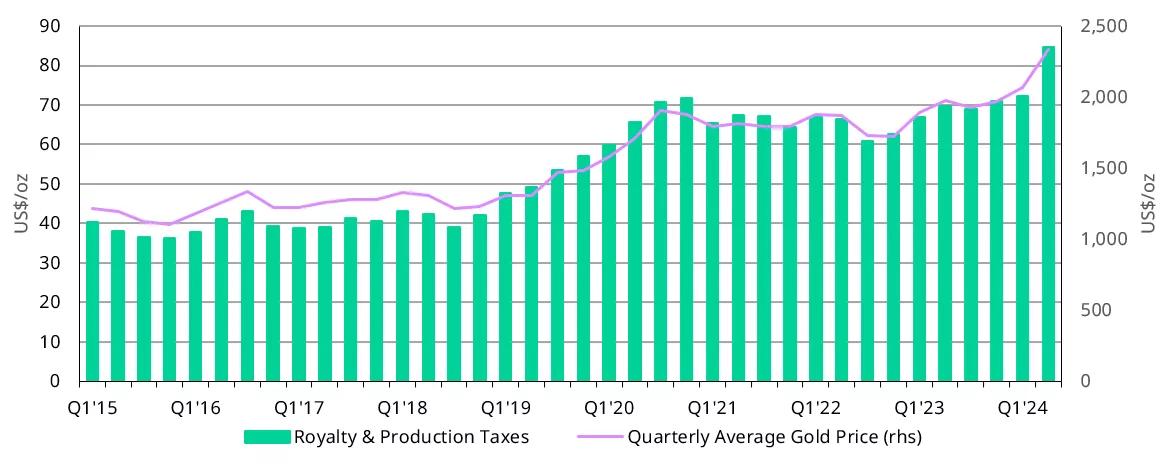
Not surprisingly, there has been a sizeable increase in average royalties and production taxes as the gold price has risen. Average royalties were US$85/oz in Q2’24, up 17% q/q or 22% y/y, continuing the upward trend which began in 2019. Barrick reported higher royalties at Carlin, part of the Nevada Gold Mines complex, and Loulo-Gounkoto in Mali, among others. Newmont reported higher third party royalties at Ahafo in Ghana and Agnico Eagle cited increased royalties as one of the drivers behind its higher costs for the quarter. Endeavour Mining also reported higher royalties, particularly in Burkina Faso where the royalty rate was increased in Q4’23. Despite this rise, our data shows that average royalties and production taxes accounted for 6% of the AISC in Q2’24, only one percentage point higher than in Q2’23.
Rising producer royalties on the back of the higher gold price
Producer Royalty and Production Taxes and Gold Price US$/oz*
*Data to 30 June 2024.
Source: Bloomberg, Metals Focus
Sustaining capital expenditure also rose during the quarter, to an estimated US$301/oz, up 5%, both q/q and y/y. The increased spending was for varying reasons. Barrick incurred higher sustaining capital costs at Kibali, in the DRC, due to an increase in capitalised waste stripping and at Carlin in Nevada and Loulo-Gounkoto in Mali because of equipment purchases. Gold Fields reported increased sustaining capital expenditures at St Ives in Australia due to the development of two new open pits. The company also reported a rise at South Deep in South Africa, in part due to the level 9 rollout of a Collision Avoidance system. Elsewhere in Senegal, Endeavour disclosed an increase in this expenditure at Sabodala-Massawa in Senegal due to equipment rebuilds and geotechnical work.
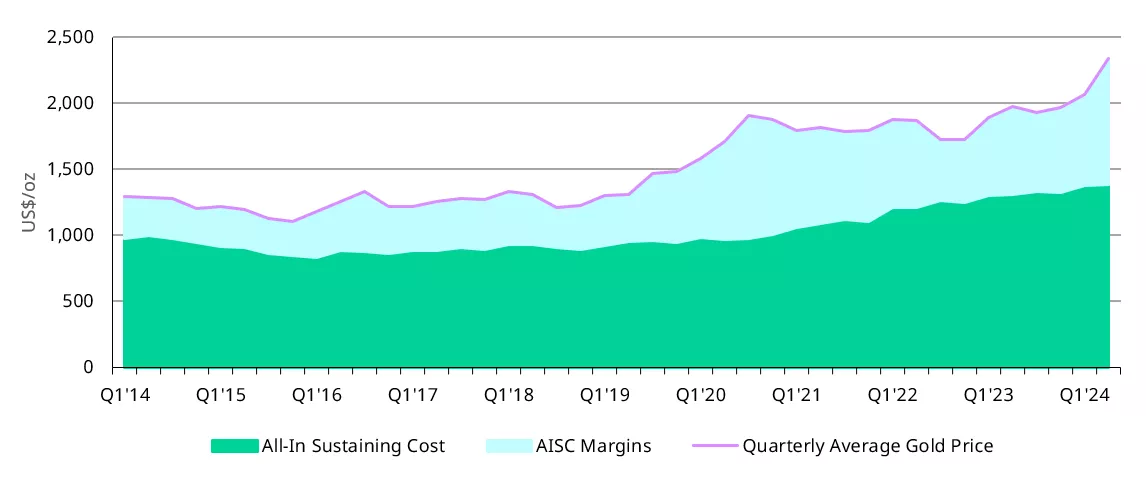
On the upside, the jump in the quarterly average gold price in Q2’24 gave a welcome boost to average producer AISC margins, propelling them to US$950/oz. This surpassed the significant margins of the COVID-19 pandemic in 2020 and is the highest margin since Q1’12. These margins more than offset the higher costs and ensured that 97% of gold producers were profitable during the quarter.
Average producer margins reach record highs
AISC, AISC Margins and Quarterly Average Gold Price US$/oz*
*Data to 30 June 2024.
Source: Bloomberg, Metals Focus
To borrow a phrase from footballing parlance, Q2’24 really was a game of two halves: on the one hand, AISC costs continued to rise but on the other, AISC margins climbed, providing a welcome buffer. As discussed, the underlying causes of cost escalation in Q2’24 were diverse and it will be interesting to see if this scenario continues into Q3’24. Will costs finally start to come down, or will they, as in the words of the singer Kate Bush, keep ‘running up that hill?’
