Summary
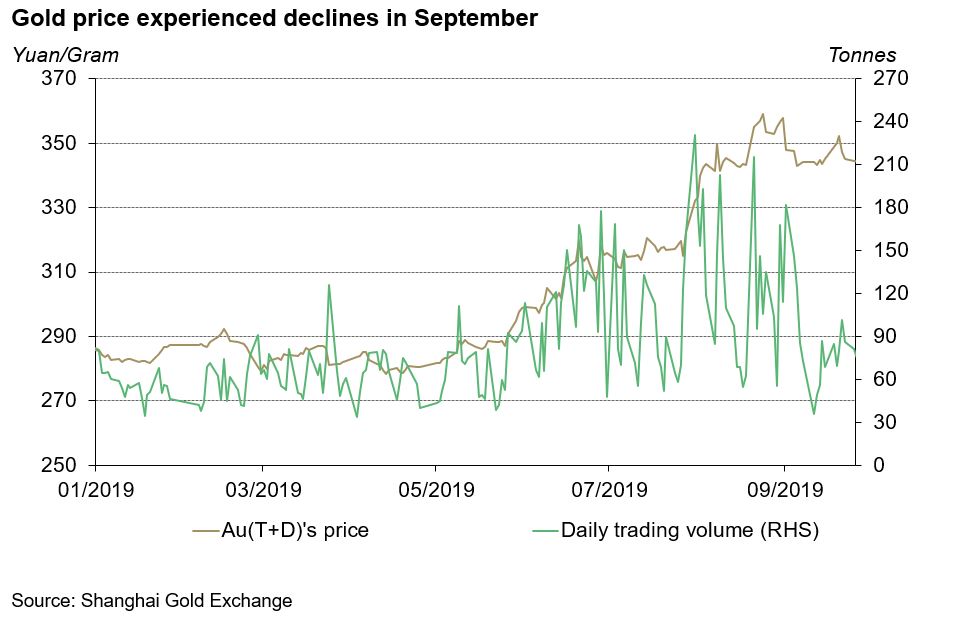
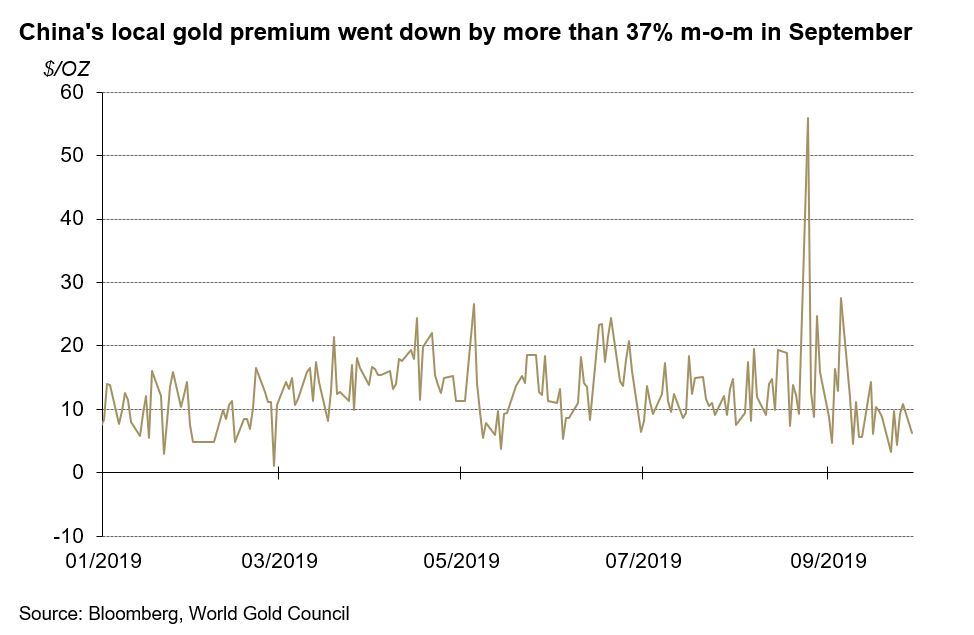
- The Shanghai Gold Benchmark price saw a modest decline in September, with the local gold premium falling sharply due to the stabilising currency and increasing gold imports.
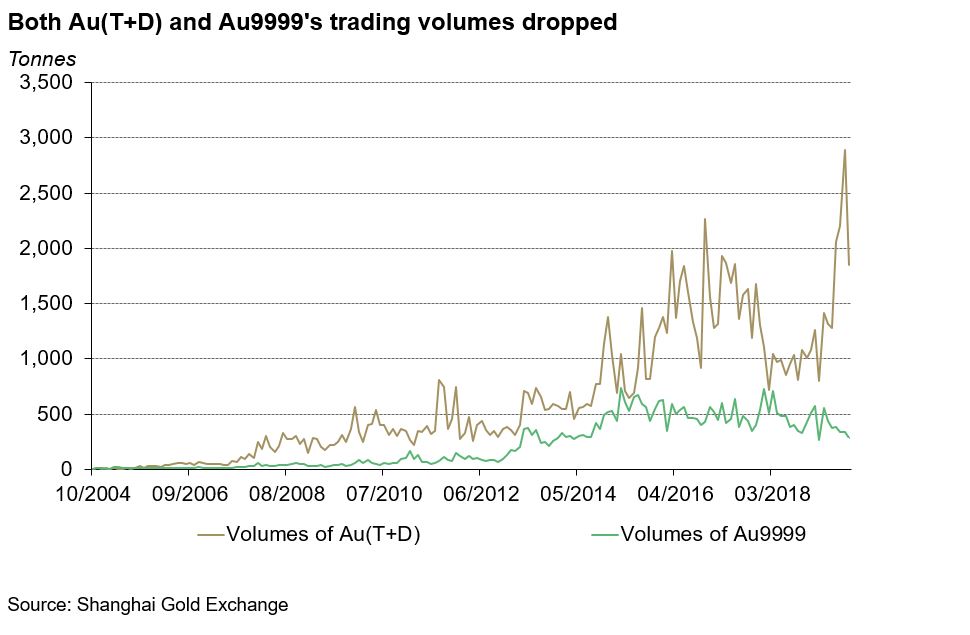
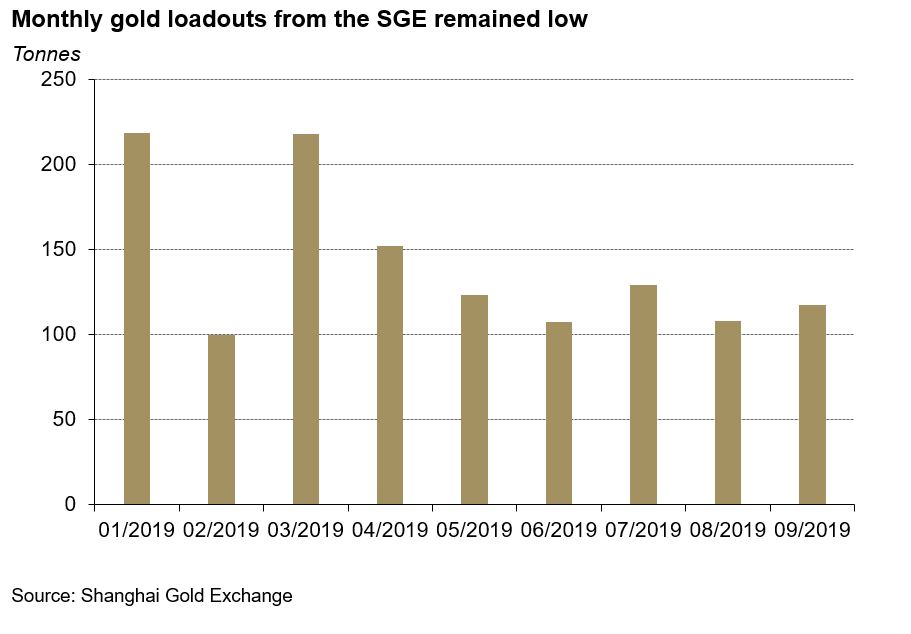
- Led by the declining gold price and the soft physical demand, both Au(T+D) and Au9999’s trading volume dropped last month while loadouts from the Shanghai Gold Exchange (SGE) levelled off.
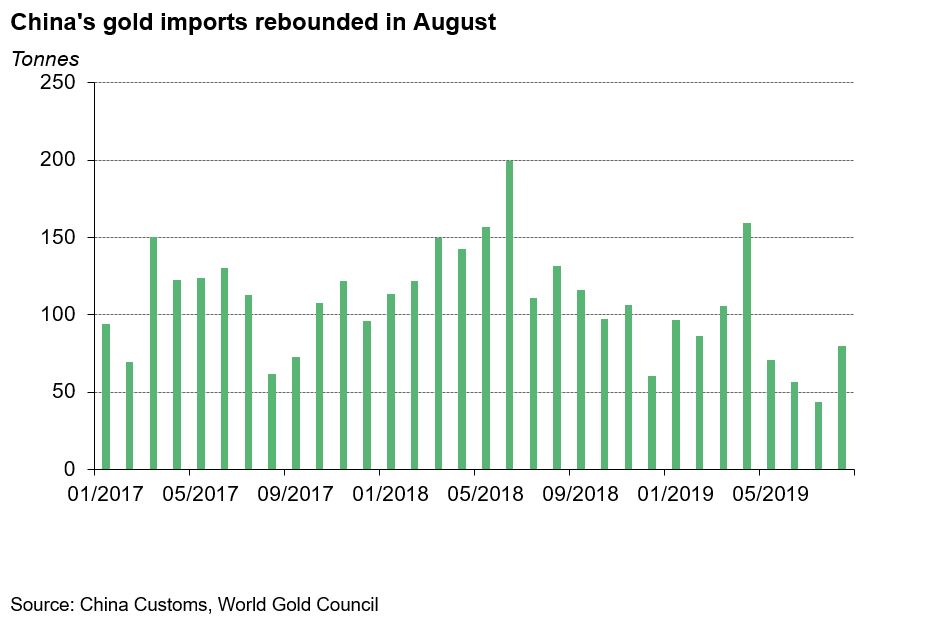
- After hitting the lowest level since 2017 in July, gold imports to China rebounded in August.
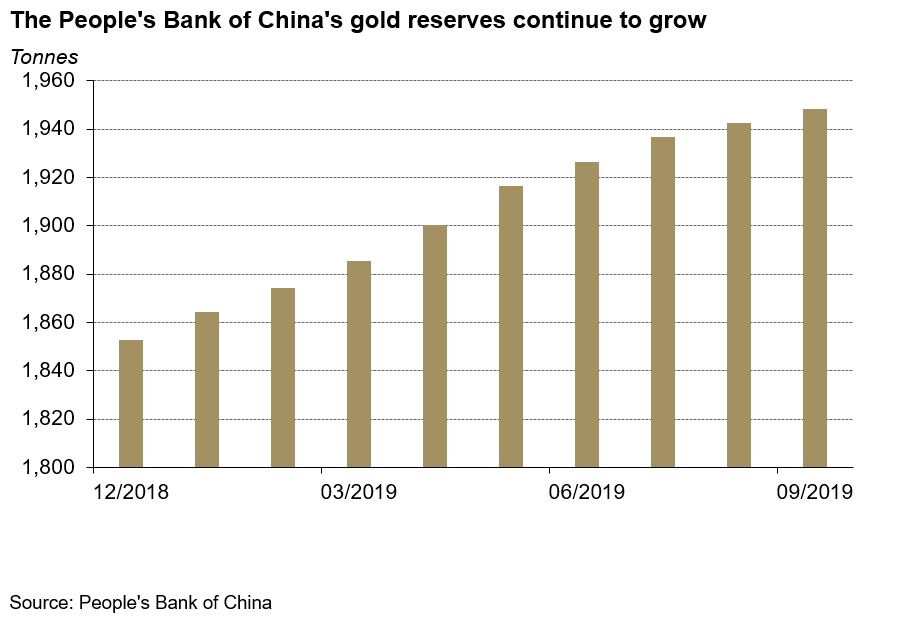
- The People’s Bank of China (PBoC) added another 6t to its gold reserves in September. After ten consecutive purchases, the PBoC now holds 1,948t gold in its reserves.
Chinese gold prices saw modest declines in September. The Shanghai Gold Benchmark (PM) and Au(T+D)’s prices fell by 3.26% and 3.12% respectively in September. LBMA Gold fixing AM also witnessed a 2.35% drop. The primary reasons for this weakness include easing trade dispute concerns, rebounds in US treasury yields and the strong US dollar.
With domestic gold supplies rising and speculative enthusiasm falling – which we will discuss below, Chinese local gold prices experienced extra headwinds, resulting in weaker performances compared with international gold price.
Despite a few glimpses of recovery, China’s slowdown in GDP growth continued. Driven by the counter-cyclical adjustment measures by the central bank such as cutting the Required Reserve Ratio, growth in social financing, retail sales, and value added of industry accelerated in September. However, with Producer Price Index (PPI), exports and growth in fixed-asset investment falling and CPI rising continuously, China’s GDP growth in Q3 dropped to 6% y-o-y, the lowest in 27 years.
Au(T+D)’s trading volume in September fell to 1,850t, a 36% drop m-o-m. Speculators’ enthusiasm ebbed as the gold price dipped. However, Au(T+D)’s trading volume during last month was still 128% higher y-o-y and well above the 2018 average of 971t.
The trading volume of Au9999, the physical contract at the SGE, experienced a 16% decline m-o-m, totaling 285t in September. In contrast to Au(T+D), the average trading volume of the physical contract so far in 2019 has fallen by 200t y-o-y.1 As our Gold Demand Trends stated, China’s physical demand has generally been weaker in 2019 when compared with 2018.
The average local gold premium witnessed a 37% fall m-o-m in September after reaching a six-year high on 26th August when USD/CNY breached CNY7 for the first time in 11 years. A more stable currency and increasing gold imports were the main reason behind the sharp fall. USD/CNY has come down from the 11-year-high of 7.19 recorded on 3rd September, amid positive signs of the US-China trade talks, easing local investors’ concerns for further depreciation. Also, China’s gold imports rebounded significantly in August after dropping for three consecutive months, increasing domestic gold supplies.2
Note: SHAU PM VS. LBMA Fixing AM
China’s gold imports under the HS code 7108 rebounded to 80t in August, 36t higher m-o-m, but still 52t lower y-o-y.3 After a 40% y-o-y decrease in gold imports during the first seven months this year, a rebound in August seems appropriate given that China’s gold demand didn’t fall as much and domestic mined gold supply is limited by strict environmental regulations. Previous strict restrictions on gold imports quotas have eased recently, supplementing to domestic gold supplies.
Gold withdrawals from the SGE experienced a slight increase of 9t, totalling 117t in September. While there was a marginal increase m-o-m in loadouts last month, the average loadouts during the first three quarters of 2019 is 18% lower y-o-y, also indicating a weaker physical demand this year.
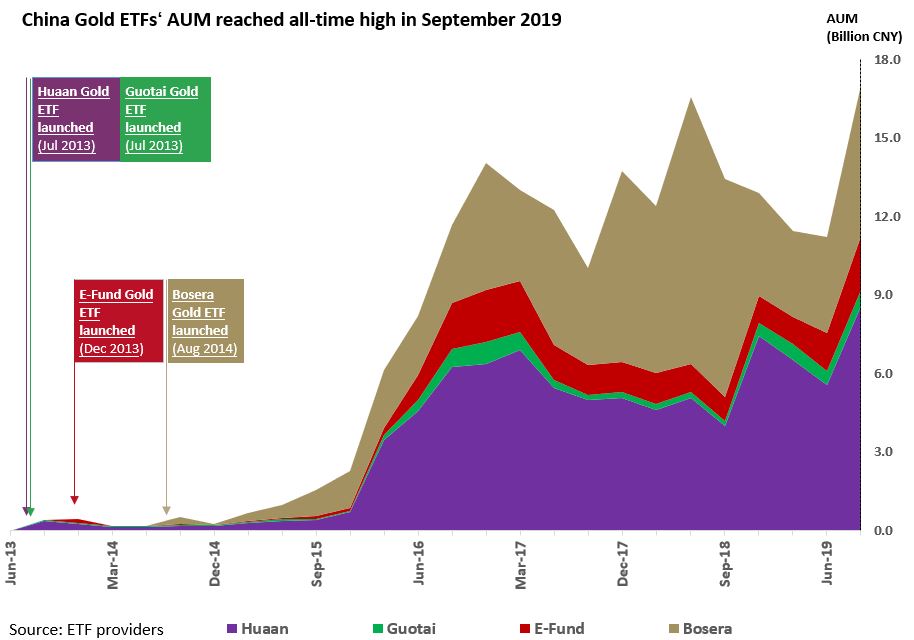
The total Asset Under Management (AUM) of Chinese gold ETFs reached 17 billion yuan or US$2.4 billion at-end September, a new all-time record. As of 30th September, holdings of China’s four gold-backed ETFs’ totalled 50t, a 3.5t rise m-o-m. The reason behind gold ETFs’ rising popularity in China could be two-fold. Firstly, Chinese gold ETF investors tend to be more sophisticated and longer-term oriented, thus treating the dip in the gold price as a great opportunity to expand their gold allocations.
Secondly, innovations, the convenience to gain gold exposure, and increasing efforts in product promotion by ETF providers have played a key role in attracting new investors.
The PBoC added another 6t to its gold reserves in September. This is the 10th consecutive gold purchase and the gold reserves now stand at 1,948t at the end of September. Y-t-d, China has added 95.8t of gold to its reserves.
Footnotes
1 For the differences in the demand the two contracts represent, please visit: www.gold.org/goldhub/gold-focus/2019/06/tale-two-contracts-speculative-investment-physical-demand-down
2 Gold imports data published by China Customs has a one-month lag, i.e. July’s figure was only available towards the end of August.
3 HS code 7108 includes gold (Including Gold Plated with Platinum), unwrought or In semi-manufactured forms, or In powder form