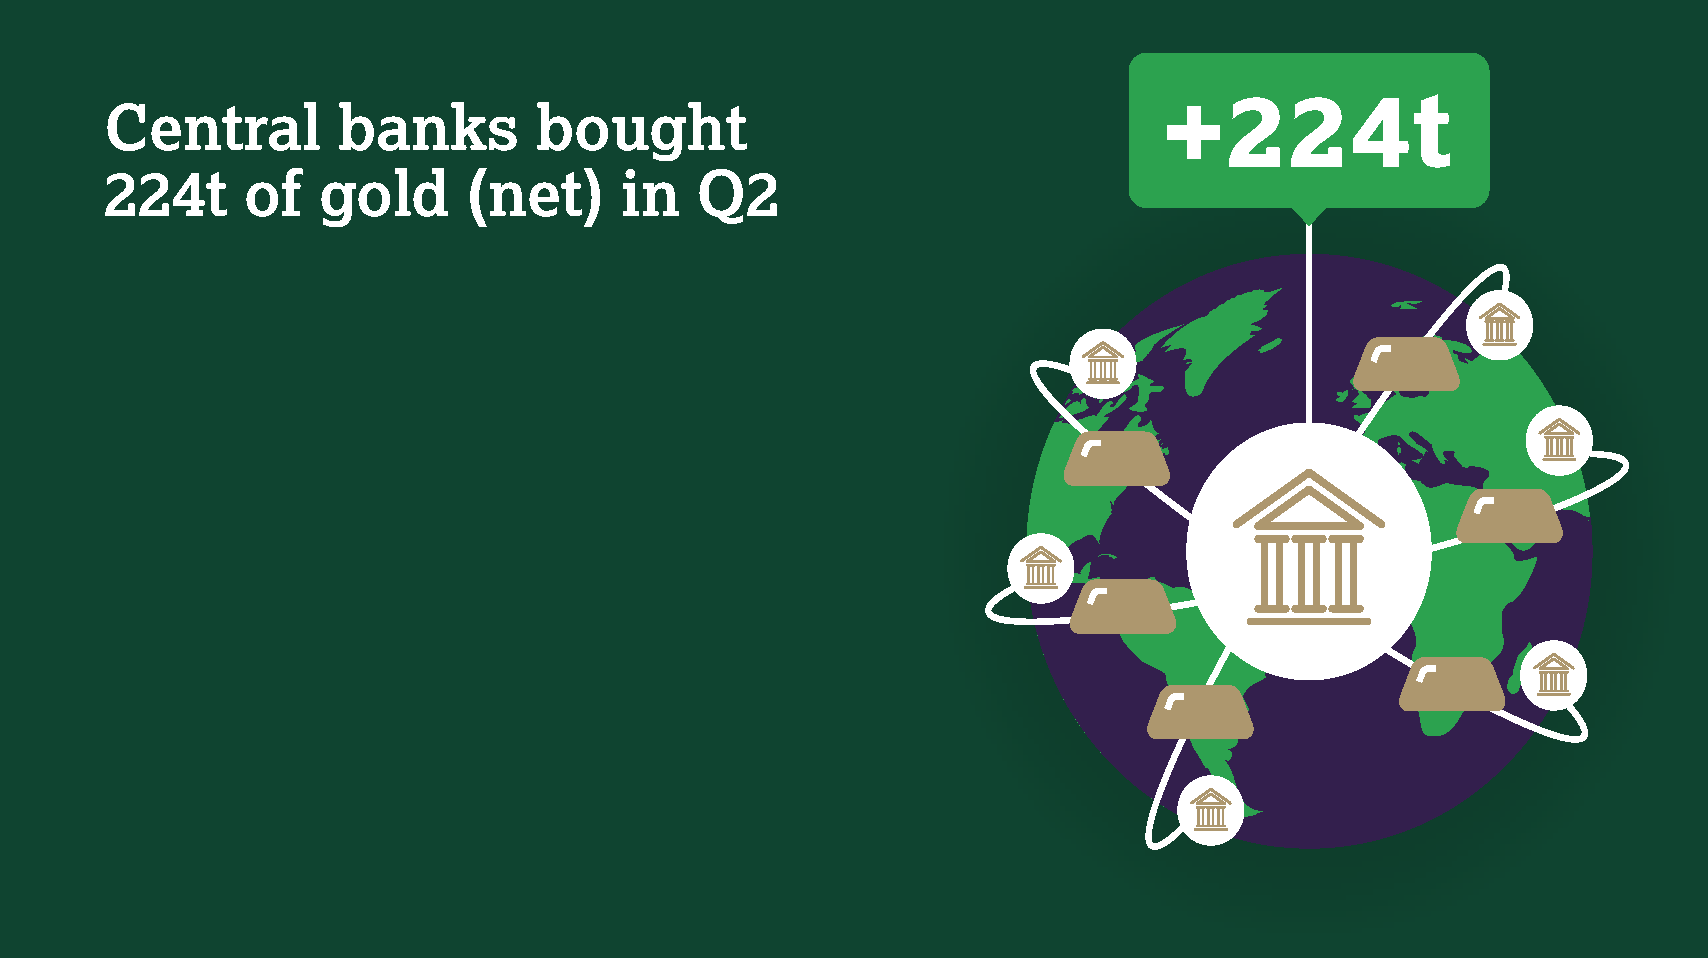
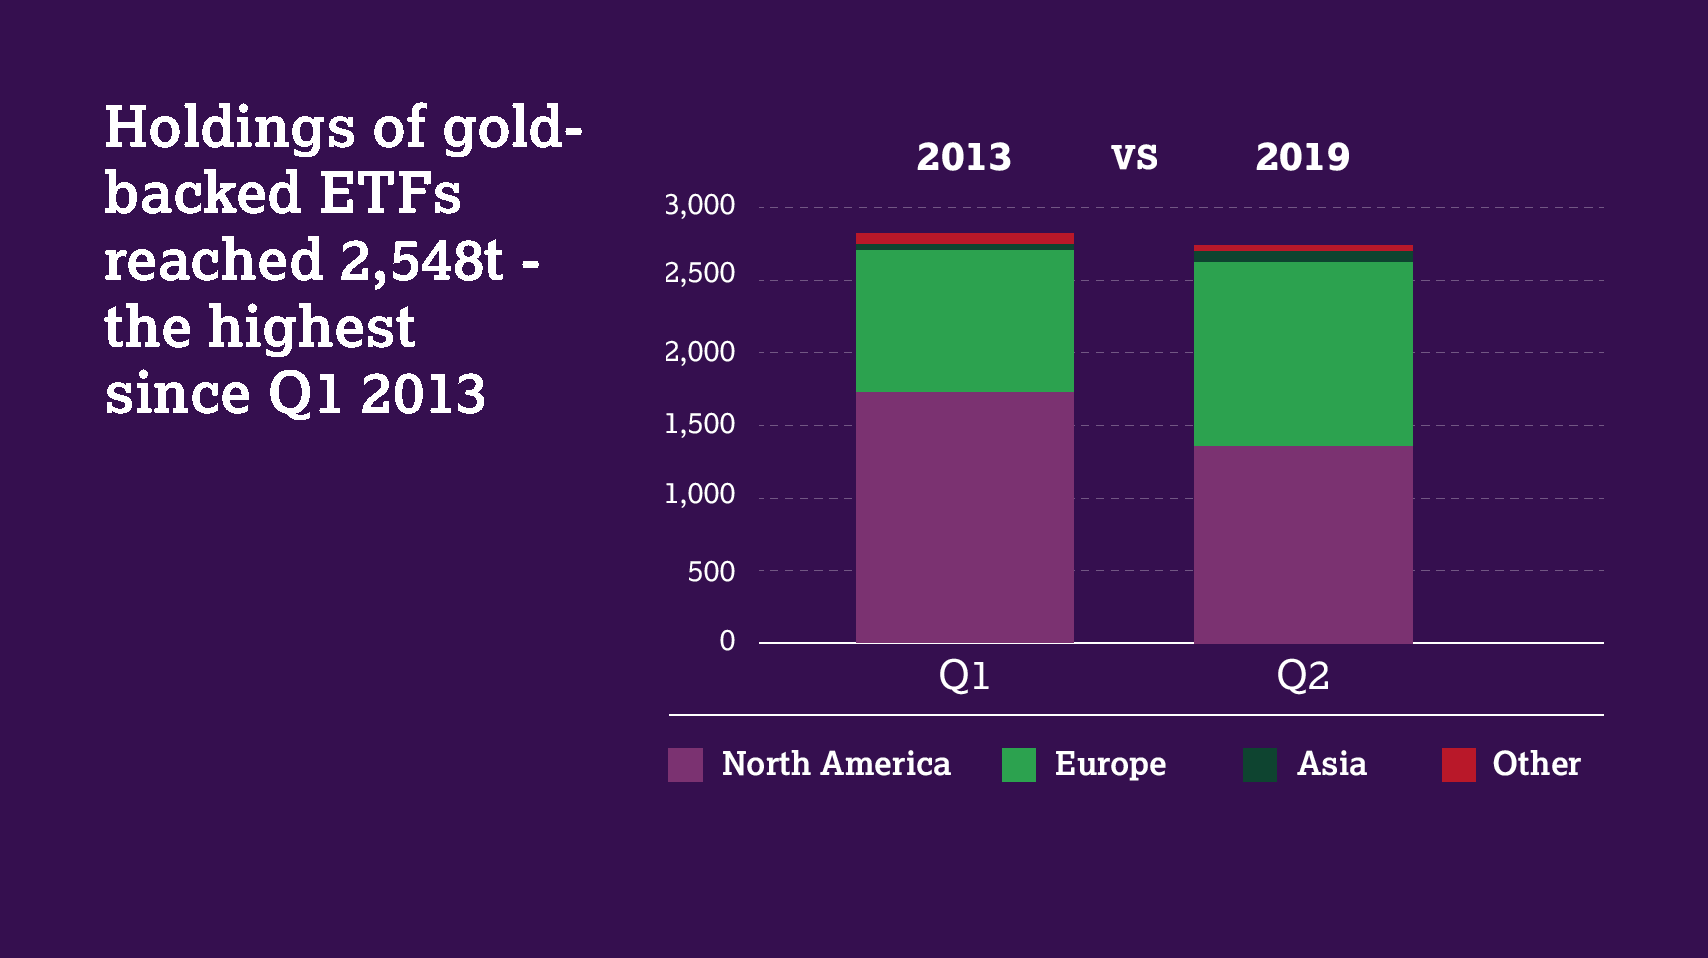
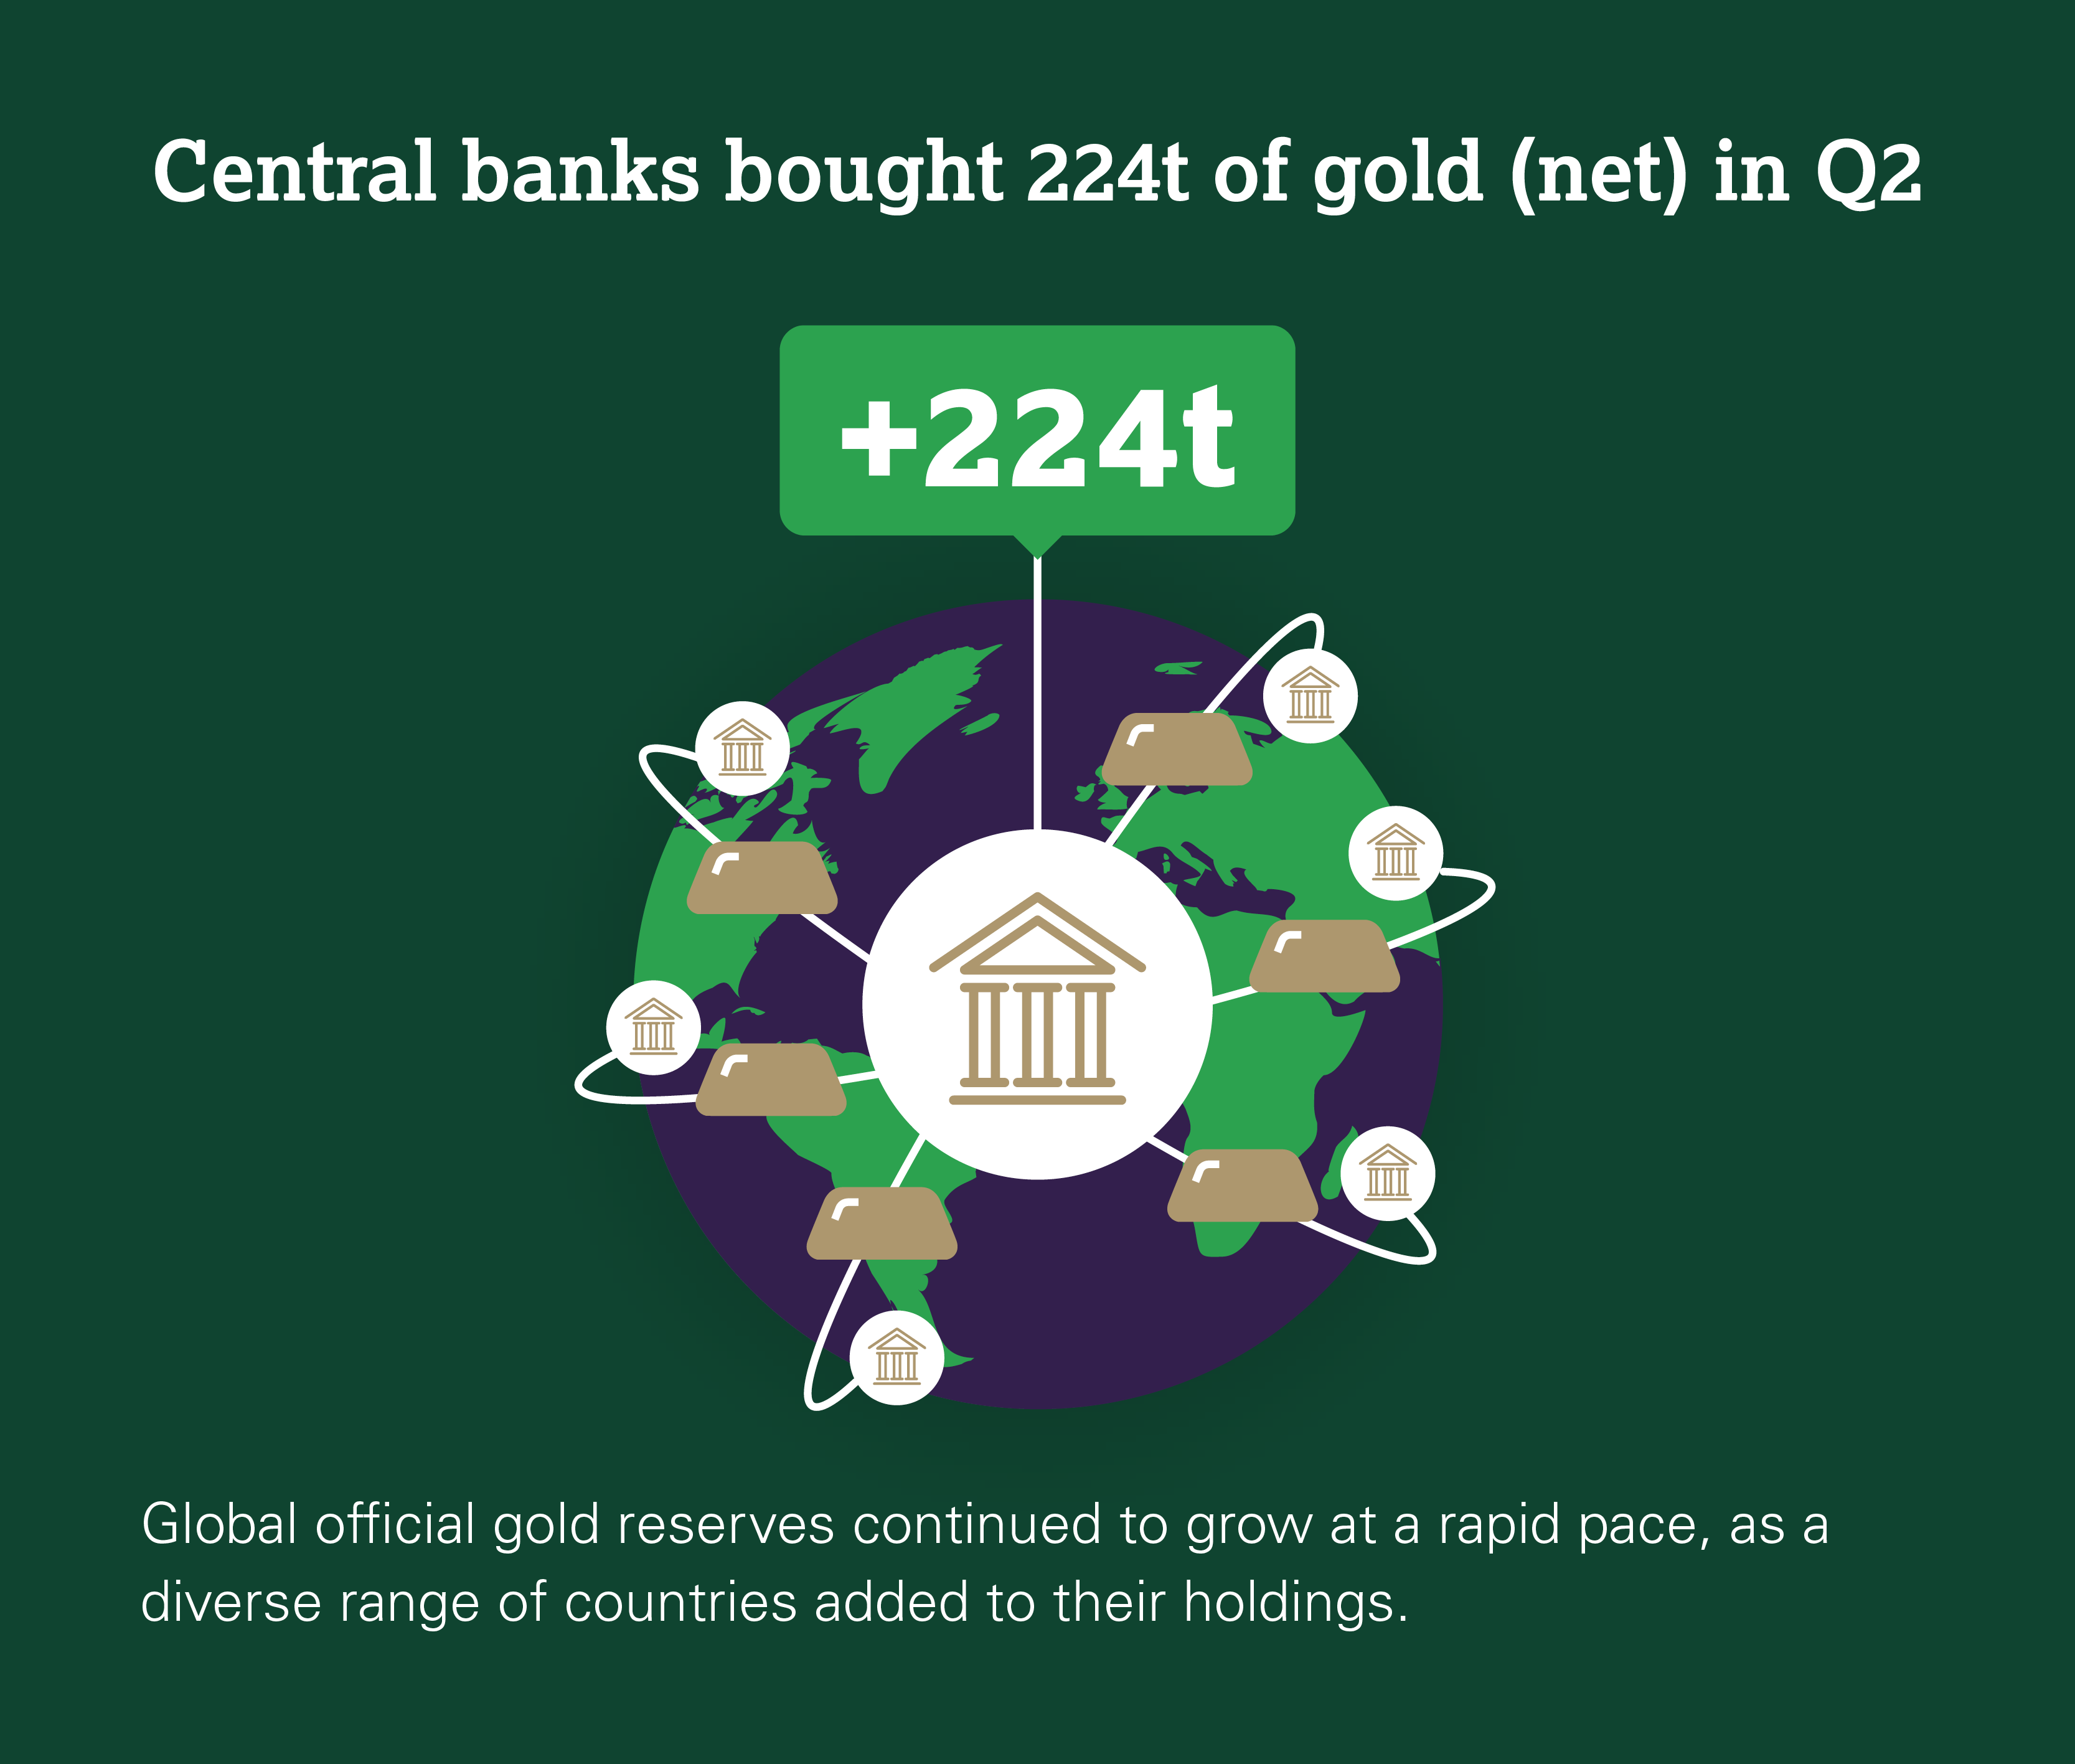
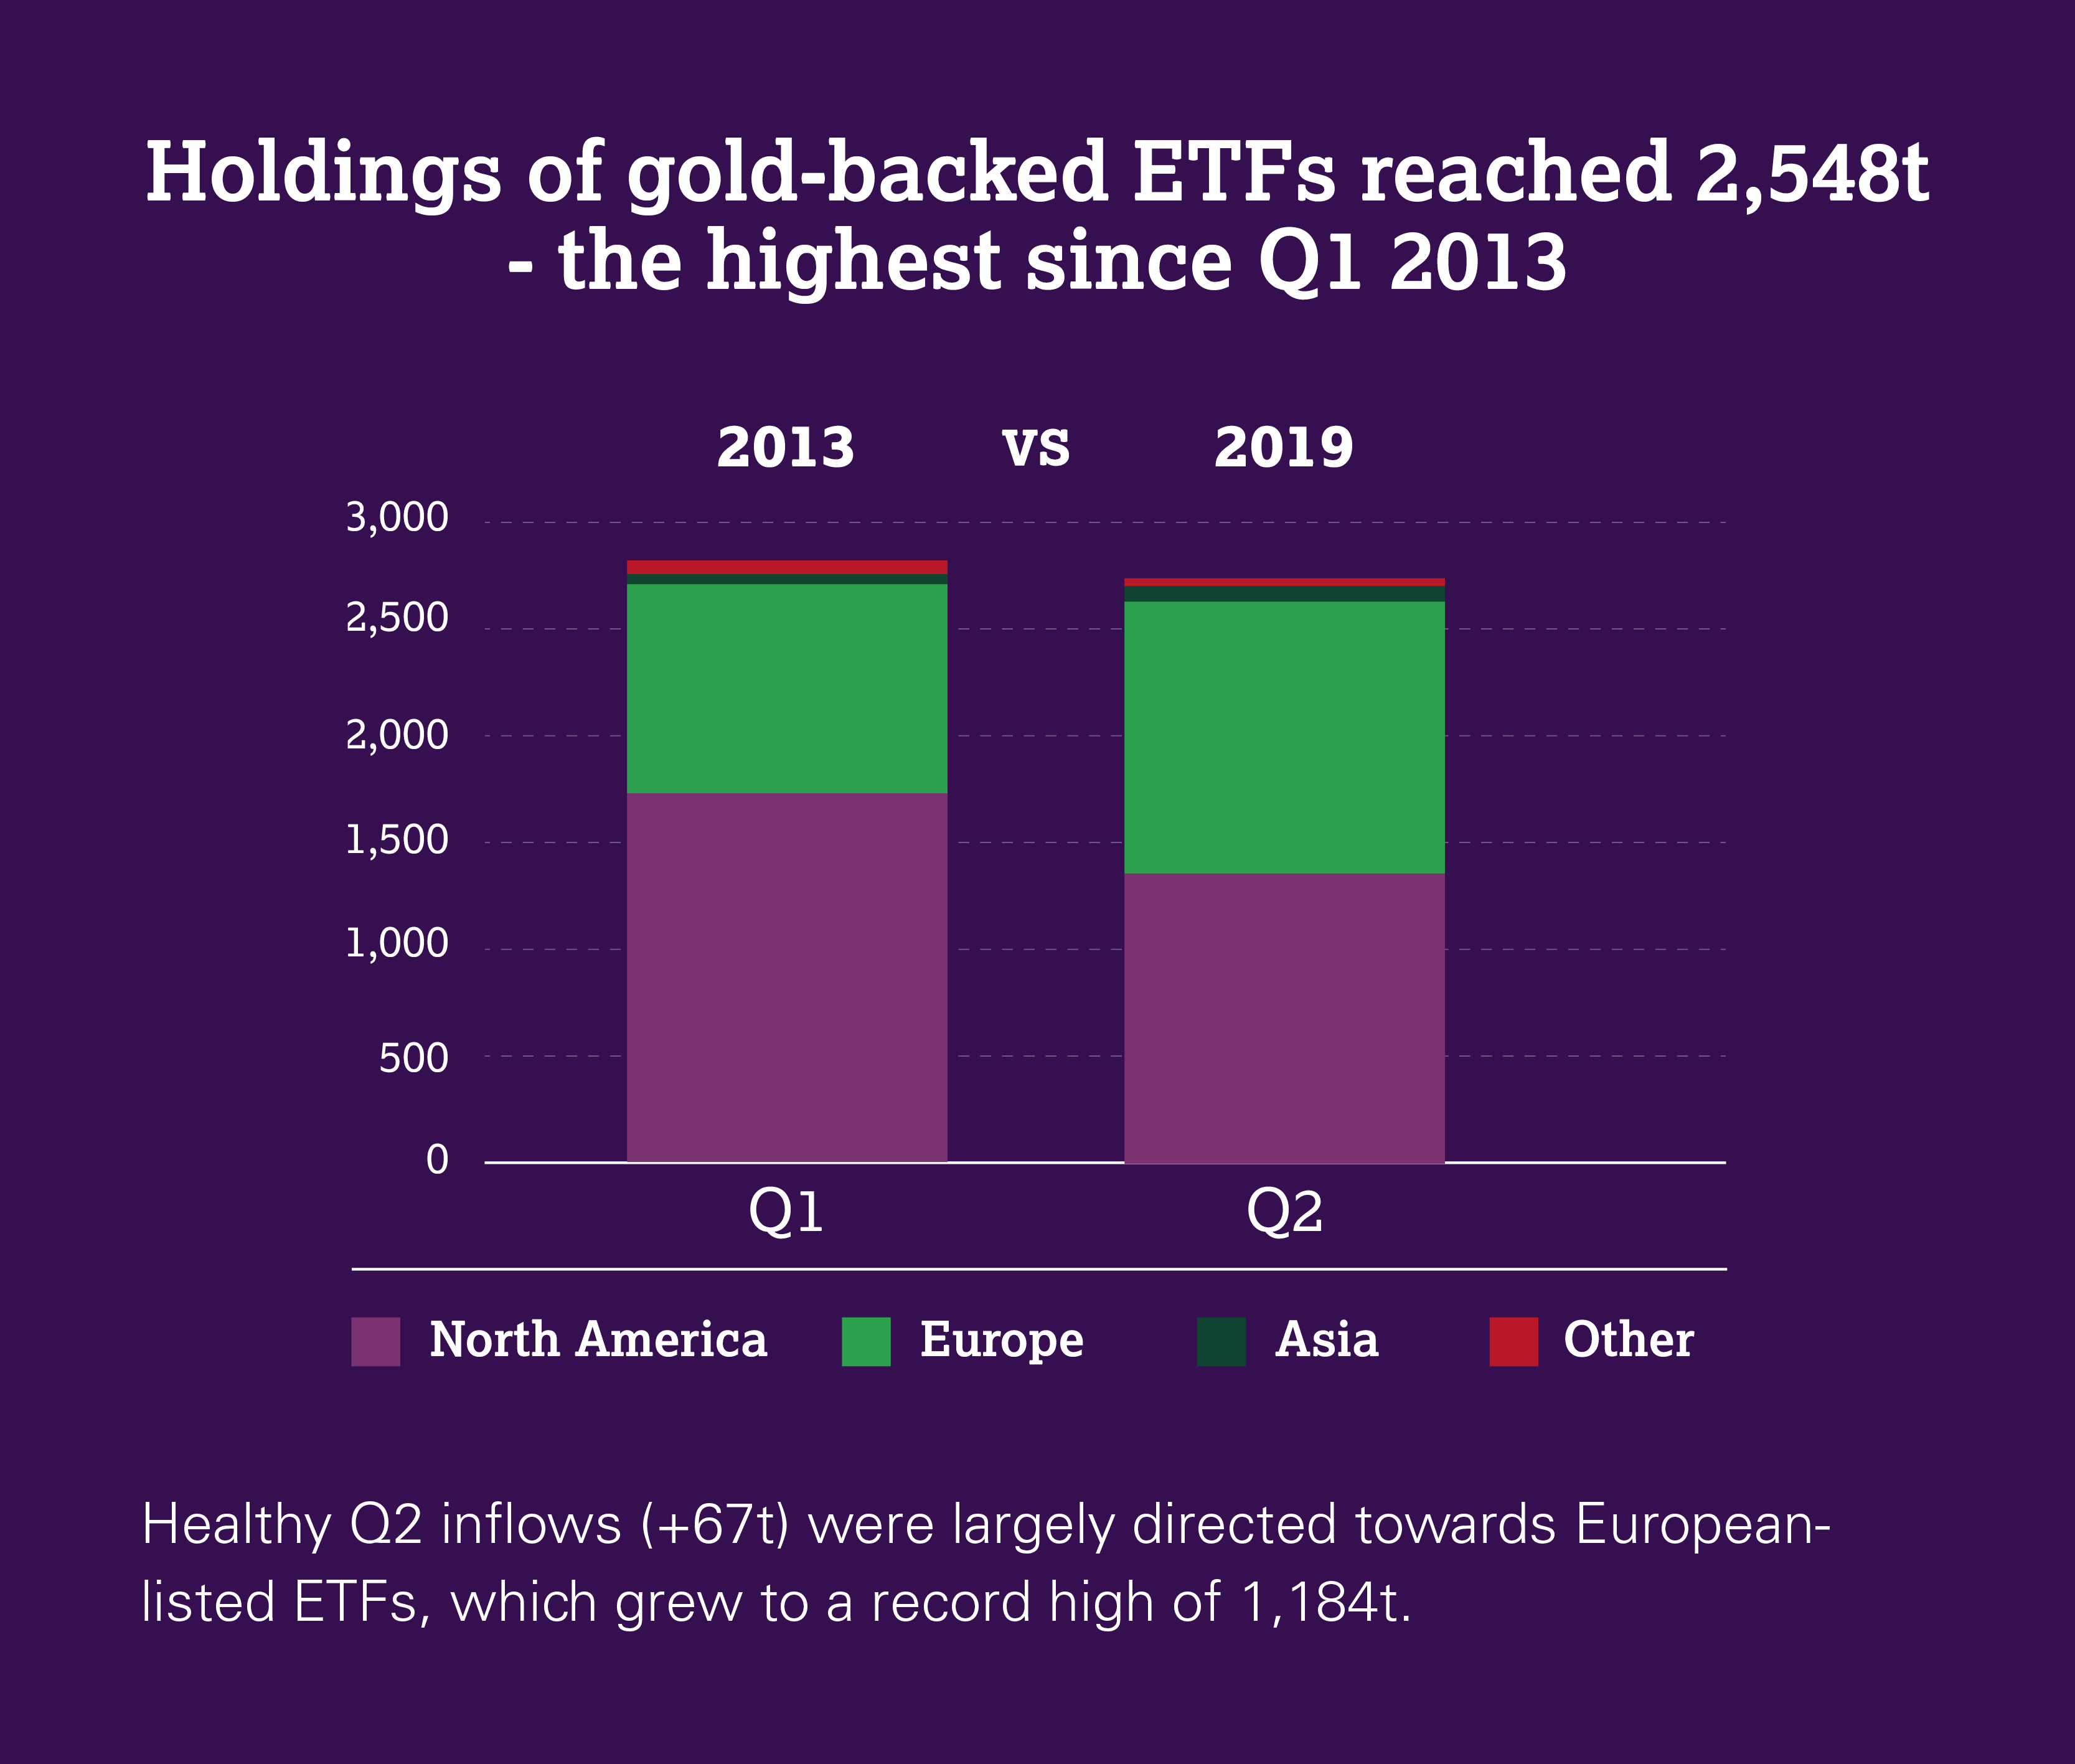
Central bank buying and ETF inflows boosted H1 demand

Gold demand was 1,123t in Q2, up 8% y-o-y. H1 demand jumped to a three-year high of 2,181.7t, largely due to record-breaking central bank purchases.

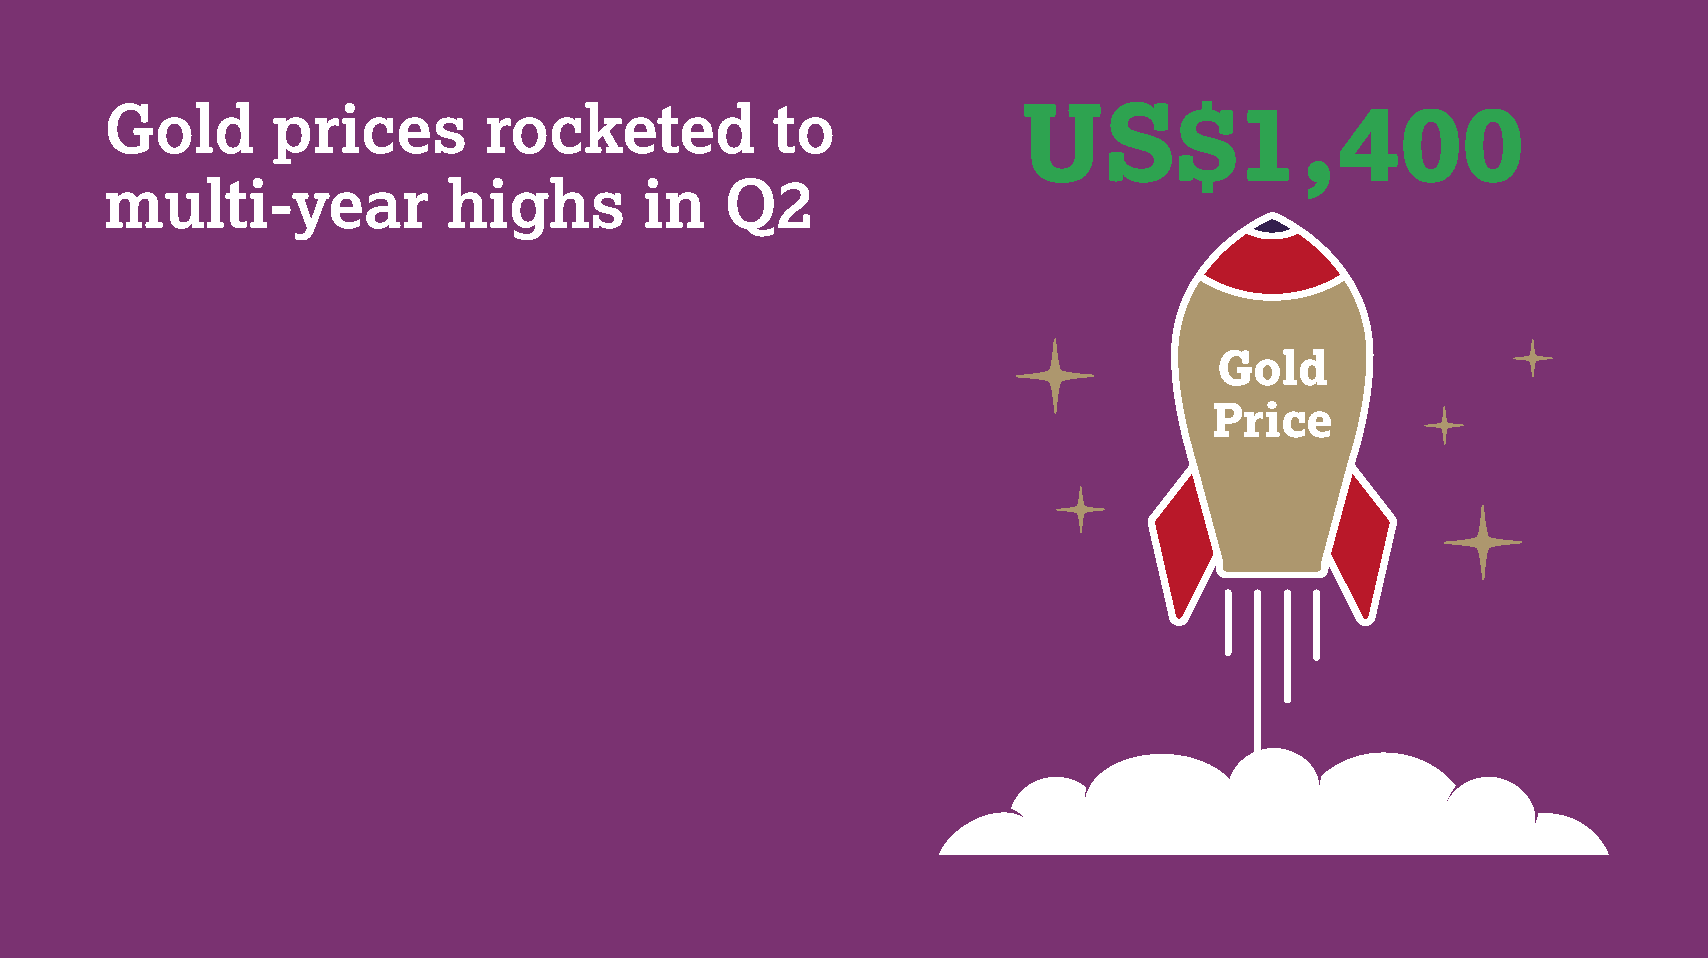
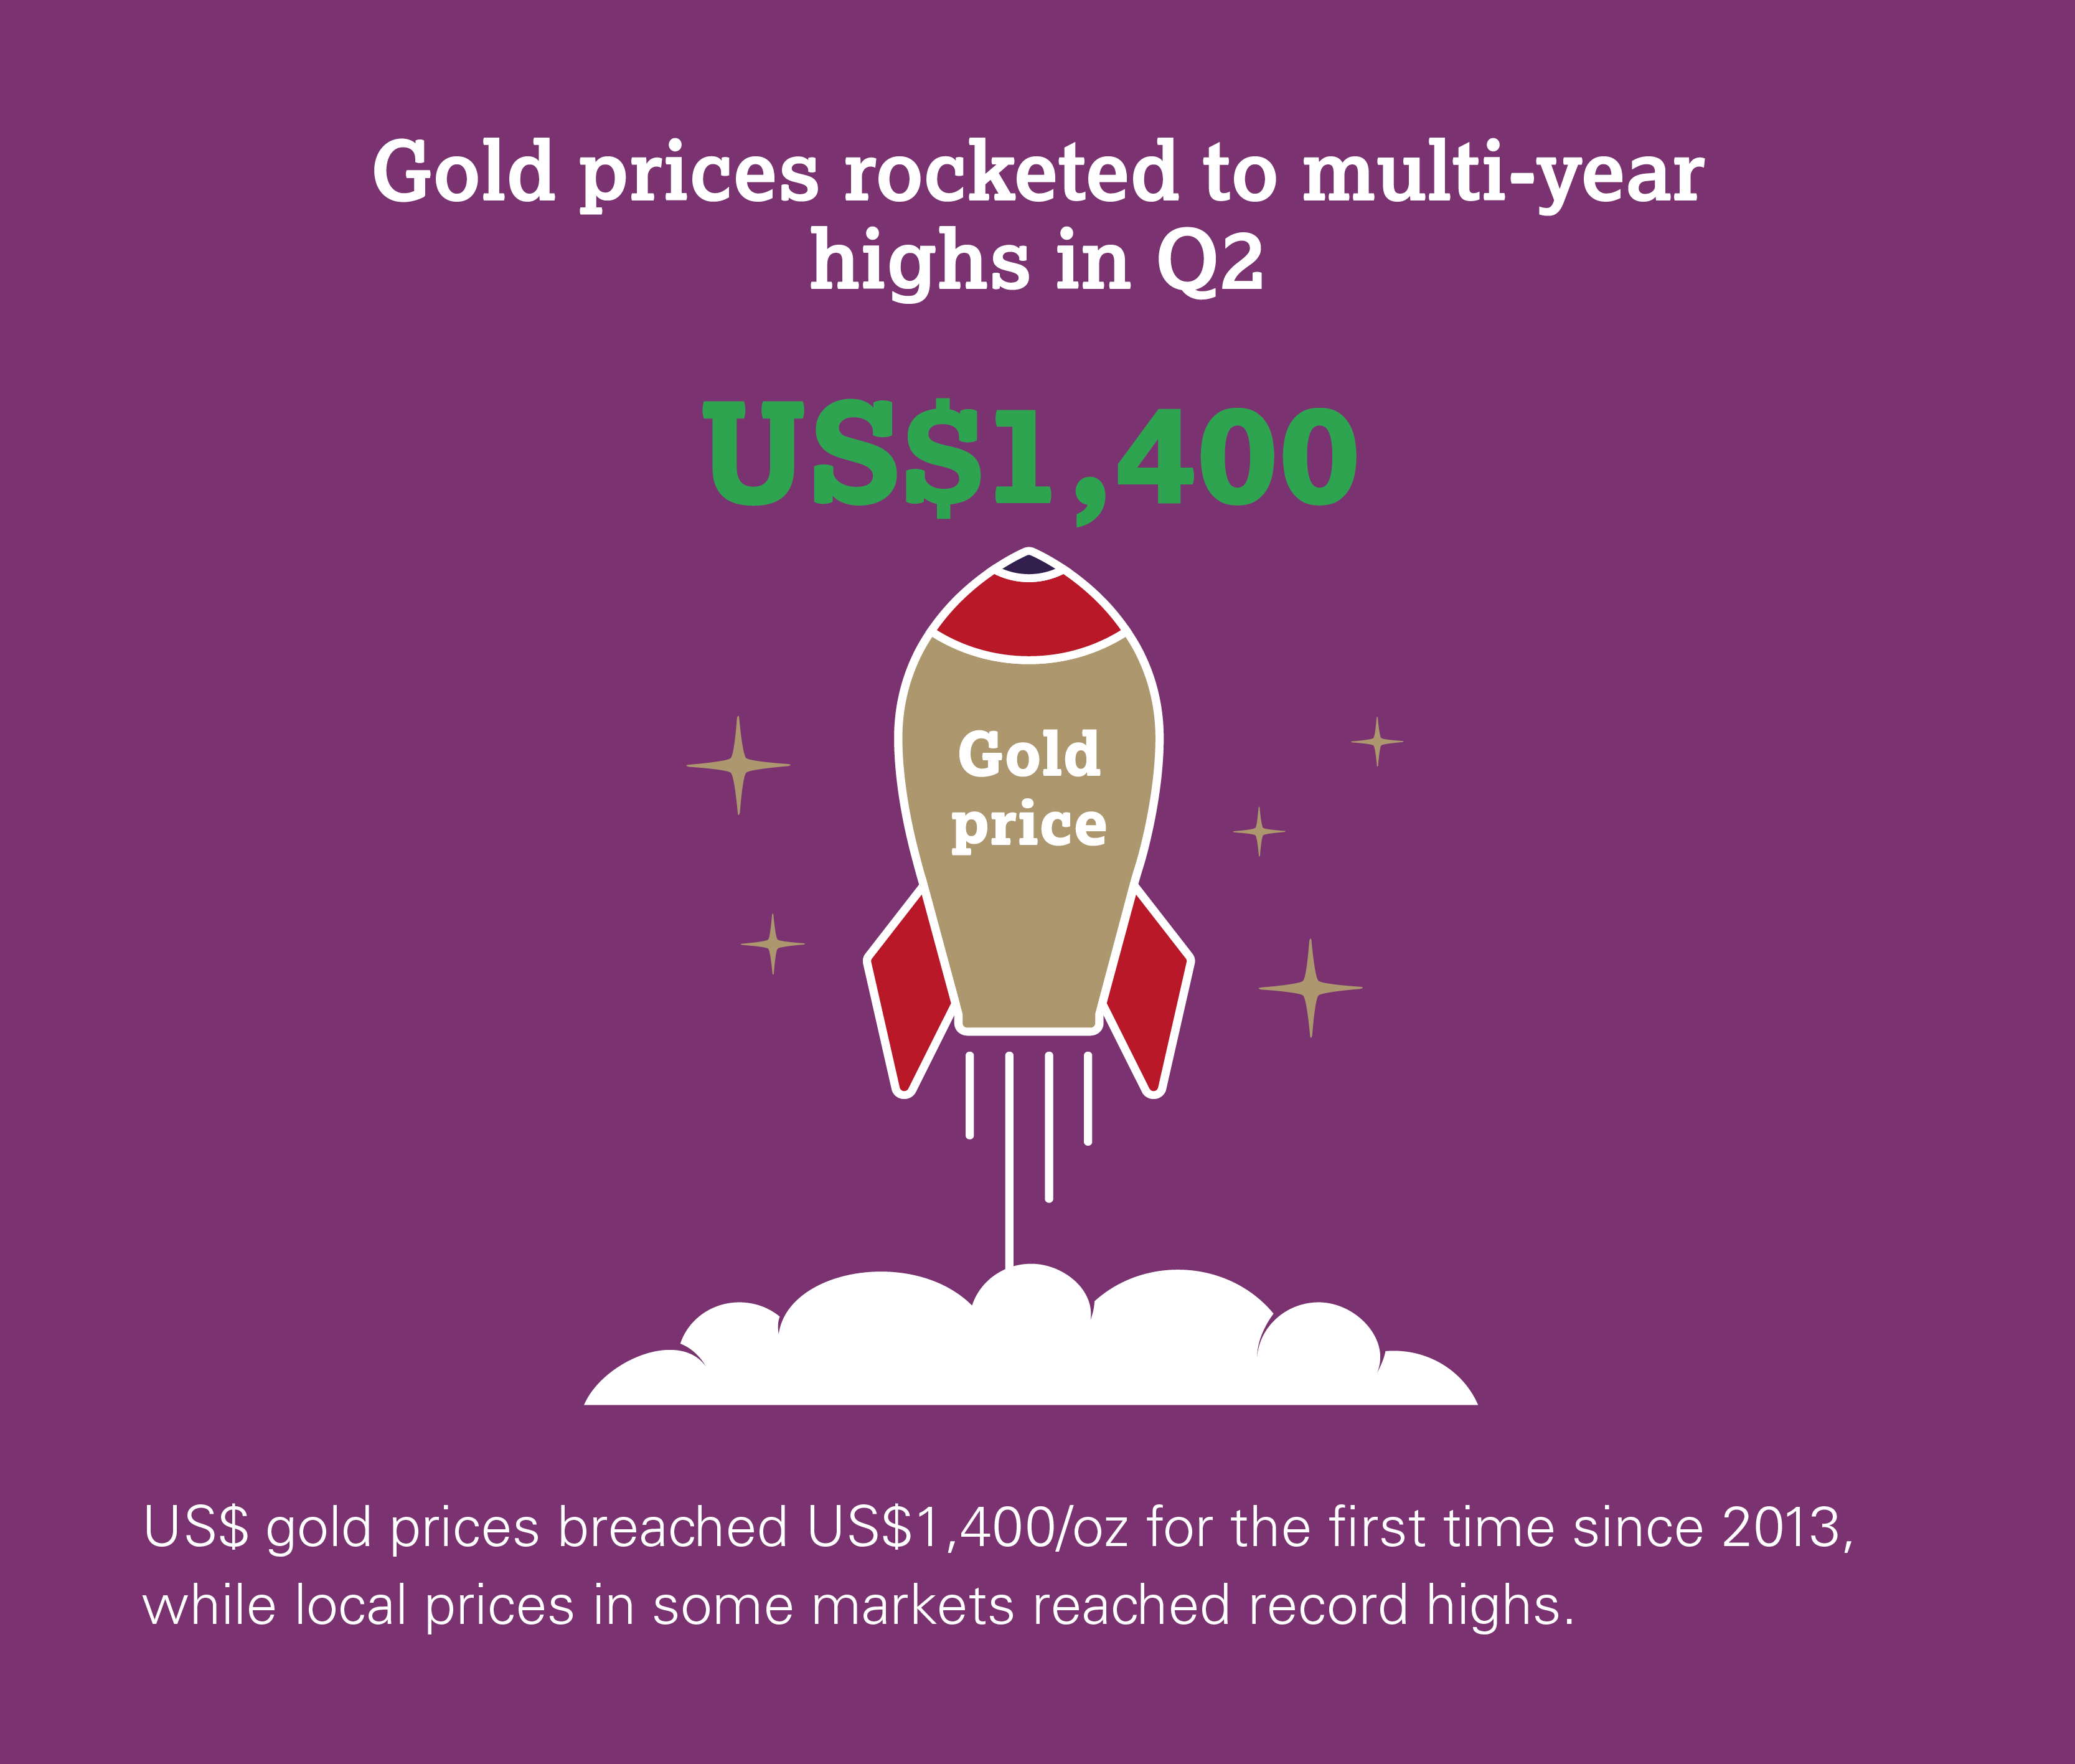
Central bank buying and healthy ETF inflows were the driving forces behind gold demand throughout the first half of 2019. Growth in H1 jewellery demand was largely the product of a more positive environment for Indian consumers. Shifts in bar and coin investment were very much price-related: as the gold price powered its way to multi-year highs, profit-taking kicked in and retail investment all but dried up. The technology sector reduced its usage of gold due to challenging global conditions, although the outlook is for this element of demand to establish something of a floor over coming quarters. Solid growth in both mine production and recycling fed into a 2% increase in total H1 gold supply. 


H1 gold demand boosted to a three-year high by record central bank buying

Gold demand for H1 hit a three-year high, boosted by record central bank buying

Sources: Metals Focus, Refinitiv GFMS, World Gold Council; Disclaimer

Highlights

Central banks bought 224.4t of gold in Q2 2019. This took H1 buying to 374.1t – the largest net H1 increase in global gold reserves in our 19-year quarterly data series. Buying was again spread across a diverse range of – largely emerging market – countries.

Holdings of gold-backed ETFs grew 67.2t in Q2 to a six-year high of 2,548t. The main factors driving inflows into the sector were continued geopolitical instability, expectation of lower interest rates, and the rallying gold price in June. 

A strong recovery in India’s jewellery market pushed demand in Q2 up 12% to 168.8t. A busy wedding season and healthy festival sales boosted demand, before the June price rise brought it to a virtual standstill. Indian demand drove global jewellery demand 2% higher y-o-y to 531.7t.

Bar and coin investment in Q2 sank 12% to 218.6t. Combined with the soft Q1 number, the H1 total ended at a ten-year low of 476.9t. A 29% y-o-y drop in China accounted for much of the global Q2 decline.

Gold supply grew 6% in Q2 to 1,186.7t. A record 882.6t for Q2 gold mine production and a 9% jump in recycling to 314.6t – boosted by the sharp June gold price rally – led the growth in supply. H1 supply reached 2,323.9t – the highest since 2016. 

Gold prices shot to multi-year highs. The gold price broke through US$1,400/oz for the first time since 2013. Among the factors driving this rally were expectations of lower interest rates and political uncertainty, with further support coming from strong central bank buying. 

Disclaimer [+]Disclaimer [-]