Gold fell in October, likely on asset rotation, de-grossing and Fed rate-path repricing.
Looking ahead
The post-2011 downturn is a poor parallel for the current 25% drop from the January 2026 high. The conditions for gold to recover are much stronger. Our framework shows that we may be nearing an interim bottom.
When the leverage breaks
Gold finished October at US$3,913/oz, down 6.3% m/m, with declines across all the major currencies we track (Table 1).
Our Gold Return Attribution Model (GRAM) suggests that lower yields supported gold in October. But gold and yields moved in the same direction during the month, an unusual pattern that GRAM doesn’t capture. Three factors likely drove this: Fed rate-path repricing, speculative de-grossing1, and a temporary rotation from equities and gold into bonds, as stocks fell and credit spreads widened. Much of the selling may have been derivatives-led.
COMEX managed money net positions fell US$7bn (53t) in October, following a larger drop in September. However, open interest dropped more, as non-reportable and spreading net positions fell during the last week of October. This contributed to the negative residual in our model.
Global gold ETFs defied the price decline, registering US$2bn (16t) of inflows. Europe led, followed by Asia while North America posted a small decline.
Chart 1: Gold fell on a rotation into bonds and outflows from North American ETFs and COMEX futures positions
GMC Oct 2026: Chart 1
Sources:
Bloomberg,
World Gold Council; Disclaimer
Data to 30 October 2026. Our Gold Return Attribution Model (GRAM) is a multiple regression model of monthly gold price returns, which we group into four key thematic driver categories of gold’s performance: economic expansion, risk & uncertainty, opportunity cost, and momentum. These themes capture motives behind gold demand; most importantly, investment demand, which is considered the marginal driver of gold price returns in the short run. The ‘residual’ represents the percentage change in the gold price that is not explained by factors already included. Model estimated over a five year rolling window.
Table 1: October returns were negative in all major currencies
USD (oz)
EUR (oz)
JPY (g)
GBP (oz)
CAD (oz)
CHF (oz)
INR (10g)
RMB (g)
TRY (oz)
AUD (oz)
October price*
3,913
3,509
19,809
2,923
5,463
3,226
139,830
854
195,460
5,567
October return*
-6.3%
-4.7%
-6.2%
-7.2%
-8.0%
-7.5%
-5.3%
-5.9%
-4.5%
-7.4%
Y-t-d return*
-10.4%
-5.6%
-9.8%
-9.8%
-8.6%
-6.7%
5.4%
-12.2%
4.2%
-14.6%
Record high price*
5,405
4,546
26,889
3,964
7,291
4,141
175,231
1,248
234,762
7,668
Record high date*
29-Jan-26
02-Mar-26
02-Mar-26
02-Mar-26
29-Jan-26
29-Jan-26
29-Jan-26
29-Jan-26
29-Jan-26
29-Jan-26
*Data as of 30 October 2026 Source: Bloomberg, LBMA price PM, World Gold Council
Where floor art thou?
Our simple framework suggests gold may be nearing an interim bottom: two of three conditions are in place
More importantly, unlike in 2011, the macro backdrop supports a recovery.
With the spot gold price around 25% below its January all-time high, a persistent question from investors is whether we are close to a floor. Naturally, this is difficult to answer. For many commodities, the economics of primary supply provide part of the answer, but not for gold. A measure of fair value could offer a useful reference point, but as it is with equities, fair value is a poor timing tool.
So rather than nail down a precise floor, we posed the question: what conditions were historically in place when gold recovered during a downtrend?
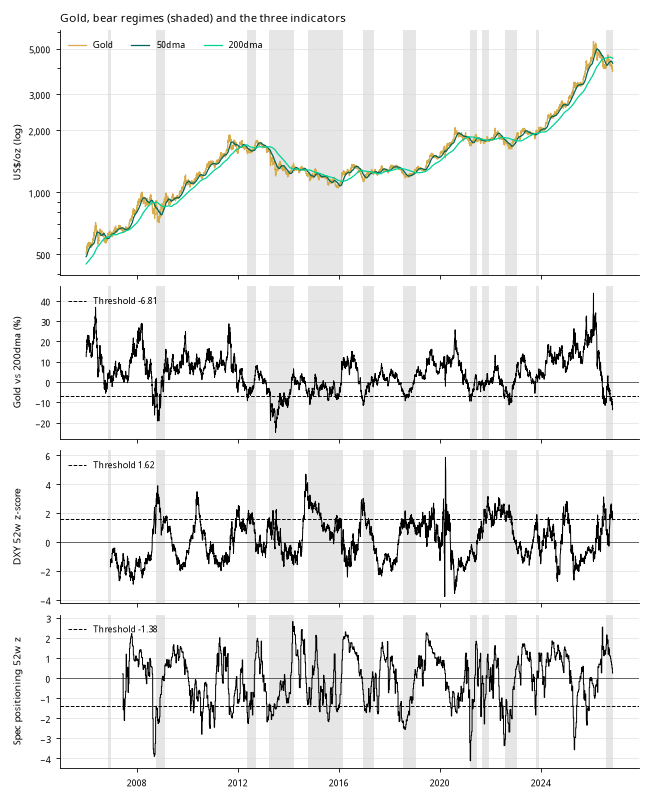
We focused on bear regimes over the past 20 years2, defined as periods when gold's 50-day moving average has stayed below its 200-day average for at least a month. We tested a broad set of candidate indicators3. Three stood out, each capturing a different part of a sell-off; in each case, a signal ‘fires’ when its reading is among the most extreme 30% of bear-regime months:
Dislocation: gold trading well below its 200-day moving average. This measures how stretched the sell-off has become.
Dollar strength: a sharp rally in the US dollar (DXY) relative to the past 52 weeks. When gold has fallen because the dollar has spiked, the weakness has tended to be temporary, reflecting perhaps currency moves rather than weaker gold demand.
Positioning washout: speculative futures positions - combining managed money and smaller traders - falling to unusually low levels relative to open interest. Rallies need fuel, and once the weaker speculative holders have sold, there are fewer sellers left.
On its own, gold trading well below trend has been a reasonable but imperfect guide to forward performance. Forward returns improved materially when the sell-off was accompanied by a dollar spike and a clear-out in speculative positioning. Historically, when all three conditions were met, gold was higher three months later in every case (Table 2). That said, the sample is small with just five episodes. But at least two of the three provides some confidence in positive forward returns.
Table 2: The floor is yours
Analysis of indicator performance since 2005*
Condition
N
Median
% positive
All bear months
24
3.2%
63%
At least 2 of 3
10
4.2%
90%
3 of 3
5
9.8%
100%
▽
Date
3m gold return
Oct-08
28.2%
May-12
8.4%
Nov-15
16.3%
Dec-16
8.9%
Sep-22
9.8%
*Data from 27 December 2005 to 28 October 2026. Indicators are calculated from daily data (weekly for CFTC positioning) and sampled at month-end, December 2005 to October 2026. Bear regime: 50-day moving average below the 200-day for 20+ consecutive trading days. A signal fires when its reading is in the most extreme 30% of bear-regime months. Returns are three-month forward gold returns, using signals at least three months apart. Sources: Bloomberg, World Gold Council
Are we there yet?
Today, two of the three conditions are in place (Figure 1). Gold is trading well below its 200-day average and the dollar has rallied into its top tier. Positioning, however, remains elevated. Speculative froth has not yet been fully cleared, and - consistent with past corrections - a further shake-out in futures positioning would need to take place before a more durable recovery can take hold.
Figure 1: Two out of three ain’t bad
Gold price, bear regimes and indicator levels*
*Data to 28 October, except positioning which is 27 October. Source: Bloomberg, World Gold Council
Indicators are useful, but context matters more
It's important to note that this framework only speaks to the next three months. It says nothing about the year ahead, or whether a durable uptrend resumes. That rests on the broader strategic case for gold.
On that front, the macroeconomic and fundamental context arguably matters more. Some investors may look to the 2011 peak as a parallel. But to us, that comparison is misplaced. The post-2011 multi-year sell-off came amid conditions that were far less favourable for gold, as Table 3 shows.
The fundamental backdrop increases the likelihood that this is a correction rather than the start of a prolonged downtrend. That said, our simple framework suggests the setup is not yet complete. And while the path of least resistance for many of the factors in Table 3 is favourable over the medium term, they could move against gold in the short term, particularly given event risks in Q4 from policy decisions and geopolitical triggers.
For investors watching from the sidelines, the signal to look for is a clear-out in positioning. If that comes while the other two conditions hold, the current set-up would match the episodes that have historically marked attractive entry points. Other technical indicators tell a similar story.
Table 3: 2011 parallel is misplaced; now vs then.
Variable
Sep-11
Oct-26
Context
10-year TIPS yield (%)
0.1
2.6
In 2011, real yields were near zero leaving little room to fall, and rose sharply in 2013. Today they are in restrictive territory, with more room to fall
High-yield spread over 10-year Treasuries (%)
7.6
3.3
Spreads had blown out amid the European sovereign debt crisis and had room to tighten. Today they are tight
US dollar REER
82.3
106
The US dollar had fallen 18% from its June 2010 high to a trough in April 2011, leaving room to rally. Today the dollar is expensive
Stock-bond correlation, 52 weeks (weekly return)
-0.6
0.2
Bonds were a reliable hedge for equity weakness. Today they are less so
Long-term inflation expectations were anchored below the Fed's (then informal) 2% target. Today they are rising
Geopolitical risk (GPR index)
68
156
Geopolitical risk was well below today's levels
Central bank net buying (tonnes / year)
~500
~800
Central banks had returned to net buying, but at lower levels
US budget balance to GDP, % | unemployment rate, %
-8% | 9%
-6% | 4%
The deficit was large, but 9% unemployment justified it. Today unemployment is low but the deficit remains large
*Data as of 30 September 2011 and 28 October 2026. Stock-bond correlation uses S&P 500 and Bloomberg US Treasury index weekly returns. Inflation expectations from the Cleveland Fed (Inflation Expectations) Source: Bloomberg, World Gold Council
Other technicals tell a similar story
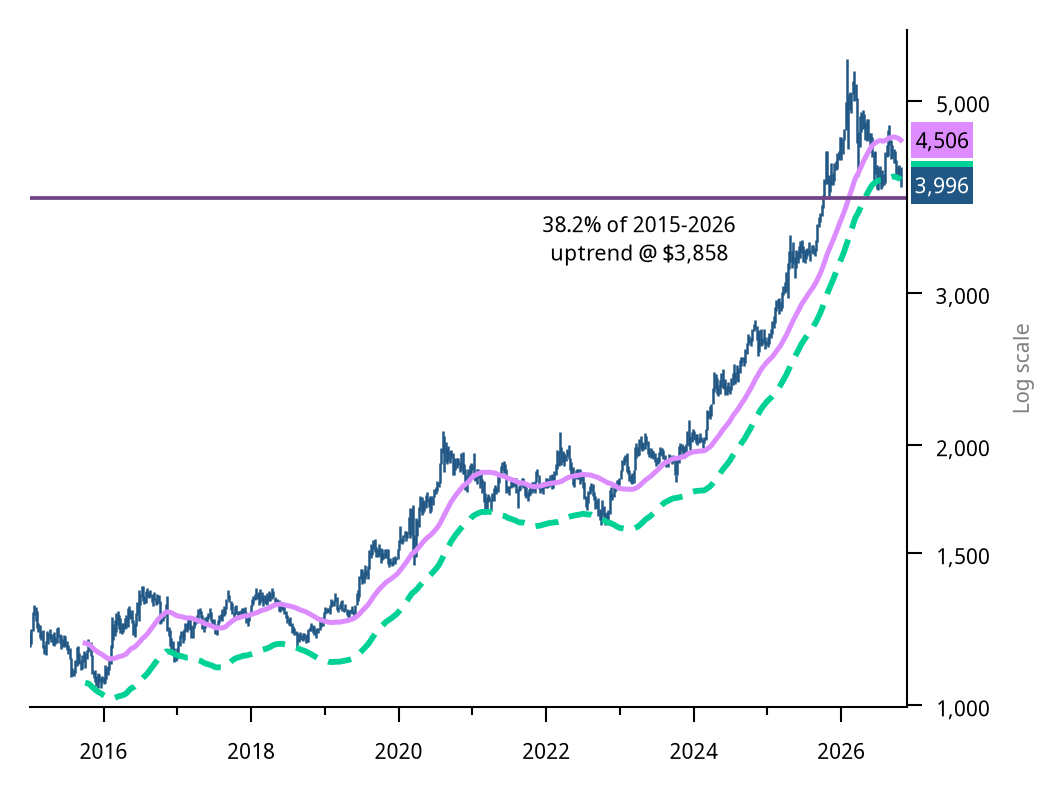
Technically gold has moved to what we typically identify as a downside “extreme” - 10% below its 200-day average - and remains above support from the 38.2% Fibonacci retracement of the entire rise from 2015 at US$3,857/oz (Figure 2).
This suggests that gold is in a location and condition where signs of a potentially important floor can be looked for. It does though still look premature to make this call as momentum continues to trend lower. This would suggest a test of US$3,857/oz may yet be seen, although that level would likely become an attractive entry point for investors.
Figure 2: Approaching attractive levels
Gold price with 10% envelope below 40-week average
*Data to 28 October 2026. 40-weeks is equivalent to 200 days. Source: Bloomberg, World Gold Council
In summary
This framework is not a trading rule and isn't meant to encourage tactical trading. We see it as a simple heuristic for judging whether a sell-off is starting to look stretched, based on a small number of episodes and a three-month horizon.
It suggests the setup for a recovery is building but not yet complete. The broader backdrop points to a correction rather than a repeat of the post-2011 downtrend – a parallel some investors are keen to draw.
Event risk over the rest of 2026 could still push gold either way. The policy outcomes of the US midterm elections are likely to be pivotal. And further cracks in equity markets and credit could make Treasuries more attractive, bringing back the unusual positive correlation between gold and yields we’ve witnessed over the past few weeks. But that rests on the inflation threat fading. And that isn’t clear either.
For strategic investors, averaging into weakness has historically made sense for an asset that has returned close to 9% a year since 1971. So the more useful question is not where the floor is, but whether weakness is becoming an increasingly attractive opportunity to add.
2Methodology: we focus on bear regimes because the signals behave differently depending on the trend. In an uptrend, a dip below trend, a firmer dollar or lighter positioning tends to signal a pause rather than an opportunity. It is only once a downtrend is established that these same conditions have marked capitulation and been followed by stronger recoveries. We use monthly data from 2005, 3-month forward returns, non-overlapping observations, thresholds set at the most extreme 30% of months; results robust at 20% and 40%.
3We tested gold’s RSI, 25-delta risk reversal, price relative to copper, Brent crude, Global equities and US Treasuries, US 2 and 10-year yields (including TIPS), M2 money supply, high-yield credit spreads and alternative positioning measures.
All references to LBMA Gold Price are used with the permission of ICE Benchmark Administration Limited and have been provided for informational purposes only. ICE Benchmark Administration Limited accepts no liability or responsibility for the accuracy of the prices or the underlying product to which the prices may be referenced. Other content is the intellectual property of the respective third party and all rights are reserved to them.
The use of the statistics in this information is permitted for the purposes of review and commentary (including media commentary) in line with fair industry practice, subject to the following two pre-conditions: (i) only limited extracts of data or analysis be used; and (ii) any and all use of these statistics is accompanied by a citation to World Gold Council and, where appropriate, to Metals Focus or other identified copyright owners as their source. World Gold Council is affiliated with Metals Focus.
The World Gold Council and its affiliates do not guarantee the accuracy or completeness of any information nor accept responsibility for any losses or damages arising directly or indirectly from the use of this information.
This information is for educational purposes only and by receiving this information, you agree with its intended purpose. Nothing contained herein is intended to constitute a recommendation, investment advice, or offer for the purchase or sale of gold, any gold-related products or services or any other products, services, securities or financial instruments (collectively, “Services”). This information does not take into account any investment objectives, financial situation or particular needs of any particular person.
Diversification does not guarantee any investment returns and does not eliminate the risk of loss. Past performance is not necessarily indicative of future results. The resulting performance of any investment outcomes that can be generated through allocation to gold are hypothetical in nature, may not reflect actual investment results and are not guarantees of future results. The World Gold Council and its affiliates do not guarantee or warranty any calculations and models used in any hypothetical portfolios or any outcomes resulting from any such use. Investors should discuss their individual circumstances with their appropriate investment professionals before making any decision regarding any Services or investments.
This information may contain forward-looking statements, such as statements which use the words “believes”, “expects”, “may”, or “suggests”, or similar terminology, which are based on current expectations and are subject to change. Forward-looking statements involve a number of risks and uncertainties. There can be no assurance that any forward-looking statements will be achieved. World Gold Council and its affiliates assume no responsibility for updating any forward-looking statements.
Information regarding the LBMA Gold Price
The LBMA Gold Price is used by the World Gold Council with permission under license by ICE Benchmark Administration Limited and is subject to the restrictions set forth here (www.gold.org/terms-and-conditions).
Information regarding QaurumSM and the Gold Valuation Framework
Note that the resulting performance of various investment outcomes that can be generated through use of Qaurum, the Gold Valuation Framework and other information are hypothetical in nature, may not reflect actual investment results and are not guarantees of future results. Neither World Gold Council (including its affiliates) nor Oxford Economics provides any warranty or guarantee regarding the functionality of the tool, including without limitation any projections, estimates or calculations.