Gold ETF Flows: October 2026

Europe remains in driver's seat

Published:

Highlights

  • Global gold ETFs continued to expand, adding US$2.7bn in October, led by European funds.
  • Global gold ETF holdings rose 19t to 4,275t, but their AUM fell 6% to US$542bn due to the lower gold price in the month.
  • Global gold market trading volumes pulled back, due mainly to cooling activity in exchange-traded derivatives. 

October in review 

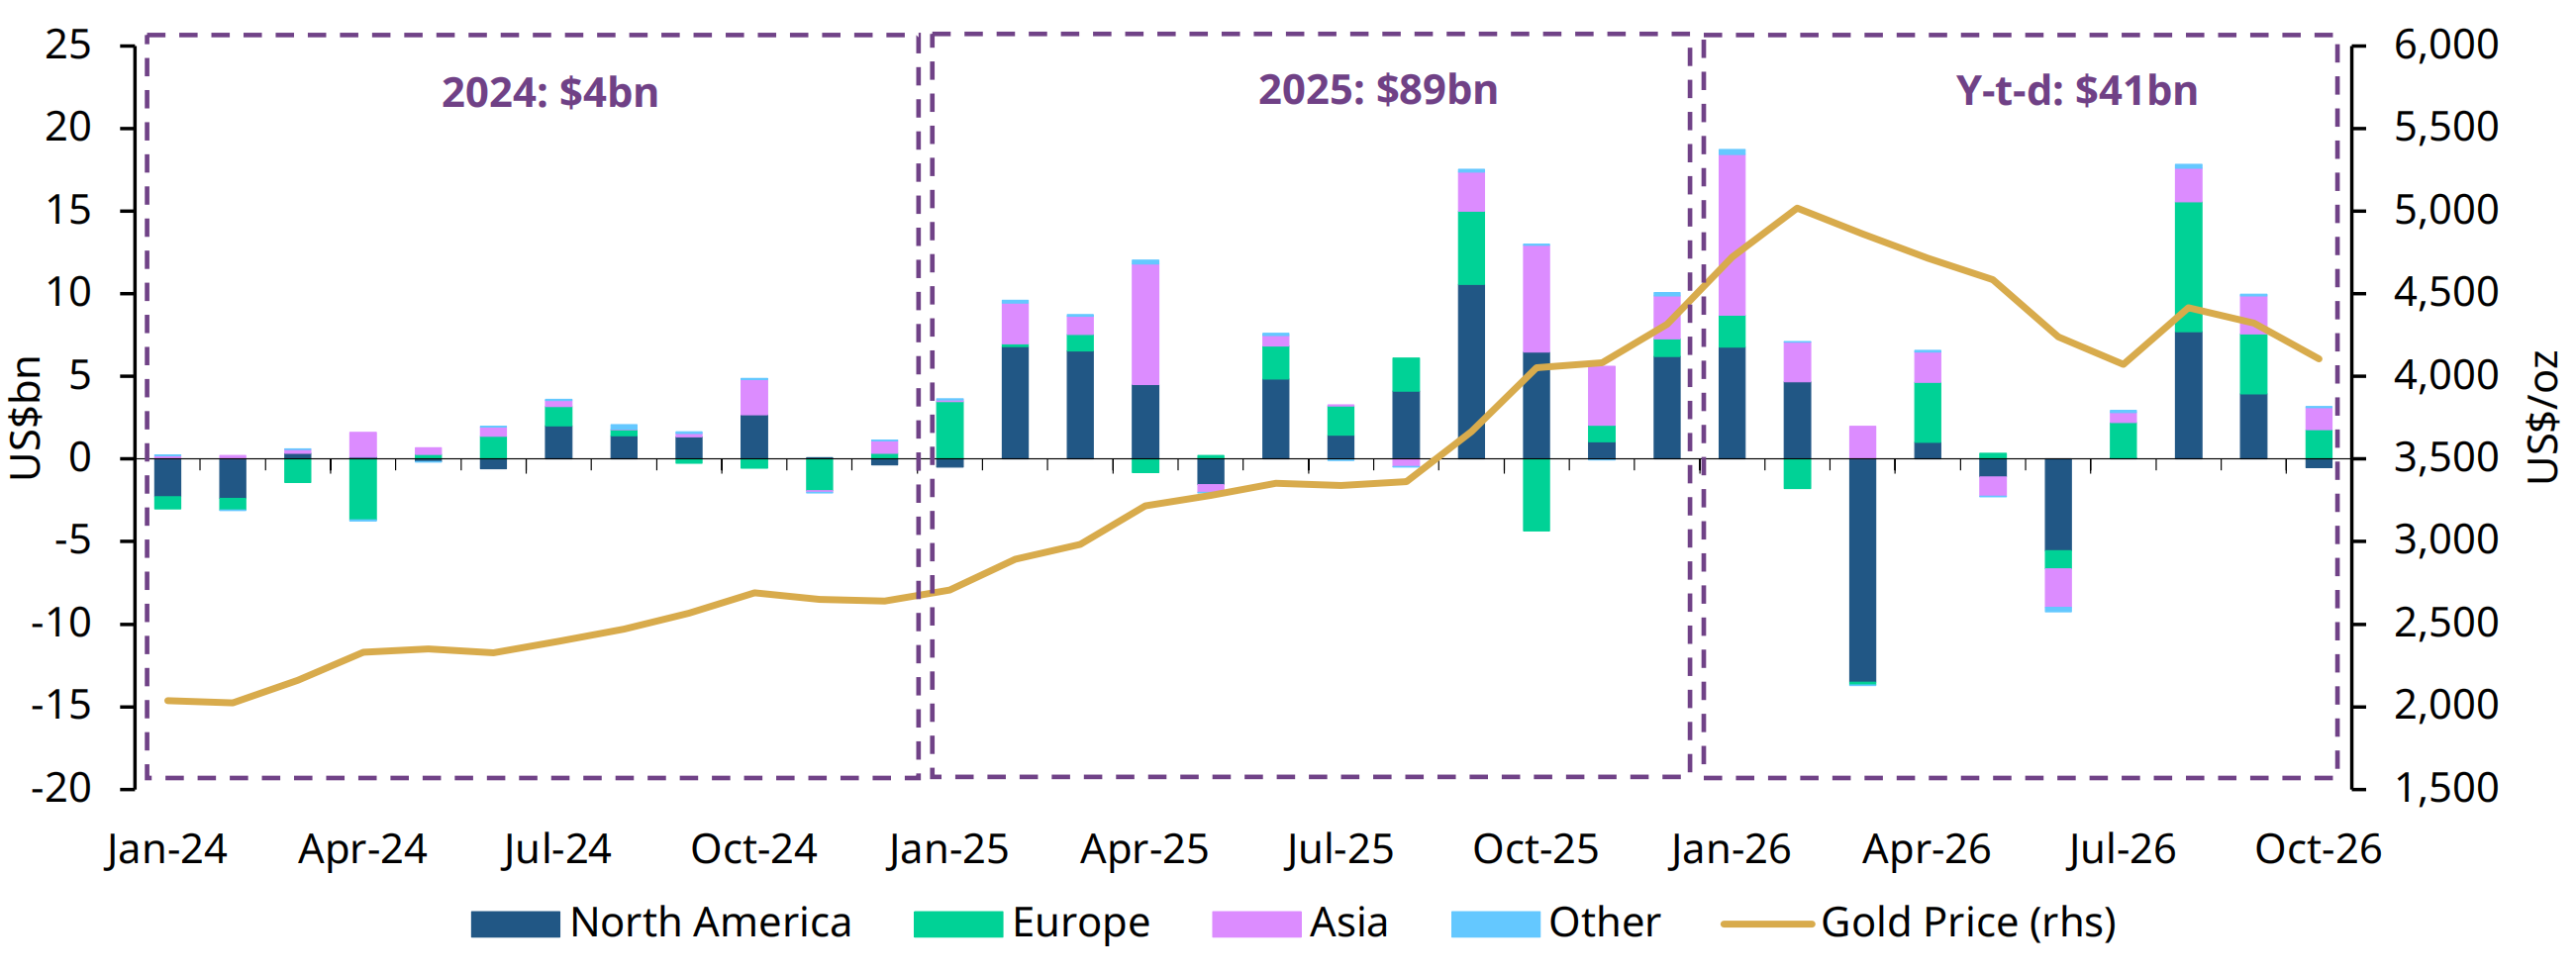
Global physically-backed gold ETFs1 attracted US$2.7bn in October, having expanded for four consecutive months (Chart 1). Notably, European funds led the charge with sizable inflows. Asian investors remained net buyers while North America saw marginal outflows. Global gold ETFs’ collective holdings climbed 19t to 4,275t, another month-end record. Meanwhile, assets under management (AUM) fell 6% to US$542bn as the lower gold price overshadowed inflows.

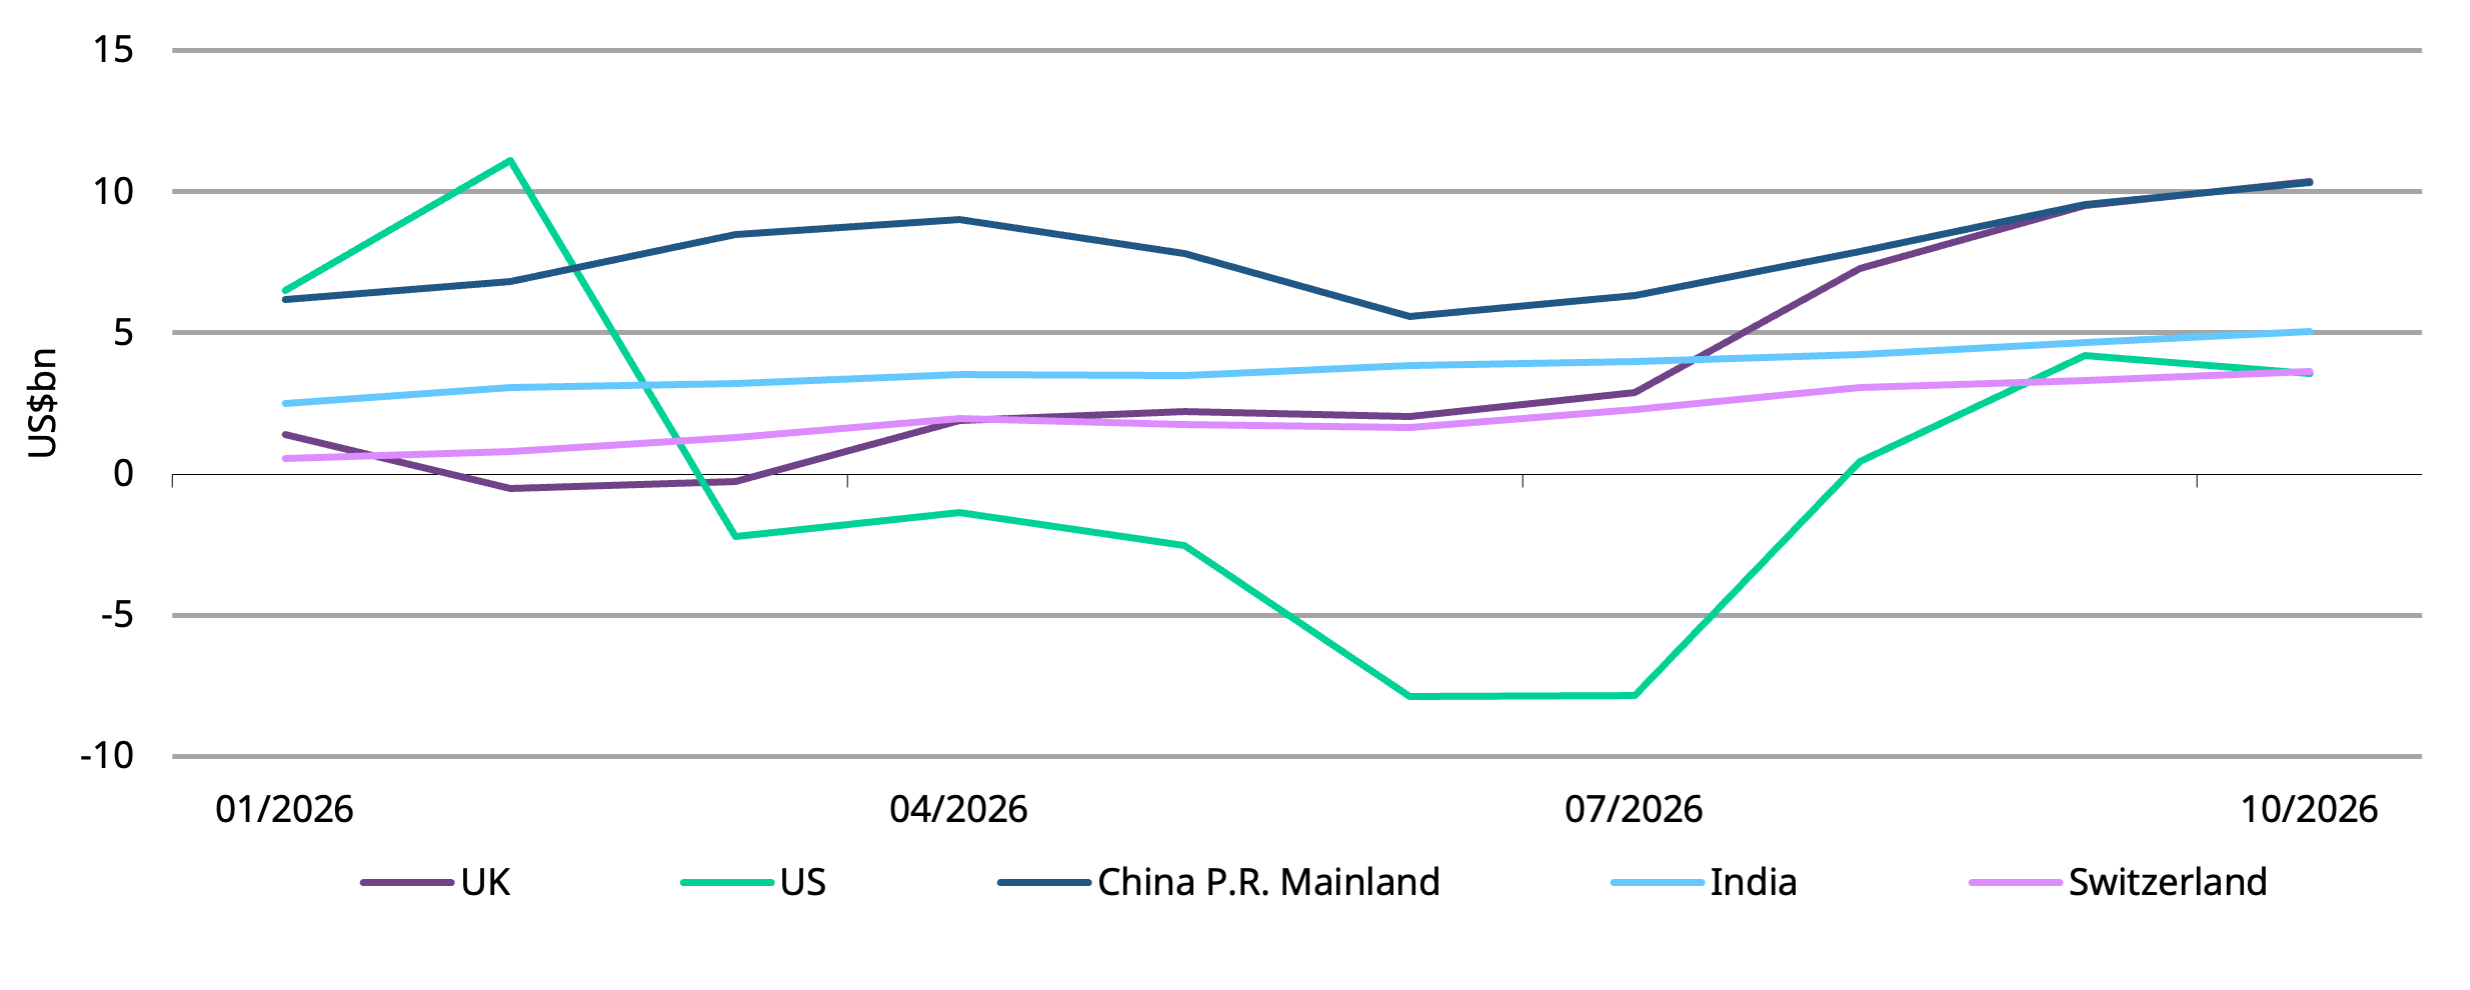
During the first ten months of the year, global gold ETFs added US$41bn, the third strongest on record, and their holdings rose by 246t. European and Asian investors led global flows, each accounting for 44% and 45% of total net inflows, respectively. At the country level, the UK recorded the largest inflows, with China a close second. 

Chart 1: European inflows continued to lead despite the price pull back 

Global gold ETF flows by region and the monthly average gold price*

*As of 31 October 2026. Gold price based on the quarterly and monthly average LBMA Gold Price PM in USD.
Source: Bloomberg, Company Filings, World Gold Council

Regional overview

North American funds saw modest outflows of US$512mn, the only region with outflows in October. US-domiciled gold ETFs were the sole driver of the region’s October loss; Canadian funds continued to attract inflows. 

US technology equities came under selling pressure during October amid growing concerns around AI-related capital spend. The resulting market stress may have contributed to the region’s gold ETF outflows as some investors turned to their gold holdings as a ready source of liquidity. This illustrates one of gold’s key attributes: deep liquidity can help investors meet cash needs during market turbulence.

Equity sell-offs in the month also led to strong safe-haven buying of US Treasuries. October saw their strongest monthly return since December 2023 and pulled yields down from the highest in nearly 25 years.2 Relatively attractive price levels and investor repricing of a less aggressive US Fed may have increased their appeal. This focus on US Treasuries could have diverted investors away from gold. 

Yet it is worth noting that US gold ETFs saw net inflows, albeit mild, during the last week of October when local equities plunged again. This reflects investors’ strategic allocation, possibly driven by a combination of diversification needs against political uncertainty – with midterm elections around the corner – and persisting fiscal concerns.

Europe has now seen inflows for four months in a row, adding US$1.8bn in October. The UK continued to lead, with funds listed in Germany, Switzerland and France also registering positive demand. 

It is worth highlighting that the region has experienced net inflows for 18 consecutive weeks. This is a trend that has persisted despite the gold price weakness, surging yields across the region, and changes in market expectations of future moves by local central banks. 

This suggests that demand for gold ETFs may be increasingly strategic, reflecting persistent political and fiscal uncertainty across the region. In France, social unrest, political fragmentation and a difficult fiscal consolidation have weighed on investor sentiment, unsettling domestic equities and adding to sovereign risk premia.3 In the UK, elevated yields, energy shocks and shrinking fiscal headroom also sparked concerns.4 Meanwhile, Germany is experiencing weakening economic momentum and growing political pressure on its governing coalition. Against this backdrop, investors have increasingly turned to gold ETFs for diversification, particularly as traditional safe-haven bond markets face their own challenges. 

Asian investors bought US$1.3bn in October, also a fourth consecutive month of inflows. China continued to lead the region’s inflows. Local investor allocation to gold ETFs remains strategically linked to the equity market rout and falling government bond yields, which reduce the opportunity cost of holding gold despite the gold price weakness. Japanese gold ETFs continued to attract inflows in October, driven by similar factors: the Nikkei pulled back and Japanese government bond yields fell amid safe-haven flows and less aggressive expectations of the BoJ’s tightening ahead for most of the month – the central bank left rates unchanged in late October.5 India also saw sustained gold ETF buying in the month despite local mutual funds’ temporary suspension of fresh subscription to gold fund of funds in mid-October. 

Gold ETFs listed in other regions saw mild inflows of US$62mn, supported throughout the month by demand from both Australia and South Africa. 

Chart 2: UK and China lead global inflows y-t-d

Cumulative ETF fund flows by selected countries* 

UK and China lead global inflows y-t-d

*As of 31 October 2026. Countries shown are the five largest contributors to global gold ETF inflows y-t-d.
Source: Bloomberg, Company Filings, World Gold Council


Gold ETF flows

Data as of

Demand captures changes in global/regional gold holdings; fund flows capture the net amount of money (in USD) that comes in or out of gold ETFs globally/regionally. See methodology note.

Volumes eased

Global gold market volumes6 declined 13% in October, averaging US$365bn per day. All sectors saw volumes pull back. Over-the-counter (OTC) volumes decreased by a marginal 2%, to US$219bn/day – LBMA activities remained healthy at US$196bn/day, with only a 2% m/m decline and well above the 2025 average of US$161bn/day. Exchange-traded activity fell the most, shedding 25% in the month to US$140bn/day, led by a 22% decline at the COMEX and a 31% retreat in Shanghai. Liquidity of global gold ETFs averaged US$6bn/day in the month, a 20% m/m fall, primarily driven by North America which accounted for the lion’s share of total. 

Total COMEX net longs fell further, shedding 94t in October to 560t, the lowest since end-July.7 Net longs held by managed money reduced 53t in the month. Meanwhile, other reportables8 continued to retreat, losing 54t, and spreads9 pulled back by 13t. Interestingly, net open interest10 of COMEX gold options rose 6% in the month, and kept climbing during the last few days of October despite the equity sell-off, possibly due to rollovers amid contract expiry and potential dip buying. 

Chart 3: Gold market trading volumes fell in October

Average daily trading volumes by segment*
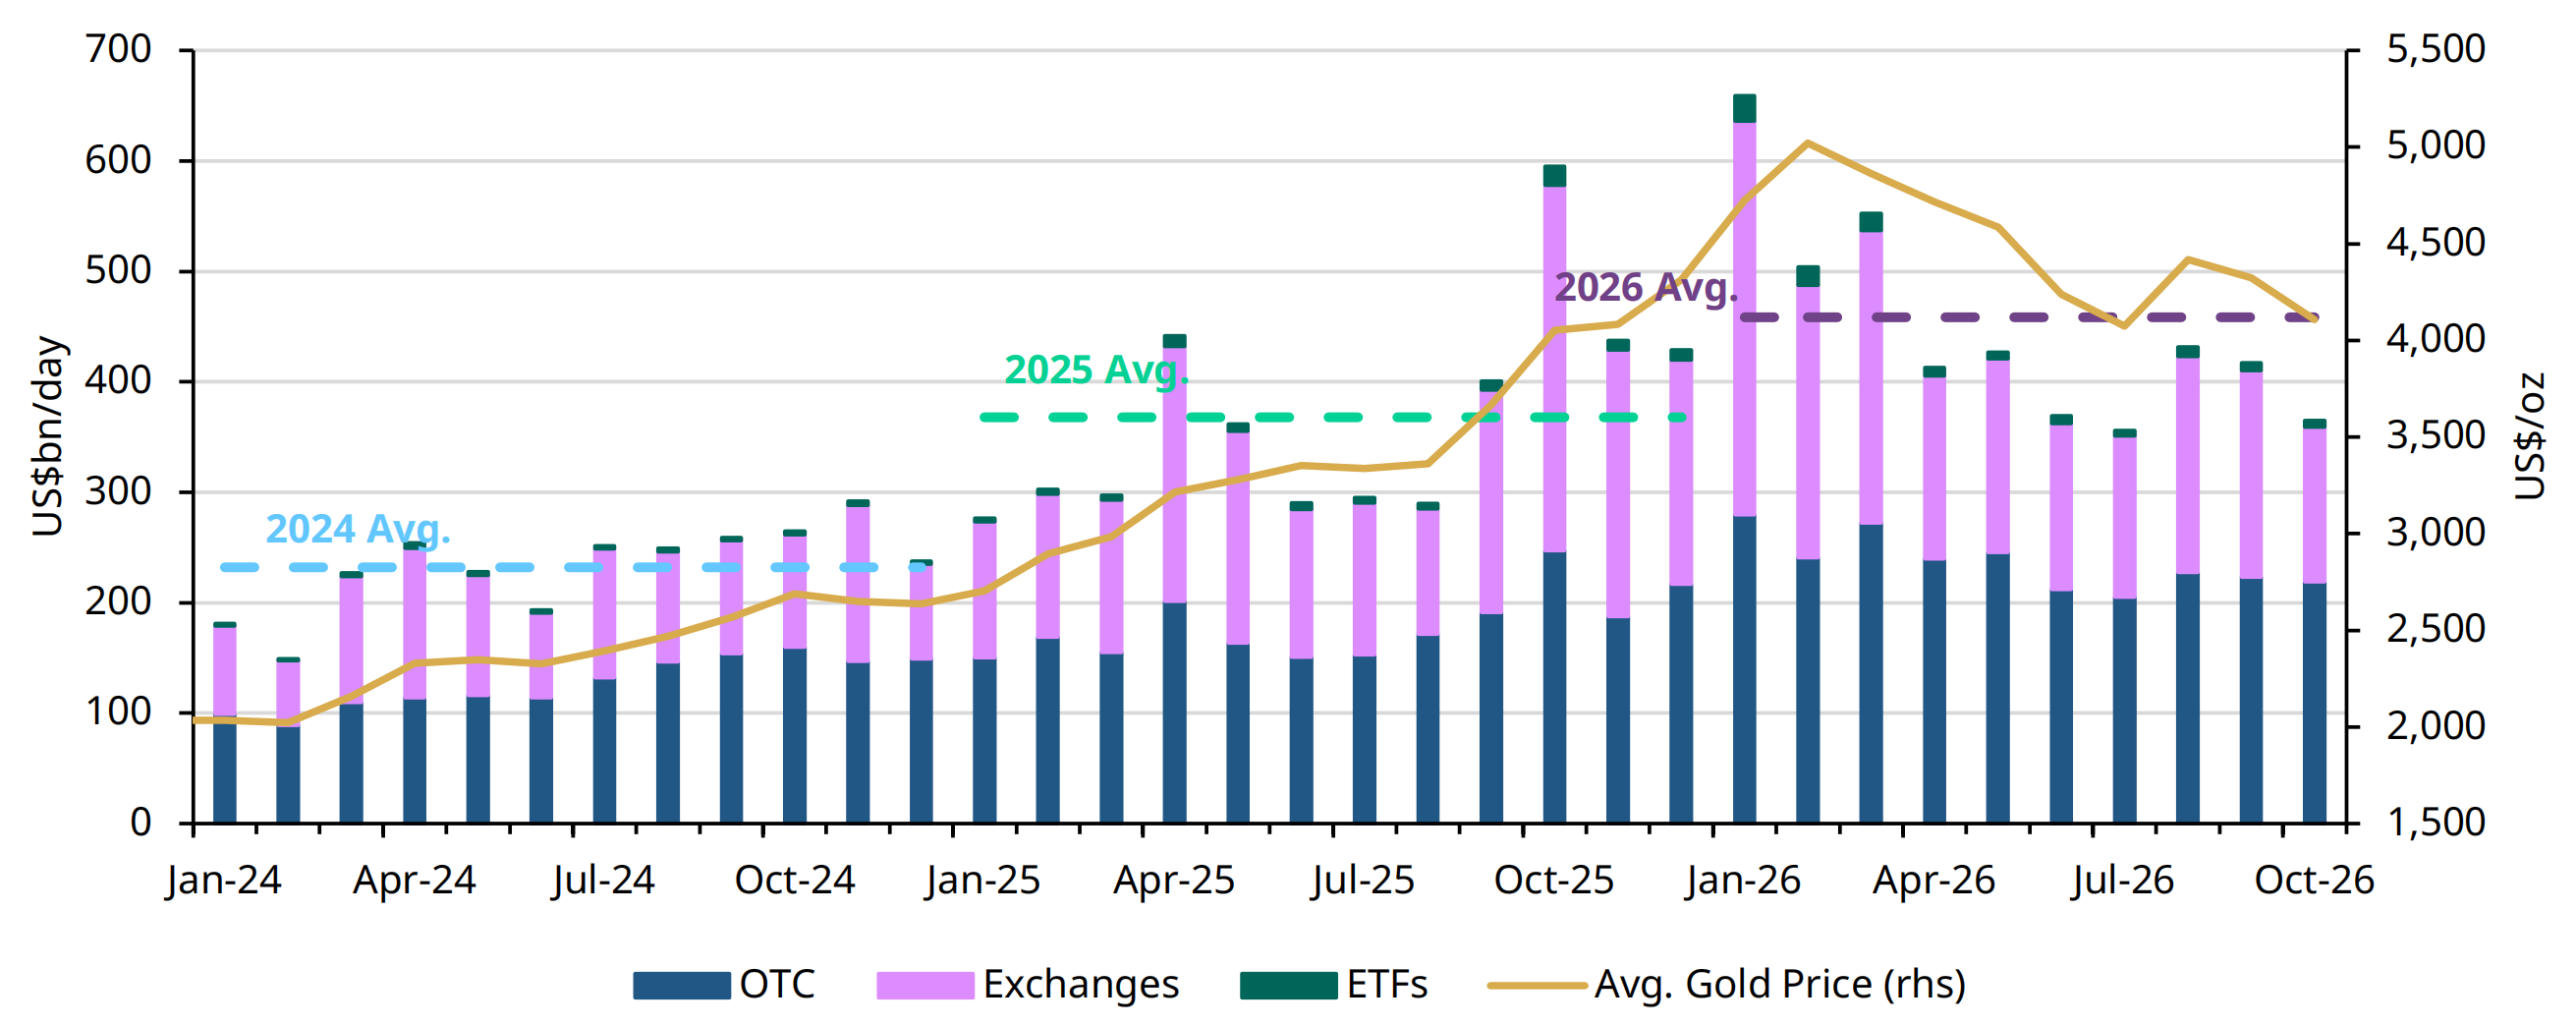
*Data as of 31 October 2026. Gold price based on the monthly average LBMA Gold Price PM USD. 
For more information on trading volumes please visit our Trading Volumes page on Goldhub: Gold Trading Volume | Gold Daily Volume | World Gold Council.
Source: Bloomberg, Nasdaq, COMEX, ICE Benchmark Administration, Shanghai Gold Exchange, Shanghai Futures Exchange, ETF providers, Multi Commodity Exchange of India, Dubai Gold & Commodities Exchange, Japan Exchange Group, Thailand Futures Exchange, Borsa Istanbul, Bursa Malaysia, Korea Exchange, World Gold Council

Footnotes

  1. We define gold ETFs as regulated securities that hold gold in physical form. These include open-ended funds traded on regulated exchanges and other regulated products such as closed-end funds and mutual funds. A complete list is included in the gold ETF section of Goldhub.com.

  2. Based on Bloomberg US Agg Total Return Index and the US 10-year Treasury yield. On 7 October 2026, the 10-year yield surged to the highest since 4 April 2002. 

  3. Due to LBMA trading volume data availability our full trading volume dataset dates back to 2019.

  4. Based on CFTC positioning report as of 28 October 2026.

  5. Other reportables refer to reportable traders in the CFTC Commitment of Traders report that do not fall into the producer/merchant, swap dealer, or managed money categories. This group can include institutional or commercial participants with positions large enough to meet reporting thresholds.

  6. Spreading positions reflect investors with offsetting long and short positions, typically in different calendar months.

  7. Net option open interest (OI) measures the difference between outstanding call and put option contracts, providing a broad indication of options-market sentiment rather than a direct measure of directional exposure.