Investors have long recognised the benefits of investing in commodities. Over time, they have been shown to improve portfolio diversification, offering inflation protection and an element of smoothing across economic cycles. Most investors access this asset class via commodity indices, which invariably include gold.
But gold’s weighting within broad commodity indices can understate its importance as a strategic portfolio component. Index methodologies typically rely on futures-market liquidity and/or production-based measures, neither of which fully captures the structure of the gold market. Gold's liquidity extends beyond futures markets through deep OTC and ETF trading, while its available supply extends beyond annual mine production through a large above-ground stock that can be recycled, resold and reallocated. As a result, broad commodity indices may assign gold a modest weight even though its market depth, available supply and strategic portfolio role are greater than those weights suggest (Table 1).
Table 1: Commodity indices have a small allocation to gold*
S&P GSCI index
Bloomberg commodity index
Energy
51.8%
29.4%
Agriculture / Livestock / Grains / Softs
28.2%
36.0%
Industrial metals
12.1%
15.8%
Gold
7.2%
14.9%
Silver
0.6%
3.9%
*Weights are the 2026 target weights announced by Bloomberg and S&P Dow Jones Indices. Source: S&P Down Jones Index, Bloomberg Commodity Index, World Gold Council
And while these allocations are trending higher, we do not believe current weightings provide an appropriate exposure to gold, particularly as commodities tend to represent a small portion of an investor’s overall portfolio and gold has unique and differentiating properties. Moreover, exposure to gold through a broad commodity index does not serve strategic investors optimally; rather, it results in roll costs, which – unlike most other commodities – are avoidable with physical allocation.
Market structure: contrasting supply and demand forces
Gold is, of course, a raw material used in the production of manufactured goods – the very definition of a commodity. In fact, gold shares more characteristics with other metals – in particular precious metals – than it does with any of the other commodity categories. For example, beyond the obvious similarities of mine production, many metals can be reused or recycled for new fabrication, thus providing an additional source of supply. This is in stark contrast to energy, agricultural and livestock commodities, which are spent, consumed, or transformed, but are rarely recoverable.
That said, gold is much more than that. As both an investment and a consumer good, it is a multi-faceted asset that enjoys diverse supply and demand dynamics. Gold is, on the one hand, often used as an investment to protect and enhance wealth over the long term, but on the other hand it is also a consumer good, via jewellery and technology demand. This demand structure sets gold apart and makes it less sensitive to the business cycle. Indeed, during periods of economic uncertainty it is the counter-cyclical investment demand that drives up the gold price. During periods of economic expansion pro-cyclical consumer demand supports performance. In contrast, for most other metals, including silver, the technology and industrial sectors account for a much larger portion of demand, making these metals more exposed to the business cycle (Chart 1).
Chart 1: Gold enjoys sources of demand that de-link it from the global business cycle*
Chart 1: Gold enjoys sources of demand that de-link it from the global business cycle*
Chart 1: Gold enjoys sources of demand that de-link it from the global business cycle*
Sources: International Copper Study Group, Metals Focus, Silver Institute, World Gold Council; Disclaimer
*Based on 5yr average annual demand estimates ending Q4 2025. Copper has negligible proportions in consumer and investment categories.
Data as of
Sources:
International Copper Study Group,
Metals Focus,
Silver Institute,
World Gold Council; Disclaimer
*Based on 5yr average annual demand estimates ending Q4 2025. Copper has negligible proportions in consumer and investment categories.
From a supply perspective, gold and other commodities differ. Gold production is more geographically diverse making supply less exposed to disruption. In addition, and unlike gold, most commodities are highly sensitive to changes in physical inventory. For oil, copper, natural gas, or agricultural commodities such as cocoa, inventories provide the critical buffer between supply and consumption.
The tighter that buffer becomes, the more exposed the market is to shocks, increasing the likelihood that prices are pushed higher (Chart 2, 3 & 4). Gold is different. Its above-ground stock is large relative to annual mine production and it is not “consumed” in the same way as energy, metals or agricultural commodities. As a result, gold’s price is less a function of short-term inventory scarcity and more a function of demand.
Charts 2, 3 & 4: Cocoa and oil are sensitive to changes in inventory, gold is not*
Chart 2: Cocoa
Chart 2: Cocoa
Chart 2: Cocoa
Sources: Bloomberg, Internation Cocoa Organisation, EIA, Metals Focus, World Bank, World Gold Council; Disclaimer
*As of 31 December 2025. Note: stocks-to-use measures the level of inventories relative to the amount being used. A lower ratio indicates potential supply concerns and upward price pressure. A higher ratio indicates a well-supplied market with lower price pressure. Stock-to-demand for gold refers to the level of inventories (total above-ground stock) relative to identifiable gold demand. All prices are expressed in real terms, adjusted using US Consumer Price Index.
Data as of
Chart 3: Oil
Chart 3: Oil
Chart 3: Oil
Sources: Bloomberg, Internation Cocoa Organisation, EIA, Metals Focus, World Bank, World Gold Council; Disclaimer
*As of 31 December 2025. Note: stocks-to-use measures the level of inventories relative to the amount being used. A lower ratio indicates potential supply concerns and upward price pressure. A higher ratio indicates a well-supplied market with lower price pressure. Stock-to-demand for gold refers to the level of inventories (total above-ground stock) relative to identifiable gold demand. All prices are expressed in real terms, adjusted using US Consumer Price Index.
Data as of
Chart 4: Gold
Chart 4: Gold
Chart 4: Gold
Sources: Bloomberg, Internation Cocoa Organisation, EIA, Metals Focus, World Bank, World Gold Council; Disclaimer
*As of 31 December 2025. Note: stocks-to-use measures the level of inventories relative to the amount being used. A lower ratio indicates potential supply concerns and upward price pressure. A higher ratio indicates a well-supplied market with lower price pressure. Stock-to-demand for gold refers to the level of inventories (total above-ground stock) relative to identifiable gold demand. All prices are expressed in real terms, adjusted using US Consumer Price Index.
Data as of
Sources:
Bloomberg,
Internation Cocoa Organisation,
EIA,
Metals Focus,
World Bank,
World Gold Council; Disclaimer
*As of 31 December 2025. Note: stocks-to-use measures the level of inventories relative to the amount being used. A lower ratio indicates potential supply concerns and upward price pressure. A higher ratio indicates a well-supplied market with lower price pressure. Stock-to-demand for gold refers to the level of inventories (total above-ground stock) relative to identifiable gold demand. All prices are expressed in real terms, adjusted using US Consumer Price Index.
The investment perspective
Although a commodity, gold’s investment characteristics differ largely from those of other broad commodities. There are in fact four main differentiators between gold and the broader commodities complex, making their role in a portfolio very different.
1. Better returns
Investors have long considered gold a beneficial asset during periods of uncertainty. Yet, historically, gold has generated long-term positive returns in both good and bad economic times. And when compared to commodities, gold has outperformed not only broad-based indices but also most sub-indices over the past 3, 5, 10 and 20 years (Chart 5). In fact, a number of sub-indices and broad commodities have fallen over the past 20 years.
Chart 5: Gold has outperformed commodities over several investment horizons…
Annualised returns over 1, 3, 5, 10 & 20 years*
Chart 5: Gold has outperformed commodities over several investment horizons…
Chart 5: Gold has outperformed commodities over several investment horizons…
Annualised returns over 1, 3, 5, 10 & 20 years*
Sources: Bloomberg, ICE Benchmark Administration, World Gold Council; Disclaimer
*All periods end 30 June 2026.
Data as of
Sources:
Bloomberg,
ICE Benchmark Administration,
World Gold Council; Disclaimer
*All periods end 30 June 2026.
And while gold has outperformed all other sub-asset classes over a 20-year horizon, it has at times underperformed over shorter horizons (Chart 6).
Chart 6: …even if it’s not the holy grail at all times
Gold’s relative performance to broad commodities ex precious metals – 1yr rolling*
Chart 6: …even if it’s not the holy grail at all times
Chart 6: …even if it’s not the holy grail at all times
Gold’s relative performance to broad commodities ex precious metals – 1yr rolling*
Sources: Bloomberg, World Gold Council; Disclaimer
*Based on 1yr rolling return differential between gold and Bloomberg Commodity ex precious metals, from 30 June 2006 to 30 June 2026.
Data as of
Sources:
Bloomberg,
World Gold Council; Disclaimer
*Based on 1yr rolling return differential between gold and Bloomberg Commodity ex precious metals, from 30 June 2006 to 30 June 2026.
Investors accessing commodities through futures are exposed not only to price changes but also to the shape of the futures curve. For many commodities, storage and financing costs can result in periods of contango, creating a drag on returns as positions are rolled forward. However, unlike gold, commodities such as crude oil also carry a convenience yield associated with physical ownership and immediate availability. During periods of tight inventories, this convenience yield can exceed storage and financing costs, leading to backwardation and positive roll returns for futures investors. As a result, the return impact of rolling can vary significantly through time and across commodity sectors.
Gold's market structure is different. Its large above-ground stock, low storage costs and limited benefit from immediate physical possession mean that the convenience yield is generally limited and the front end of the futures curve has historically remained relatively flat. Consequently, futures returns for gold have closely matched spot returns: between June 2006 and June 2026, gold returned 9.9% in spot terms and 8.9% through futures. Over the same period, oil generated a -0.2% spot return but a -7.2% futures return due to rolling and collateral costs (Chart 7).
Chart 7: Gold has minimal performance drag from futures rolling unlike other commodities
Spot and total returns for gold and broad commodity sub-classes over the past 20 years*
Chart 7: Gold has minimal performance drag from futures rolling unlike other commodities
Chart 7: Gold has minimal performance drag from futures rolling unlike other commodities
Spot and total returns for gold and broad commodity sub-classes over the past 20 years*
Sources: Bloomberg, World Gold Council; Disclaimer
*Data from 30 June 2006 to 30 June 2026.
Data as of
Sources:
Bloomberg,
World Gold Council; Disclaimer
*Data from 30 June 2006 to 30 June 2026.
Finally, the diversity of gold’s sources of demand help to make gold a less volatile asset than other commodities (Chart 8). As such, gold can enhance portfolio stability and improve risk-adjusted returns.
Chart 8: Gold sits at the lower end of the commodity risk spectrum
Average daily volatility of several major commodities*
Chart 8: Gold sits at the lower end of the commodity risk spectrum
Chart 8: Gold sits at the lower end of the commodity risk spectrum
Average daily volatility of several major commodities*
Sources: Bloomberg, ICE Benchmark Administration, World Gold Council; Disclaimer
*Based on daily data returns of the Bloomberg Commodity Index and sub-indices, S&P GS Commodity Index and LBMA Gold Price using data between 30 June 2006 and 30 June 2026.
Data as of
Sources:
Bloomberg,
ICE Benchmark Administration,
World Gold Council; Disclaimer
*Based on daily data returns of the Bloomberg Commodity Index and sub-indices, S&P GS Commodity Index and LBMA Gold Price using data between 30 June 2006 and 30 June 2026.
2. Effective diversification
Gold has important diversification properties that come into their own during periods of systemic risk. In fact, gold has little to no correlation with many other assets, including commodities, underscoring that its role as a diversifier is distinct and cannot be replicated through broad commodity exposure alone (Chart 9).
Chart 9: Gold has a low correlation to other commodities
Rolling 1-year daily correlation of gold to other commodities*
Chart 9: Gold has a low correlation to other commodities
Chart 9: Gold has a low correlation to other commodities
Rolling 1-year daily correlation of gold to other commodities*
Sources: Bloomberg, World Gold Council; Disclaimer
*Data as of 30 June 2026.
Data as of
Sources:
Bloomberg,
World Gold Council; Disclaimer
*Data as of 30 June 2026.
Crucially, however, the correlation is dynamic, changing across economic cycles to the benefit of investors. Like other commodities, gold is positively correlated to stocks during periods of economic growth when equity markets tend to rise. But importantly, gold is typically negatively correlated with stocks during risk-off periods, protecting investors against tail risks and other events that can have a significant negative impact on capital – a protection not offered by broad commodities (Chart 10). Gold is also a more effective diversifier than other precious metals such as silver, as these other metals depend, to a greater extent, on industrial demand.
Chart 10: Gold is a more effective hedge
Correlation between gold, commodities and US stocks in various market environments*
Chart 10: Gold is a more effective hedge
Chart 10: Gold is a more effective hedge
Correlation between gold, commodities and US stocks in various market environments*
Sources: Bloomberg, ICE Benchmark Administration, World Gold Council; Disclaimer
*As of 30 June 2026. Correlations based on weekly returns in US dollars for ‘US stocks’: S&P 500 Index; ‘gold’: LBMA Gold Price PM and ‘commodities’: Bloomberg commodity index since September 1989 due to availability of S&P500 data. The top bar corresponds to the respective correlations when the S&P 500 weekly returns rise by more than two standard deviations. The middle bar corresponds to the respective correlations when the S&P 500 weekly returns are between two standard deviations (or ‘σ’), while the bottom bar corresponds to the respective correlation when the S&P 500 weekly returns fall by more than two standard deviations. The standard deviation for the S&P 500 is calculated using weekly returns over the full period.
Data as of
Sources:
Bloomberg,
ICE Benchmark Administration,
World Gold Council; Disclaimer
*As of 30 June 2026. Correlations based on weekly returns in US dollars for ‘US stocks’: S&P 500 Index; ‘gold’: LBMA Gold Price PM and ‘commodities’: Bloomberg commodity index since September 1989 due to availability of S&P500 data. The top bar corresponds to the respective correlations when the S&P 500 weekly returns rise by more than two standard deviations. The middle bar corresponds to the respective correlations when the S&P 500 weekly returns are between two standard deviations (or ‘σ’), while the bottom bar corresponds to the respective correlation when the S&P 500 weekly returns fall by more than two standard deviations. The standard deviation for the S&P 500 is calculated using weekly returns over the full period.
This dynamism reflects gold’s dual nature as both a consumer good and an investment. When economic conditions are benign, consumer spending on items such as jewellery or technological devices tends to increase, and this works in gold’s favour. During times of systemic risk, however, market participants seek high-quality, liquid assets that preserve capital and minimise losses. This can also benefit gold by boosting investment demand and driving up prices. In the Q4 2018 global equity selloff the MSCI USA index fell 14% and commodities fell 9%, yet gold rose 8%. And in the COVID selloff (Q1 2020), the MSCI USA index fell 20% and commodities fell 23%, while gold returned 6%. In both of these recent cases, gold not only protected portfolio assets but also delivered positive returns, while broader commodities behaved more like a risk-on asset (Chart 11).
Chart 11: Gold provides more consistent downside protection
Gold and commodities returns during the 10 worst quarters of US stock performance*
Chart 11: Gold provides more consistent downside protection
Chart 11: Gold provides more consistent downside protection
Gold and commodities returns during the 10 worst quarters of US stock performance*
Sources: Bloomberg, ICE Benchmark Administration, World Gold Council; Disclaimer
*Based on quarterly returns of the MSCI USA Total Return Index, LBMA Gold Price and Bloomberg Commodity Total Return Index using data between 31 December 1972 and 30 June 2026. All calculations in USD.
Data as of
Sources:
Bloomberg,
ICE Benchmark Administration,
World Gold Council; Disclaimer
*Based on quarterly returns of the MSCI USA Total Return Index, LBMA Gold Price and Bloomberg Commodity Total Return Index using data between 31 December 1972 and 30 June 2026. All calculations in USD.
3. Protection against inflation
Commodities are often used for protection during periods of high inflation. While it is true that commodities have performed well during inflationary periods, gold has performed better. And in periods of low inflation commodities delivered negative nominal returns while gold posted positive returns, reflecting increased demand when economic conditions are robust (Chart 12).
Chart 12: Gold outperforms commodities across inflation environments
Gold and commodities nominal returns as a function of annual inflation*
Chart 12: Gold outperforms commodities across inflation environments
Chart 12: Gold outperforms commodities across inflation environments
Gold and commodities nominal returns as a function of annual inflation*
Sources: Bloomberg, ICE Benchmark Administration, World Gold Council; Disclaimer
*Based on y/y changes for the LBMA Gold Price PM and US CPI between December 1971 and June 2026 in USD.
Data as of
Sources:
Bloomberg,
ICE Benchmark Administration,
World Gold Council; Disclaimer
*Based on y/y changes for the LBMA Gold Price PM and US CPI between December 1971 and June 2026 in USD.
4. Gold is liquid
The gold market is large, global and highly liquid. Unlike most other commodities, investors can access gold in a number of ways – an important indicator of how gold operates within a differentiated market. While futures dominate most commodity trading and physical delivery is rare, around 48% of gold trading occurs over-the-counter (OTC) linked to physical delivery; futures account for about 50% (Chart 13). More specifically, on the global futures markets, daily volumes average US$186bn. On the COMEX alone, daily volumes averaged US$53bn over the past 10 years, (Chart 14) second only to oil. On the OTC market, estimated volumes are similarly strong at around US$180bn. There is a thriving physical gold-backed ETF market too, with daily volumes averaging US$7.2bn. Overall, daily trading in the global gold market averaged US$373bn in 2025. The scale and depth of the market means that it can comfortably accommodate large, buy-and-hold institutional investors.
Chart 13: Gold can be accessed in a number of ways
Average daily gold trading volume in 2025*
Chart 13: Gold can be accessed in a number of ways
Chart 13: Gold can be accessed in a number of ways
Average daily gold trading volume in 2025*
Sources: World Gold Council; Disclaimer
*As of 31 December 2025
Chart 14: On the COMEX, volume of gold futures is higher than all commodities except oil
Average daily trading volume in US dollars over the past 10 years*
Chart 14: On the COMEX, volume of gold futures is higher than all commodities except oil
Chart 14: On the COMEX, volume of gold futures is higher than all commodities except oil
Average daily trading volume in US dollars over the past 10 years*
Sources: Bloomberg, COMEX, World Gold Council; Disclaimer
*Based on 10-yr average trading volumes as of 30 June 2026.
Data as of
Sources:
Bloomberg,
COMEX,
World Gold Council; Disclaimer
*Based on 10-yr average trading volumes as of 30 June 2026.
Portfolio impact and macro drivers
Portfolio impact
Commodity exposure is generally limited to less than 10% of an investment portfolio, and in many cases is much lower. Gold usually accounts for less than 10% of that amount – in other words, most portfolios will have less than 1% exposure to gold. And while commodities can help reduce portfolio volatility, our analysis suggests that adding a 2.5%–10% portfolio allocation to commodities would not have improved risk-adjusted returns over the past 20 years.
Gold, however, can do much more.
Looking back over the past two decades, an allocation to gold provided two key benefits: it increased absolute returns and reduced portfolio volatility when compared either to a portfolio with no gold exposure, or one with only a broad-based commodity exposure (Chart 15).
Chart 15: Gold improves risk-adjusted returns
Risk-adjusted returns of a hypothetical portfolio with and without gold or commodities*
Chart 15: Gold improves risk-adjusted returns
Chart 15: Gold improves risk-adjusted returns
Risk-adjusted returns of a hypothetical portfolio with and without gold or commodities*
Sources: Bloomberg, ICE Benchmark Administration, World Gold Council; Disclaimer
*Based on US dollar performance between 30 June 2006 and 30 June 2026. The hypothetical average portfolio: 70% allocation to equities (60% MSCI World Total Return Index, 10% MSCI EM Total Return Index), 30% allocation to fixed income (15% Bloomberg US Treasury Index, 15% Bloomberg US Corporate Bond Index). The allocation to gold and commodities comes from proportionally reducing all assets. Risk-adjusted returns are calculated as the annualised return/annualised volatility.
Data as of
Sources:
Bloomberg,
ICE Benchmark Administration,
World Gold Council; Disclaimer
*Based on US dollar performance between 30 June 2006 and 30 June 2026. The hypothetical average portfolio: 70% allocation to equities (60% MSCI World Total Return Index, 10% MSCI EM Total Return Index), 30% allocation to fixed income (15% Bloomberg US Treasury Index, 15% Bloomberg US Corporate Bond Index). The allocation to gold and commodities comes from proportionally reducing all assets. Risk-adjusted returns are calculated as the annualised return/annualised volatility.
While vital to assess the degree of portfolio diversification, recognition of its origins is equally significant. Our analysis shows that adding gold and commodities to a portfolio can increase diversification benefits and reduce overall portfolio risk (Charts 16 & 17). That said, gold remains an indispensable strategic asset for investors. Its persistently low correlation with other asset classes makes it unmatched for portfolio diversification. In our hypothetical portfolio a 5% allocation to gold contributes 28% to total diversification benefits – ranking it first among all assets (Chart 18). On the flip side, commodities, while also comprising 5% of the capital allocation, contribute 15% to this diversification benefit.
Charts 16 & 17: Gold and commodities can reduce total portfolio risk due to their diversification benefits
Chart 16: Portfolio without gold and commodities: risk decomposition*
Chart 16: Portfolio without gold and commodities: risk decomposition*
Chart 16: Portfolio without gold and commodities: risk decomposition*
Sources: Bloomberg, ICE Benchmark Administration, World Gold Council; Disclaimer
*Risk decomposition based on US dollar performance between 30 June 2006 and 30 June 2026.
Data as of
Sources:
Bloomberg,
ICE Benchmark Administration,
World Gold Council; Disclaimer
*Risk decomposition based on US dollar performance between 30 June 2006 and 30 June 2026.
Chart 17: Portfolio with gold and commodities: risk decomposition*
Chart 17: Portfolio with gold and commodities: risk decomposition*
Chart 17: Portfolio with gold and commodities: risk decomposition*
Sources: Bloomberg, ICE Benchmark Administration, World Gold Council; Disclaimer
*Risk decomposition based on US dollar performance between 30 June 2006 and 30 June 2026.
Data as of
Sources:
Bloomberg,
ICE Benchmark Administration,
World Gold Council; Disclaimer
*Risk decomposition based on US dollar performance between 30 June 2006 and 30 June 2026.
Chart 18: Gold is the strongest source of diversification within the portfolio
Diversification benefit contribution; total 2.3%*
Chart 18: Gold is the strongest source of diversification within the portfolio
Chart 18: Gold is the strongest source of diversification within the portfolio
Diversification benefit contribution; total 2.3%*
Sources: Bloomberg, ICE Benchmark Administration, World Gold Council; Disclaimer
*As of 30 June 2026.
Data as of
Sources:
Bloomberg,
ICE Benchmark Administration,
World Gold Council; Disclaimer
*As of 30 June 2026.
Our analysis of investment performance over the past 3, 5, 10 and 20 years also emphasises gold’s positive impact on an institutional portfolio over multiple investment horizons (Table 2).
Table 2: Gold has increased returns while reducing volatility and maximum drawdowns*
3-year
5-year
10-year
20-year
No gold
5% gold
No gold
5% gold
No gold
5% gold
No gold
5% Gold
Annualised returns
15.4%
16.2%
8.0%
8.6%
10.0%
10.2%
7.8%
7.9%
Annualised volatility
9.9%
9.6%
11.9%
11.6%
11.2%
10.8%
11.8%
11.3%
Reward to risk
155.9%
167.6%
67.2%
73.8%
89.4%
94.0%
66.2%
70.2%
Maximum drawdown
-13.3%
-12.1%
-22.5%
-21.8%
-22.5%
-21.8%
-41.0%
-38.6%
*As of 30 June 2026. Source: Bloomberg, ICE Benchmark Administration, World Gold Council
Macro drivers
It is also worth examining the behaviour of commodities and gold in different market regimes. Framing it this way – not via investment time periods, per se, but in actual economic and market environments – makes it possible to identify when commodities or gold may do better going forward.
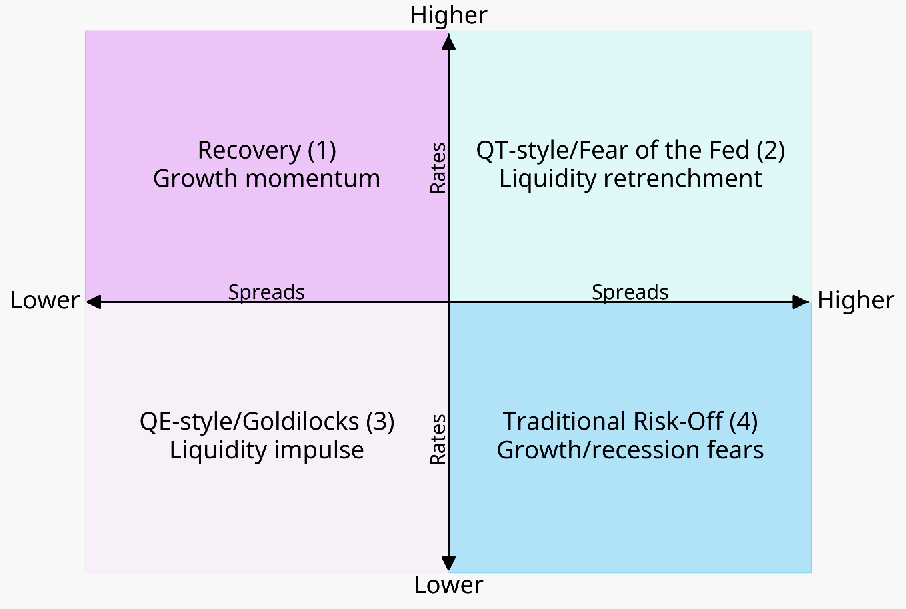
The framework divides the macro environment into four phases: ‘QE-style goldilocks’, ‘Fear of the Fed’, ‘Recovery’, and ‘Risk-off’, with each phase defined by the direction of bond yields and corporate spreads (Chart 19).
Chart 19: The four global macro regimes*
*As of 30 June 2026. Source: World Gold Council
The average historical returns for each phase can be seen in Chart 20. Unsurprisingly, risk-off and QE-style goldilocks are the best environments for gold. The latter is also characterised by a higher equity-bond correlation. But interestingly, gold provided positive returns in all regimes, providing more stable returns across cycles. Commodities, on the other hand, do best in the recovery phase – an environment of resurgent economic growth twinned with rising inflation and interest rates – and they fare badly in a recession.
Chart 20: Gold performs best in risk-off and QE-style environments while the recovery phase is best for commodities*
Chart 20: Gold performs best in risk-off and QE-style environments while the recovery phase is best for commodities*
Chart 20: Gold performs best in risk-off and QE-style environments while the recovery phase is best for commodities*
Sources: Bloomberg, ICE Benchmark Administration, World Gold Council; Disclaimer
*Annualised returns from June 1989 to June 2026. Bloomberg US Treasury Yield to Worst for yields. Bloomberg US Agg Corporate Average OAS for spreads. LBMA Gold Price PM in USD used for gold returns and S&P GSCI Index for commodities.
Data as of
Sources:
Bloomberg,
ICE Benchmark Administration,
World Gold Council; Disclaimer
*Annualised returns from June 1989 to June 2026. Bloomberg US Treasury Yield to Worst for yields. Bloomberg US Agg Corporate Average OAS for spreads. LBMA Gold Price PM in USD used for gold returns and S&P GSCI Index for commodities.
Conclusion
Gold may be a commodity, but it is not a typical one. Its unique supply-and-demand dynamics, limited exposure to roll costs, diversification benefits and resilience across market environments set it apart from the broader commodity complex. For strategic investors, gold should therefore be considered a distinct portfolio allocation, complementary to – but not interchangeable with – a broad commodity exposure.
All references to LBMA Gold Price are used with the permission of ICE Benchmark Administration Limited and have been provided for informational purposes only. ICE Benchmark Administration Limited accepts no liability or responsibility for the accuracy of the prices or the underlying product to which the prices may be referenced. Other content is the intellectual property of the respective third party and all rights are reserved to them.
The use of the statistics in this information is permitted for the purposes of review and commentary (including media commentary) in line with fair industry practice, subject to the following two pre-conditions: (i) only limited extracts of data or analysis be used; and (ii) any and all use of these statistics is accompanied by a citation to World Gold Council and, where appropriate, to Metals Focus or other identified copyright owners as their source. World Gold Council is affiliated with Metals Focus.
The World Gold Council and its affiliates do not guarantee the accuracy or completeness of any information nor accept responsibility for any losses or damages arising directly or indirectly from the use of this information.
This information is for educational purposes only and by receiving this information, you agree with its intended purpose. Nothing contained herein is intended to constitute a recommendation, investment advice, or offer for the purchase or sale of gold, any gold-related products or services or any other products, services, securities or financial instruments (collectively, “Services”). This information does not take into account any investment objectives, financial situation or particular needs of any particular person.
Diversification does not guarantee any investment returns and does not eliminate the risk of loss. Past performance is not necessarily indicative of future results. The resulting performance of any investment outcomes that can be generated through allocation to gold are hypothetical in nature, may not reflect actual investment results and are not guarantees of future results. The World Gold Council and its affiliates do not guarantee or warranty any calculations and models used in any hypothetical portfolios or any outcomes resulting from any such use. Investors should discuss their individual circumstances with their appropriate investment professionals before making any decision regarding any Services or investments.
This information may contain forward-looking statements, such as statements which use the words “believes”, “expects”, “may”, or “suggests”, or similar terminology, which are based on current expectations and are subject to change. Forward-looking statements involve a number of risks and uncertainties. There can be no assurance that any forward-looking statements will be achieved. World Gold Council and its affiliates assume no responsibility for updating any forward-looking statements.
Information regarding the LBMA Gold Price
The LBMA Gold Price is used by the World Gold Council with permission under license by ICE Benchmark Administration Limited and is subject to the restrictions set forth here (www.gold.org/terms-and-conditions).
Information regarding QaurumSM and the Gold Valuation Framework
Note that the resulting performance of various investment outcomes that can be generated through use of Qaurum, the Gold Valuation Framework and other information are hypothetical in nature, may not reflect actual investment results and are not guarantees of future results. Neither World Gold Council (including its affiliates) nor Oxford Economics provides any warranty or guarantee regarding the functionality of the tool, including without limitation any projections, estimates or calculations.