Summary
- The Shanghai Gold Benchmark Price PM (SHAUPM) (RMB) and the LBMA Gold Price AM (USD) both rebounded in July1
- While the Producers Price Index (PPI) continued to surge, the Composite Purchasing Managers Index (PMI) fell further in July
- On a m-o-m basis, trading volumes of Au(T+D) on the Shanghai Gold Exchange (SGE) and gold futures on the Shanghai Futures Exchange (SHFE) declined by 21% and 11% respectively in July
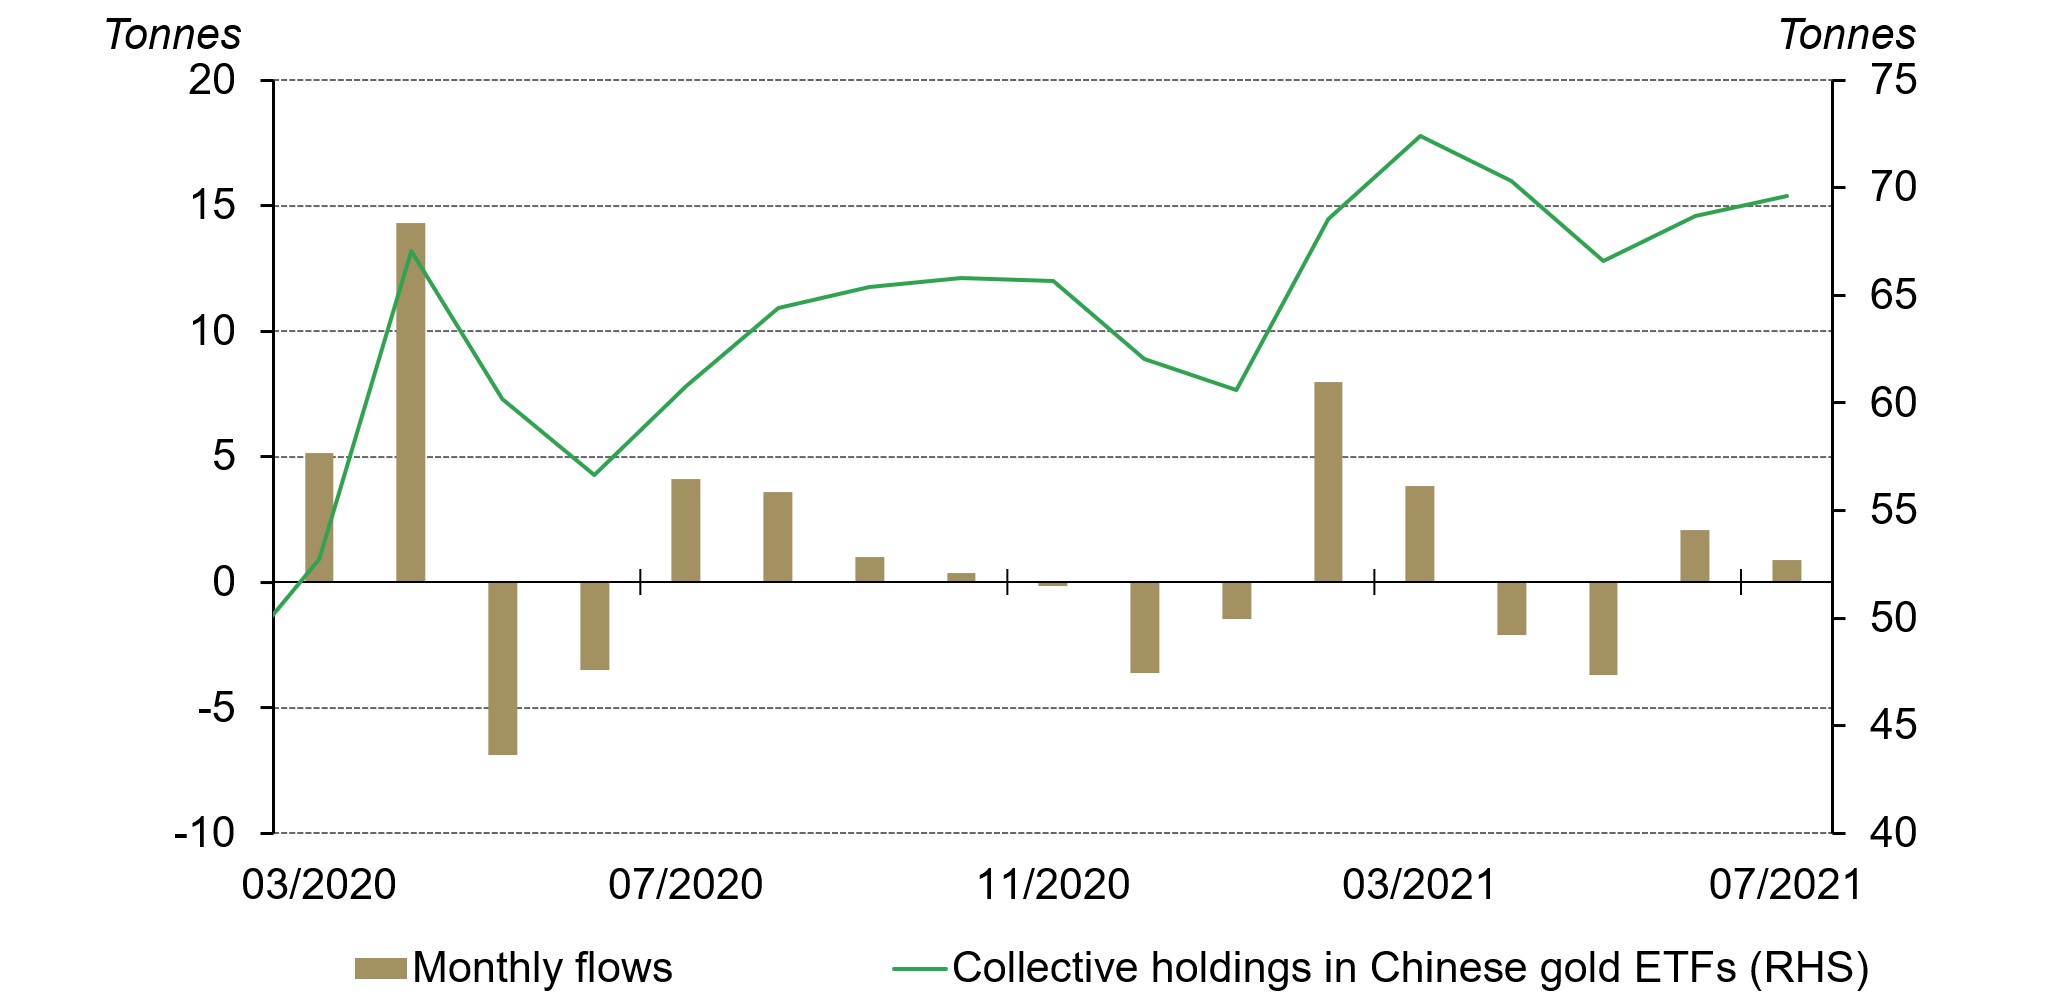
- There was a 0.9t (US$31.8mn, RMB205.6mn) inflow into Chinese gold ETFs last month, bringing total holdings to 69.6t (US$4.1bn, RMB26.2bn)2
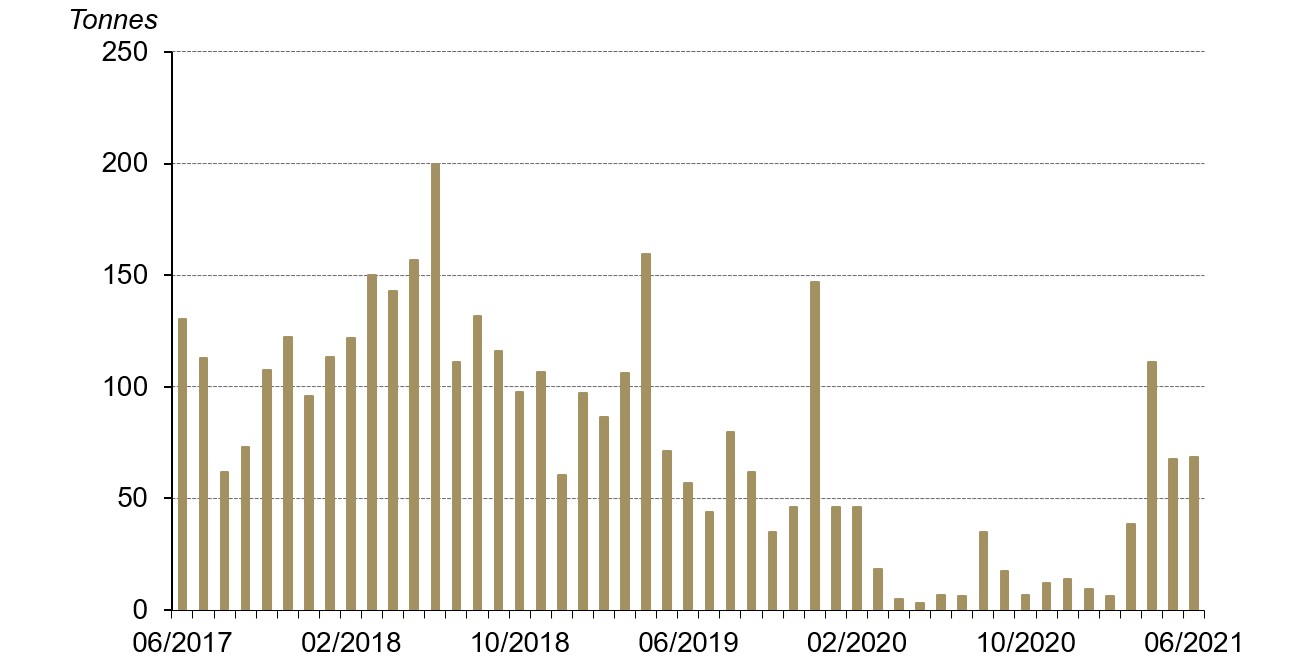
- China’s wholesale physical gold demand fell in July
- Gold held by the People’s Bank of China (PBoC) remained at 1,948t at the end of July, accounting for 3.4% of total reserves – unchanged since September 2019
- China’s gold imports in June surged y-o-y and were higher than June 20193
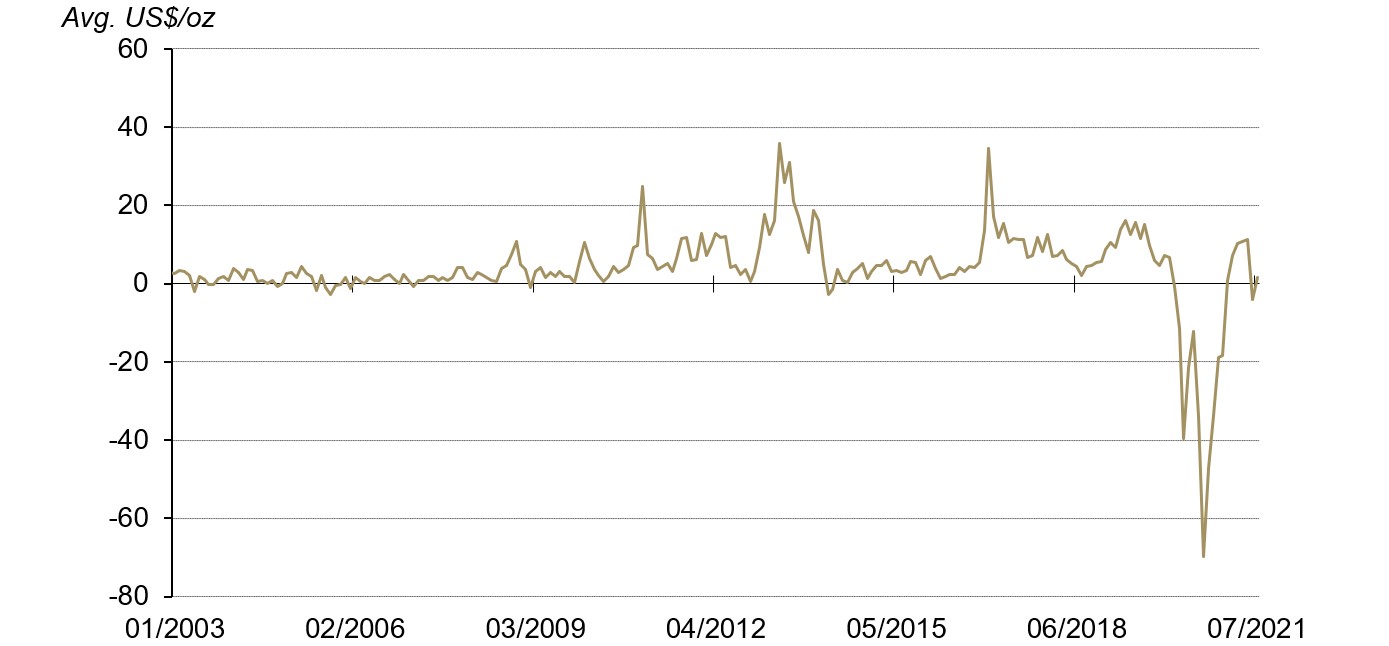
- The local gold price spread turned positive in July, averaging US$1.7/oz4
- With the Delta variant’s presence incities across the nation, many places implemented strict restrictions on social activities and travel. In view of this, China’s physical gold consumption and wholesale demand could face pressures in the coming months.5
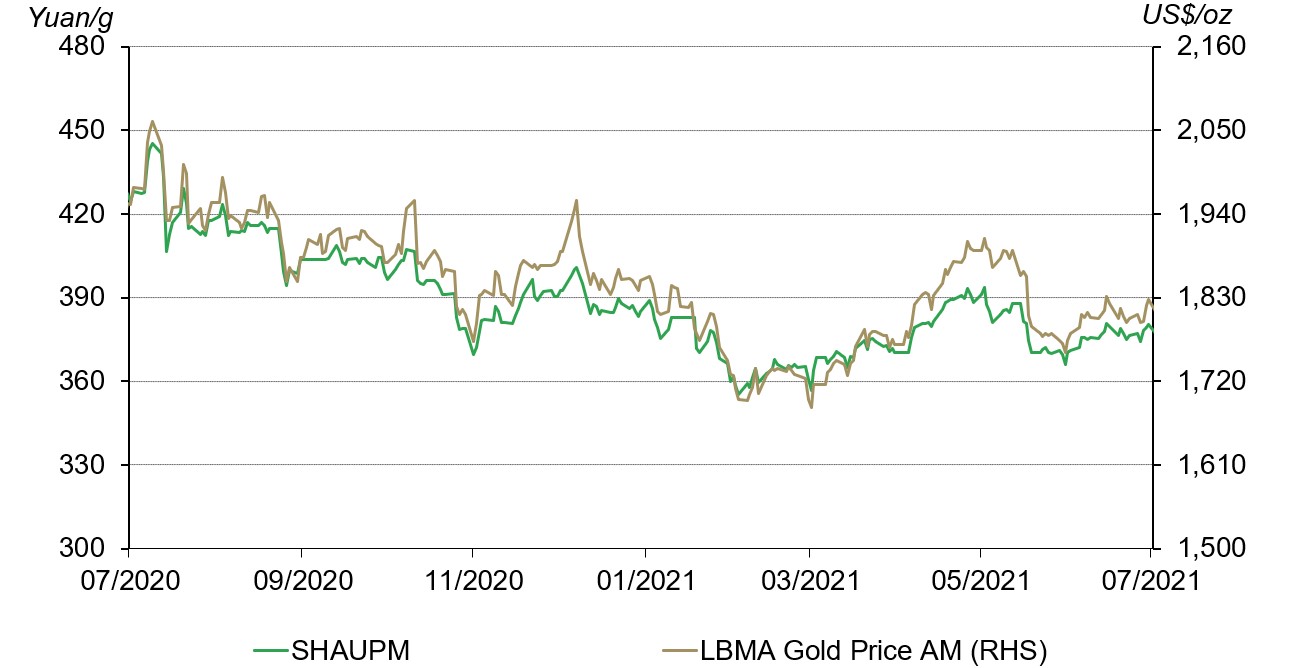
International gold prices rebounded in July. Our short-term model shows that the sharp drop in the 10-year US real treasury yield – a proxy of real interest rates – was the primary driver of rebounding gold prices. The rising net long positioning in gold futures on the COMEX also contributed. During the month, the SHAUPM and the LBMA Gold Price AM rose 3.9% and 4% respectively.6
Gold prices rebounded in July
Source: Shanghai Gold Exchange, ICE Benchmark Administration, World Gold Council
In China, threats of stagflation started to surface. Hit by Typhoon In-Fa, the flood in central China and outbreaks of the Delta variant across multiple cities, China’s economic growth slowed in July as key indicators – including the PMI, exports and imports – weakened. Meanwhile, the y-o-y change in the PPI remained at 9% in July, the highest since October 2008.
Accepting that there are challenges facing China’s economy, the Political Bureau of the CPC Central Committee, in a meeting held at the end of July, decided to keep fiscal and monetary policies accommodative whilst maintaining efforts to stimulate domestic consumption.7
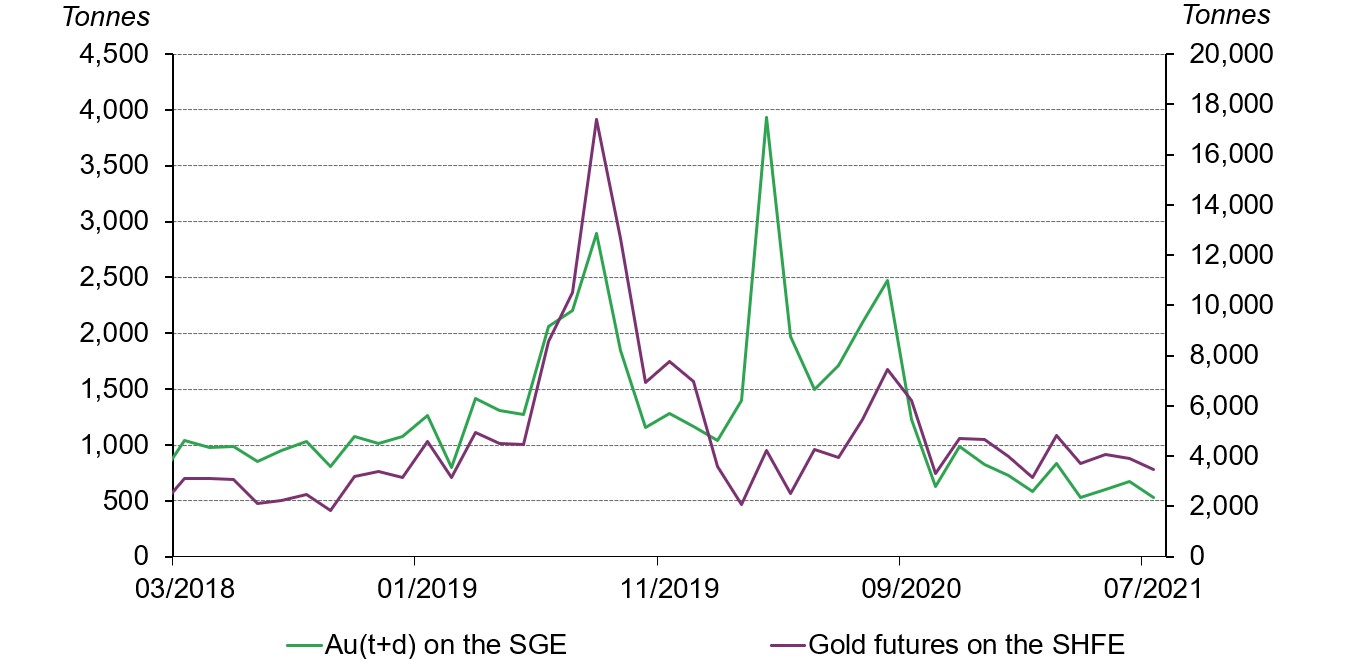
In July, trading volumes of Au(T+D) on the SGE and gold futures on the SHFE were 532t and 3,462t respectively, both lower m-o-m. Lower local gold price volatility could be a key contributor to the subdued trading activities in these margin-traded contracts, as it often means fewer opportunities for short-term traders to profit.
Trading volumes of Au(T+D) and gold futures dropped in July
Monthly trading volumes of the most liquid margin-traded gold contract on the SGE and gold futures on the SHFE*
*Trading volumes of the SGE and SHFE gold contracts count both sides.
Source: Shanghai Gold Exchange, Shanghai Futures Exchange, World Gold Council
Chinese gold ETF holdings totalled 69.6t (US$4.1bn, RMB26.2bn) as of July, a m-o-m increase of 0.9t (US$31.8mn, RMB205.6mn). First, the CSI300 stock index plummeted by 8% in July, its worst month since October 2018, leading to higher safe-haven demand. Second, the local gold price stabilised after a steep fall in June, attracting long-term gold investors to enter the market or increase their holdings at lower costs.
Chinese gold ETF holdings continued to see inflows in July
Source: ETF providers, World Gold Council
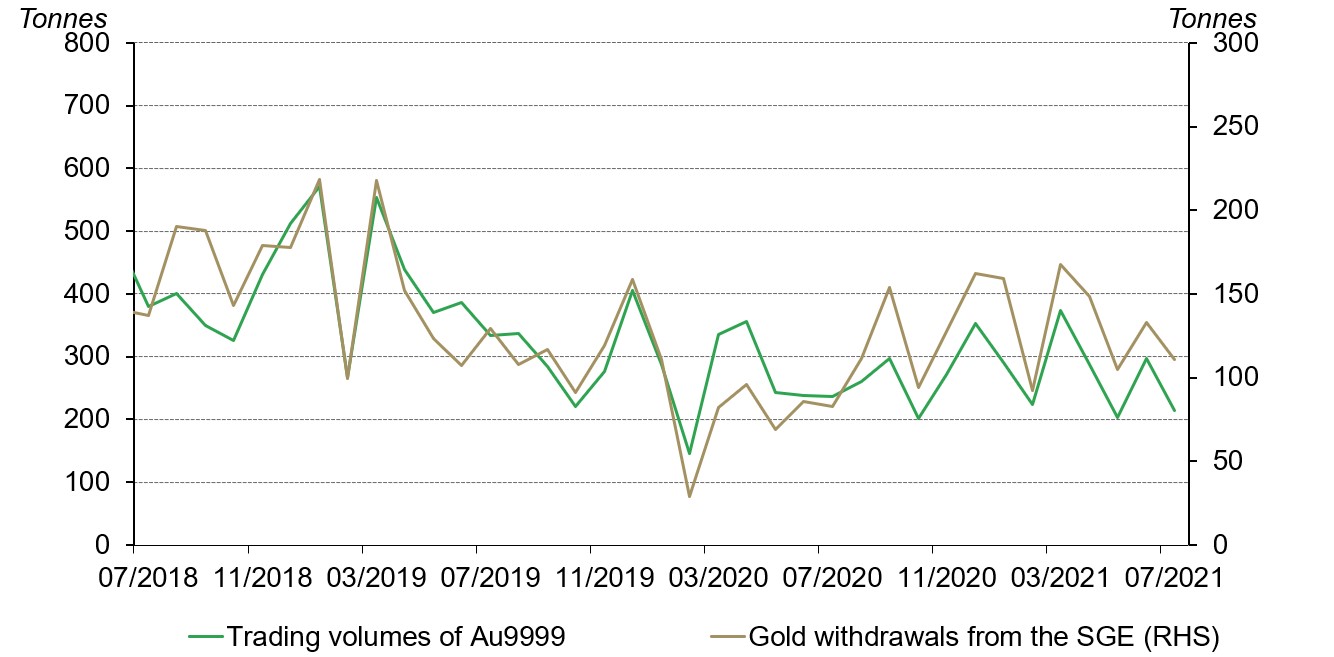
Gold withdrawals from the SGE amounted to 110.6t in July, 22.2t lower m-o-m and 18.7t lower than July 2019. As previously mentioned, China has entered its off season for gold consumption, leading to subdued replenishing activities by manufacturers. What’s worse, the aforementioned natural disasters and outbreaks of the Delta variant across multiple cities further weakened China’s wholesale gold demand.8
China's wholesale physical gold demand fell
Source: Shanghai Gold Exchange, World Gold Council
China imported 68.3t gold in June, 65.4t higher y-o-y and 11.7t higher than June 2019. The significantly increased activity in the global gold supply chain and higher local gold demand compared to June 2020 – when the COVID-19 pandemic was sweeping across the globe – contributed to the normalisation of China’s gold imports.
In the second quarter of 2021 China’s gold imports totalled 246.6t, 232.3t higher y-o-y and only 40t below Q2 2019. As discussed in our Gold Demand Trends report, China’s gold demand in Q2 2021 rose 52% y-o-y and was 4% higher than Q2 2019. Coupled with the stabilising global gold supply chain, China’s gold imports revived rapidly.
Gold imports have recovered to their pre-pandemic levels
Source: China Customs, World Gold Council
The local gold price spread turned positive, averaging US$1.7/oz in July. As the impact of short-term market sentiment faded, local gold demand returned to the driver’s seat of the Shanghai-London gold price spread. Amid the reasonably stable physical gold demand in China the SHAUPM returned to being at premium to the LBMA Gold Price AM. But due to the recent challenges facing China’s gold consumption, the local gold price spread was well below its y-t-d average.
The local gold price returned to being at premium to the international gold price
*SHAUPM vs LBMA Gold Price AM after April 2014; before that, Au9999 vs LBMA Gold Price AM is used. Click here for more.
Source: Bloomberg, Shanghai Gold Exchange, World Gold Council
Footnotes
We compare the LBMA Gold Price AM to SHAUPM because the trading windows used to determine them are closer to each other than those for the LBMA Gold Price PM. For more information about Shanghai Gold Benchmark Prices, please visit Shanghai Gold Exchange
Please note that the inflow/outflow value term calculation is based on the difference between assets under management (AUM) in Chinese gold ETFs in June and July, calculated from the end of period Au9999 prices in RMB.
There is a lag in gold import data due to China’s customs data release schedule
For more information about premium calculation, please visit our local gold price premium/discount page
Please visit China’s gold market in May: holiday-related sales drove retail gold consumption for more information.
Comparison made between the SHAUPM in RMB and LBMA Gold Price AM in USD.
For more information, please visit: Xi chairs leadership meeting to study economic work (qstheory.cn)
For more information about Typhoon In-Fa please visit: China activates second-highest alert for Typhoon In-Fa - Chinadaily.com.cn; For more information about the flood in central China, please visit: Flood claims 73 lives in Henan: Official - Chinadaily.com.cn