A new gold market outlook is available
Explore the key trends that we expect will influence gold's performance in 2021.
Gold gained from risk, rates and momentum
Gold was one of the best performing major assets of 2020 driven by a combination of:
- high risk
- low interest rates
- positive price momentum – especially during late spring and summer.
Gold also had one of the lowest drawdowns during the year, thus helping investors limit losses and manage volatility risk in their portfolios (Chart 1).
By early August, the LBMA Gold Price PM reached a historical high of US$2,067.15/oz as well as record highs in all other major currencies (Table 1). While the gold price subsequently consolidated below its intra-year high, it remained comfortably above US$1,850/oz for most of Q3 and Q4, finishing the year at US$1,887.60/oz.
Interestingly, gold’s price performance in the second half of the year seemed to be linked more to physical investment demand – whether in the form of gold ETFs or bar and coins – rather than through the more speculative futures market. For example, COMEX net long positioning reached an all-time high of 1,209 tonnes (t) in Q1 but ended the year almost 30% below this level. We believe this was due to the dislocation that COMEX futures experienced in March relative to the spot gold price, making it more expensive to hold futures compared to other choices.
Investors’ preference for physical and physical-linked gold products last year further supports anecdotal evidence that, this time around, gold was used by many as a strategic asset rather than purely as a tactical play.
Gold Outlook Chart 1: Gold outperformed major assets in 2020
Gold outperformed major assets in 2020
Yearly returns and maximum drawdowns of select assets*
Sources:
Bloomberg,
ICE Benchmark Administration,
World Gold Council; Disclaimer
*As of 31 December 2020. Returns based on the LBMA Gold Price, Bloomberg Barclays US Treasury Index and Global Treasury Index ex US, Bloomberg Barclays US Corporate and High Yield Indices, MSCI EM Index, Bloomberg Commodity TR Index, MSCI EAFE Index, S&P 500 & NASDAQ Indices, and Bloomberg Oil TR Index. Maximum drawdown computed relative to the 2020 initial value for each respective index.
Gold Outlook Table 1: The gold price is near or above record highs across key currencies
Gold price and annual return in key currencies*
Source: Bloomberg, ICE Benchmark Administration, World Gold Council
*As of 30 December 2020. Based on the LBMA Gold Price PM in local currencies: US dollar (USD), euro (EUR), Japanese yen (JPY), pound sterling (GBP), Canadian dollar (CAD), Swiss franc (CHF), Indian rupee (INR), Chinese yuan (RMB), Turkish lira (TRY), Russian rouble (RUB), South African rand (ZAR), and Australian dollar (AUD).
† All dates correspond to 2020.
Gold investment to react to rates and inflation
Global stocks performed particularly well during November and December, with the MSCI All World Index increasing by almost 20% over the period. However, rising COVID-19 cases and a reportedly more infectious new variant of the virus created a renewed sense of caution. Yet, neither this nor the highly volatile US political events during the first week of 2021 have deterred investors from maintaining or expanding their exposure to risk assets.
The S&P 500 price-to-sales ratio is at unprecedented levels (Chart 2) and analysis by Crescat Capital suggests that the 15 factors that make up their S&P 500 valuation model are at – or very near – record highs. Going forward, we believe that the very low level of interest rates worldwide will likely keep stock prices and valuations high. As such, investors may experience strong market swings and significant pullbacks. These could occur, for example, if vaccination programmes take longer to distribute – or are less effective – than expected, given logistical complexities or the high number of mutations reported in some strains.
Gold Outlook Chart 2: Equity market valuations continue to climb
Equity market valuations continue to climb
Price-to-sales ratio for the S&P 500*
Sources:
Bloomberg,
World Gold Council; Disclaimer
*As of 11 January 2021. Based on weekly data.
In addition, many investors are concerned about the potential risks resulting from expanding budget deficits, which, combined with the low interest rate environment and growing money supply, may result in inflationary pressures. This concern is underscored by the fact that central banks, including the US Federal Reserve and European Central Bank, have signalled greater tolerance for inflation to be temporarily above their traditional target bands.1
Gold has historically performed well amid equity market pullbacks as well as high inflation. In years when inflation was higher than 3%, gold’s price increased 15% on average. Notably too, research by Oxford Economics2 shows that gold should do well in periods of deflation. Such periods are typically characterised by low interest rates and high financial stress, all of which tend to foster demand for gold.
Further, gold has been more effective in keeping up with global money supply over the past decade than US T-bills, thus better helping investors preserve capital (Chart 3).
Gold Outlook Chart 3: Gold has kept up with money supply growth
Gold has kept up with money supply growth
Global M2 growth, US 3m T-bill total return, gold price*
Sources:
Bloomberg,
ICE Benchmark Administration,
Oxford Economics,
World Gold Council; Disclaimer
*As of 31 December 2020. Based on global M2 cumulative growth measured in USD, total return index of 3-month US T-bill and LBMA Gold Price PM USD.
EM economic recovery to benefit consumer demand
Market surveys indicate that most economists expect growth to recover in 2021 from its dismal performance during 2020.3 And although global economic growth is likely to remain anaemic relative to its full potential for some time, gold’s more stable price performance since mid-August may foster buying opportunities for consumers.
The economic recovery may particularly realise in countries like China, which suffered heavy losses in early 2020 before the spread of the pandemic was controlled more effectively than in many western countries. Given the positive link between economic growth and Chinese demand, we believe that gold consumption in the region may continue to improve.
Similarly, the Indian gold market appears to be on a stronger footing. Initial data from the Dhanteras festival in November suggest that while jewellery demand was still below average, it had substantially recovered from the lows seen in Q2 of last year.
However, with the global economy operating well below potential and with gold prices at historical high levels, consumer demand may remain subdued in other regions.
Central bank demand not going away
After positive gold demand in H1, central bank demand became more variable in the second half of 2020, oscillating between monthly net purchases and net sales. This was a marked change from the consistent buying seen for many years, driven in part by the decision of the Central Bank of Russia to halt its buying program in April. Nonetheless, central banks are on course to finish 2020 as net purchasers (although well below the record levels of buying seen in both 2018 and 2019). And we don’t expect 2021 to be much different. There are good reasons why central banks continue to favour gold as part of their foreign reserves (see our Central Bank Gold Reserve Survey 2020) which, combined with the low interest rate environment, continue to make gold attractive.
Mine production likely to improve
Recovery in mine production is likely this year after the fall seen so far in 2020. Production interruptions peaked during the second quarter of last year and have since waned.
While there is still uncertainty about how 2021 may evolve, it seems very likely that mines will experience fewer stoppages as the world recovers from the pandemic. This would remove a headwind that companies experienced in 2020 but that is not commonly part of production drivers. Even if potential second waves impact producing countries, major companies have introduced protocols and procedures that should reduce the impact of stoppages compared to those seen in the early stages of the pandemic.
Putting it all together
The performance of gold responds to the interaction of the various sectors of demand and supply, which are, in turn, influenced by the interplay of four key drivers (Focus 1). In this context, we expect that the need for effective hedges and the low-rate environment will keep investment demand well supported, but it may be heavily influenced by the perceptions of risk linked to the speed and robustness of the economic recovery.
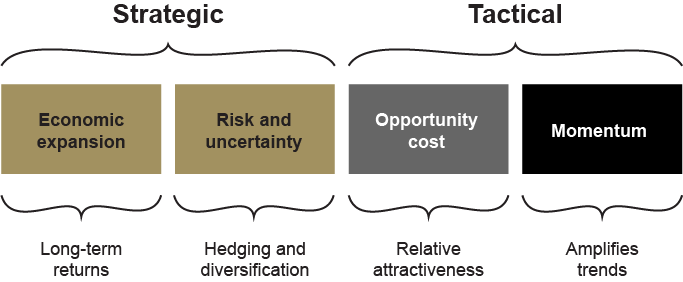
Focus 1: Drivers of gold performance
Gold’s behaviour can be explained by four broad sets of drivers:
- Economic expansion: periods of growth are very supportive of jewellery, technology and long-term savings
- Risk and uncertainty: market downturns often boost investment demand for gold as a safe haven
- Opportunity cost: interest rates and relative currency strength influence investor attitudes towards gold
- Momentum: capital flows, positioning and price trends can ignite or dampen gold's performance
At the same time, we anticipate that the economic recovery in some emerging markets, such as China and India, may limit some of the headwinds the gold market experienced in 2020 caused by extremely weak gold consumption.
Using Qaurum, our gold valuation tool (Focus 2), we analysed the performance of gold as implied by five different hypothetical macroeconomic scenarios provided by Oxford Economics. These are: 4
The results of the analysis suggest that, in general, gold may see a positive, though more subdued, performance in 2021.5 This may be driven primarily by a recovery of consumer demand relative to 2020 as economic conditions improve. In addition, gold’s performance may be boosted further by the prolonged low interest rate environment which would all but remove the opportunity cost of investing in gold.
Alternatively, our valuation model suggests that a global economic relapse from COVID-19 or any other unforeseen risks could result in weak consumer demand, thus creating a headwind for gold’s performance. However, a risk-off environment such the one captured by Oxford Economics’ “deep financial crisis” or “global second wave” may result in strong gold investment demand, which could offset low consumption as it did during 2020. Historically, this behaviour has occurred as investors look for high quality, liquid assets, such as gold, in these risk-off environments.
Focus 2: QaurumSM – Your gateway to understanding gold performance
Qaurum is a web-based quantitative tool that helps investors intuitively understand the drivers of gold performance.
Behind its user-friendly interface, Qaurum is powered by the Gold Valuation Framework (GVF). An academically validated methodology, GVF is based on the principle that the price of gold and its performance can be explained by the interaction of demand and supply.
Accessible from Goldhub.com, the World Gold Council’s data and research site, Qaurum allows investors to assess how gold might react across different economic environments in three easy steps:
- select a hypothetical macroeconomic scenario provided by Oxford Economics, a leader in global forecasting and quantitative analysis, or customise your own
- generate forecasts of gold demand and supply, and view the impact of key macro drivers
- calculate and visualise implied returns for gold.
Based on these, investors can use Qaurum to calculate the hypothetical performance of gold over the next five years as well as long-term 30-year returns implied by GVF and the available (or user-constructed) scenarios.
Additional details on GVF methodology can be found at Goldhub.com.
FT: Fed to tolerate higher inflation in policy shift (August 2020) and The ECB begins its shift to a new inflation goal (October 2020).
Oxford Economics is a leader in global forecasting and quantitative analysis and a specialist in modelling.
Bloomberg consensus forecasts are available by using the function ECFC <GO> in its data terminals.
Visit Qaurum for important disclosure about Oxford Economics’ data, as well as a detailed description of each scenario; the assumptions underlying and data used for each scenario; and its respective hypothetical impact on gold demand, supply and performance.
This is not an exhaustive list of possible outcomes. These five scenarios reflect key investor concerns captured by Oxford Economics’ Global Risk Survey. Hypothetically, improving market sentiment – for example, due to effective vaccination programmes or the containment of the more transmissible COVID-19 variant – could put downward pressure on gold’s price performance relative to the scenarios currently available on Goldhub.com. Investors can modify the inputs using Qaurum’s customisation function.
Important disclaimers and disclosures
© 2021 World Gold Council. All rights reserved. World Gold Council and the Circle device are trademarks of the World Gold Council or its affiliates.
All references to LBMA Gold Price are used with the permission of ICE Benchmark Administration Limited and have been provided for informational purposes only. ICE Benchmark Administration Limited accepts no liability or responsibility for the accuracy of the prices or the underlying product to which the prices may be referenced. Other content is the intellectual property of the respective third party and all rights are reserved to them.
Reproduction or redistribution of any of this information is expressly prohibited without the prior written consent of World Gold Council or the appropriate copyright owners, except as specifically provided below. Information and statistics are copyright © and/or other intellectual property of the World Gold Council or its affiliates (collectively, “WGC”) or third-party providers identified herein. All rights of the respective owners are reserved.
The use of the statistics in this information is permitted for the purposes of review and commentary (including media commentary) in line with fair industry practice, subject to the following two pre-conditions: (i) only limited extracts of data or analysis be used; and (ii) any and all use of these statistics is accompanied by a citation to World Gold Council and, where appropriate, to Metals Focus, Refinitiv GFMS or other identified copyright owners as their source. World Gold Council is affiliated with Metals Focus.
WGC does not guarantee the accuracy or completeness of any information nor accepts responsibility for any losses or damages arising directly or indirectly from the use of this information.
This information is for educational purposes only and by receiving this information, you agree with its intended purpose. Nothing contained herein is intended to constitute a recommendation, investment advice, or offer for the purchase or sale of gold, any gold-related products or services or any other products, services, securities or financial instruments (collectively, “Services”).
This information does not take into account any investment objectives, financial situation or particular needs of any particular person.
Diversification does not guarantee any investment returns and does not eliminate the risk of loss. The resulting performance of any investment outcomes that can be generated through allocation to gold are hypothetical in nature, may not reflect actual investment results and are not guarantees of future results. WGC does not guarantee or warranty any calculations and models used in any hypothetical portfolios or any outcomes resulting from any such use. Investors should discuss their individual circumstancs with their appropriate investment professionals before making any decision regarding any Services or investments.
This information may contain forward-looking statements, such as statements which use the words “believes”, “expects”, “may”, or “suggests”, or similar terminology, which are based on current expectations and are subject to change. Forward-looking statements involve a number of risks and uncertainties. There can be no assurance that any forward-looking statements will be achieved. WGC assumes no responsibility for updating any forward-looking statements.
Information regarding QaurumSM and the Gold Valuation Framework
Note that the resulting performance of various investment outcomes that can generated through use of Qaurum, the Gold Valuation Framework and other information are hypothetical in nature, may not reflect actual investment results and are not guarantees of future results. Neither WGC nor Oxford Economics provides any warranty or guarantee regarding the functionality of the tool, including without limitation any projections, estimates or calculations.