What has changed?
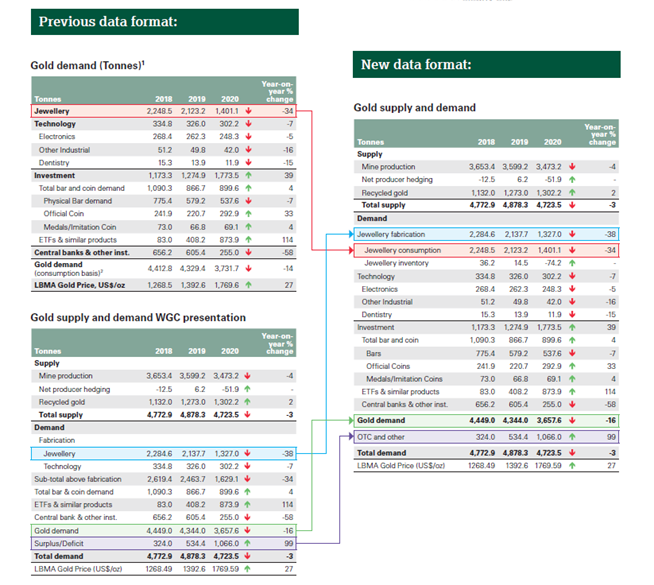
Streamlined demand tables. We have condensed our global gold demand and supply data into one single comprehensive table. The graphic below shows how this new data table (on the right) relates to the two global demand and supply tables previously included in GDT.
Simplified terminology. The more streamlined data tables lend themselves to simplified terminology. We have updated the labels for some of our data series, making them clearer and more accurate. Our Notes and definitions reflect these changes and clearly explain all statistics presented in Gold Demand Trends.
Previously, our GDT statistics included two global demand tables:
- Gold demand (tonnes): this table presented the components of aggregate global gold demand and measured demand using jewellery consumption (i.e. gold jewellery bought by consumers)
- Gold supply and demand WGC presentation: this table presented the components of global gold demand and supply, measured gold demand using jewellery fabrication (i.e. gold jewellery produced by manufacturers, which may also include movement of jewellery held as inventory), and included a surplus/deficit to account for the difference between demand and supply.
Our new, single data table presents the components of aggregate global demand and supply. It includes both jewellery fabrication and consumption, as well as jewellery inventories, illustrating the relationship between these two measures of jewellery demand.
Why make the changes?
The reason for the enhancements are three-fold:
- To avoid duplication of data
- To simplify and streamline the data model
- To calculate gold demand using the measure of jewellery demand further up the supply chain, aligning with the model used in our Gold Valuation Framework.
Presenting the demand and supply statistics across two tables resulted in a duplication of data; both tables necessarily included data for technology, bar and coin, ETFs and central bank demand. Our new table removes this duplication.
The previous presentation method also produced two slightly different measures of ‘gold demand’. The two tables calculated demand using different jewellery measures (fabrication and consumption). Having two different measures of gold demand in the same data model could create confusion. Our new table presents only one figure for gold demand, which is measured using jewellery fabrication. By redirecting our focus further up the supply chain, towards the point at which fabricators buy gold (rather than the points at which it is bought by consumers), our data fits more closely with the model used in our gold valuation framework. Additionally, the use of this measure has the benefit of allowing us to more accurately quantify the value of wholesale jewellery demand. As a result of this change in measurement, annual gold demand shifts by just 0.2% on average over the last 10 years. (The difference between the previous and current measures of gold demand is the volume of jewellery inventory in any given year, which has ranged between -85t and +36t since 2010.)
Finally, the ‘ Surplus/Deficit’ label did not fully explain what was captured within this data series. This element of the model captures various components, including demand in the OTC market (for which data is not readily available), changes to inventories on commodity exchanges, any unobserved changes in fabrication inventories and any statistical residual. It is the difference between total supply and gold demand.
As we continue to look for ways to improve and enhance our research and analysis, these changes help us to achieve our ambition to make our data as clear and easy to understand as possible.