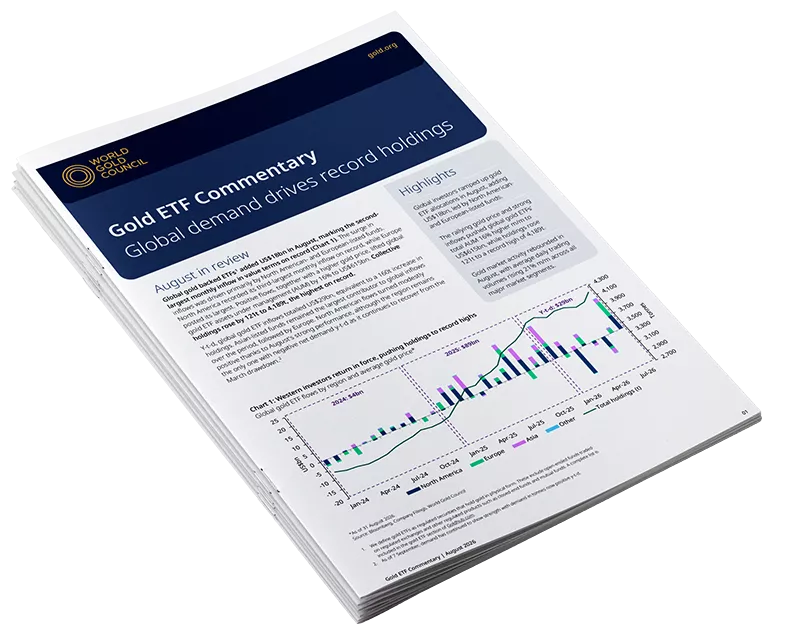
Our Gold ETF Commentary series provides monthly insights into physically backed gold ETF flows, tracking changes in holdings (tonnes) and fund flows (USD). Each report offers regional flow analysis, market context, and relevant indicators such as gold trading volumes and positioning data to help explain shifts in investor behaviour. With timely data and expert analysis, the series is a key resource for monitoring investment demand for gold.
North America dominates inflows
Global physically backed gold ETFs saw their fifth consecutive monthly inflow in September, attracting US$1.4bn. Inflows were concentrated in North America during the month while Europe was the only region that experienced outflows, albeit only mildly. Continuous inflows in recent months trimmed y-t-d outflows of global gold ETFs’ to flip positive to $389mn. It is worth noting that Europe is the only remaining region with y-t-d outflows.
Western demand strength persists
Global gold ETFs saw inflows four months on a trot, attracting US$2.1bn (+29t) in August. Once again, all regions experienced positive flows this month and Western gold ETFs led inflows. Non-stop inflows in recent months have narrowed global gold ETFs’ y-t-d losses to US$1.0bn (-44t). During the first eight months of 2024, Asia has registered the largest regional inflows (+US$3.5bn) while Europe (-US$3.4bn) and North America (-US$1.5bn) have witnessed notable outflows.
Western activity picked up in July
Global physically-backed gold ETFs have now seen inflows three months in a row, adding US$3.7bn in July. Notably, all regions reported positive flows this month with Western gold ETFs contributing the most.
Sustained inflows in June narrowed H1 losses
Global physically backed gold ETFs witnessed their second consecutive monthly inflows, attracting US$1.4bn in June. Inflows were widespread, with all regions seeing positive gains except for North America which experienced mild losses for a second month.
Flows turned positive in May
Physically backed gold ETFs saw their first monthly inflow since last May, amounting to US$529mn. A stronger gold price (+2%) and inflows pushed gold ETFs’ total assets under management (AUM) 2% higher to US$234bn, the highest since April 2022.
Europe drove outflows in April
Global gold ETFs saw outflows of US$2.2bn in April, further extending aggregate losses to eleven consecutive months. Ultimately, North America (+US$124mn) and Asia (+US$1.5bn) were unable to offset sizable European outflows (-US$3.7bn)
Outflows narrowed in March
Global gold ETFs lost US$823mn in March, extending their losing streak to ten months. But outflows narrowed significantly compared to previous months as inflows into North America (+US$360mn) and Asia (+US$217mn) cushioned European losses (-US$1.4bn)
Outflows sustained into February
Global gold ETFs saw their ninth consecutive outflow in February, losing US$2.9bn. North America (-US$2.4bn) bored the brunt of loss, while outflows from European funds (-US$719mn) narrowed. Funds listed in Asia extended their inflow streak to 12 months, adding US$200mn and the Other region experienced limited flow changes.
Latest research
Looking for insight and analysis on gold? Our team of experts produce market-leading research and macroeconomic commentary on gold.
