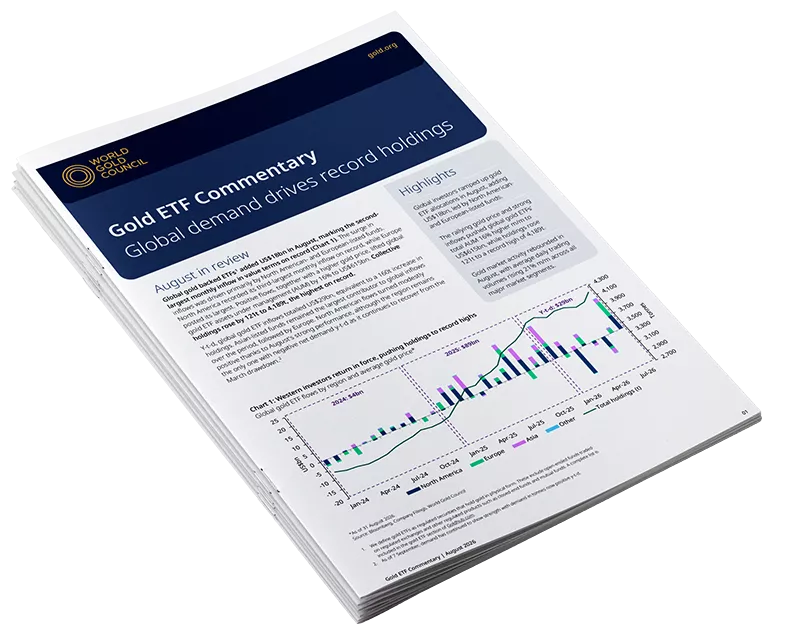
Our Gold ETF Commentary series provides monthly insights into physically backed gold ETF flows, tracking changes in holdings (tonnes) and fund flows (USD). Each report offers regional flow analysis, market context, and relevant indicators such as gold trading volumes and positioning data to help explain shifts in investor behaviour. With timely data and expert analysis, the series is a key resource for monitoring investment demand for gold.
2024 began with continued outflows
Global gold ETFs began 2024 with outflows of US$2.8bn in January, extending their losing streak to eight months. North American (-US$2.3bn) led global outflows and Europe (-US$730mn) also experienced heavy losses. A bright spot in the data came via positive inflows from Asia (+US$214mn).
December outflow compounds 2023 losses
Global physically backed gold ETFs continued to see outflows (-US$1bn, -10t) in December as European losses overshadowed inflows elsewhere. At the end of 2023, their collective holdings stood at 3,225t, a 244t decline during the year. But total assets under management of global gold ETFs rose 6% to US$214bn thanks to a 15% gold price increase in 2023.
Outflows narrowed significantly in November
Global gold ETFs saw a net outflow of US$920mn in November, significantly narrower than October (-US$2bn). North America led global inflows while Europe continued to witness sizable outflows in the month.
Gold ETF commentary: Net outflows narrowed in October
Outflows from physically-backed gold ETFs totalled US$2bn in October, the fifth consecutive monthly loss. Collective holdings reduced by 37t to 3,245t.
Outflows accelerated in September
Physically-backed gold ETFs saw another monthly outflow, losing US$3bn, equivalent to a 59t reduction in holdings by the end of September. Total AUM settled at US$198bn, further impacted by a nearly 4% reduction in the gold price, while collective holdings dropped 2% to 3,282t.
Outflows continued in August
Physically-backed gold ETFs saw net outflows of US$2.3bn in July, equivalent to a 34t reduction in holdings. Despite this, total assets under management (AUM) increased by 2% m/m to US$215bn as a rebound in gold price more than offset negative flows.
Outflows decelerated in July
Physically-backed gold ETFs saw net outflows of US$2.3bn in July, equivalent to a 34t reduction in holdings. Despite this, total assets under management (AUM) increased by 2% m/m to US$215bn as a rebound in gold price more than offset negative flows.
Outflows result in H1 disinvestment
Global gold ETFs experienced net outflows of US$3.7bn (56t) in June, calling a halt to their three-month inflow streak. June’s outflow caused global gold ETF demand during H1 2023 to turn negative, leaving collective holdings of global gold ETFs at US$211bn (3,422t).
Latest research
Looking for insight and analysis on gold? Our team of experts produce market-leading research and macroeconomic commentary on gold.
