Gold ETF Flows: June 2026

H1 flows remain positive

Published:

Highlights

  • June saw continued outflows from funds listed in all regions, yet global gold ETF flows have remained positive y-t-d.
  • Global gold ETFs’ AUM reached US$526bn by the end of June, a 6% fall in H1 due mainly to a lower gold price; collective holdings in the first half were up 18t to 4,047t.
  • Gold market trading volumes pulled back in June yet the H1 average reached an all-time high.

June and H1 in review

Global investors further trimmed their gold ETF holdings in June. Physically backed gold ETFs1 saw outflows of US$8.9bn in the month. All regions experienced outflows with North America losing the most. In the month, global gold ETFs’ total assets under management (AUM) fell 13% to US$526bn, whilst holdings reduced by 74t to 4,047t. 

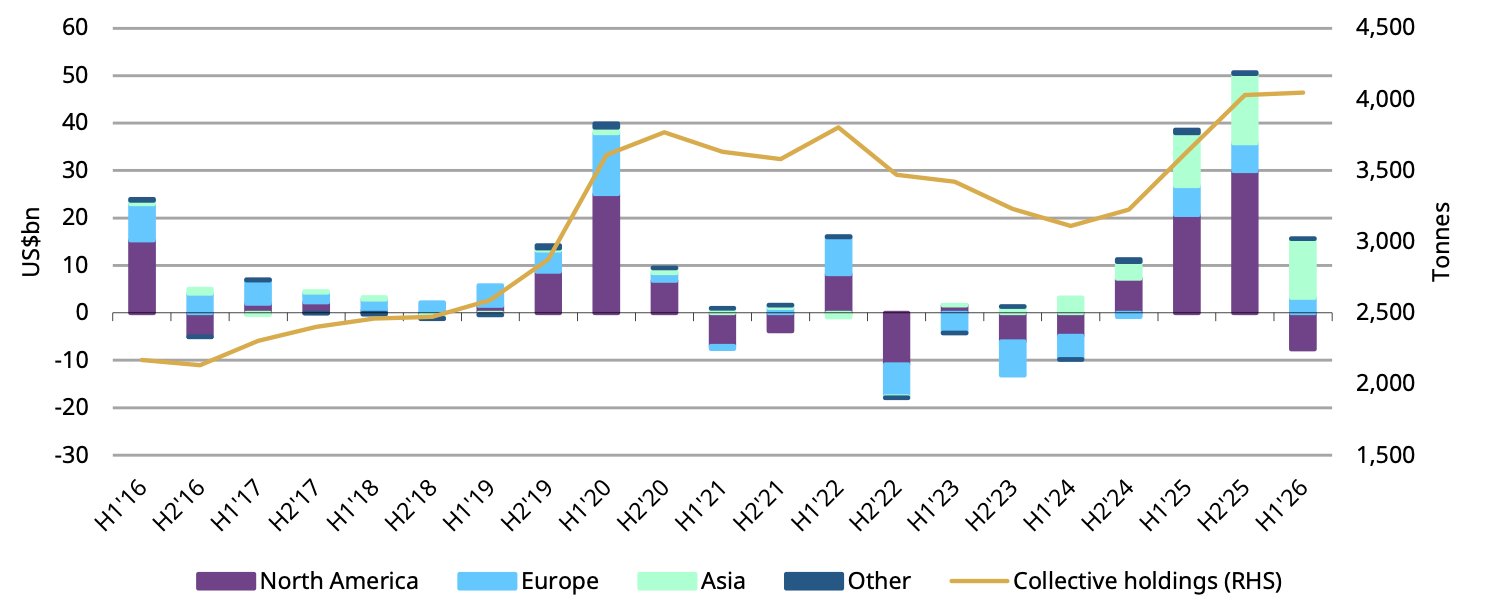
Despite June’s loss, global gold ETF flows remained positive at US$8bn in H1. Asia dominated global inflows – the region’s strongest H1 on record – while North America was the only region with losses. Europe saw healthy inflows. Global gold ETFs’ AUM fell 6% in H1, reflecting the lower gold price despite positive inflows. Collective holdings rose slightly by 18t (Chart 1). 

Chart 1: Global gold ETF inflows in H1 were driven by Asian funds

Global gold ETF flows by region and collective gold holdings*

*As of 30 June 2026. Collective holdings are end-of-period levels. 
Source: Bloomberg, Company Filings, World Gold Council

Regional overview

North American funds lost US$5.5bn in June, bringing the region’s H1 outflows to US$7.7bn and resulting in the weakest first half since 2013. The notable gold price pullback in the month served as a key driver for investors to dial back their allocation to gold ETFs. As new Fed Chair Warsh sent hawkish – as the market interpreted – signals and the US-Iran conflict pushed inflation fears up, expectations intensified of higher interest rates ahead. This anticipation contributed to rising real yields and a strengthening dollar, pushing up investors’ opportunity costs of holding gold. 

Looking ahead, regional gold ETF flows could stabilise. The macro consensus scenario in our 2026 Mid-Year Gold Outlook suggests relatively stable gold performances in H2, with potential catalysts possibly brewing a breakout in other scenarios. Meanwhile, uncertainties surrounding geopolitics, economic growth and financial markets linger. This backdrop may continue to support investor demand for portfolio protection and sustain interest in gold ETFs as a strategic safe-haven allocation.

European funds lost US$818mn in June, trimming their H1 inflows to US$3.2bn. Outflows were seen across major markets in the region during June. Across the region we believe gold price weakness has been a major factor leading to net sales of gold ETFs by investors. Also in June, the European Central Bank hiked rates by 25bps, the first time since September 2023 citing inflation concerns amid the ongoing US-Iran conflict. This move may have deterred some investors from gold. We have also observed continued outflows from FX-hedged products listed in the region, mainly in Switzerland amid local currency depreciation against the dollar, adding to European fund losses in June. 

Asia witnessed outflows of US$2.3bn in June, the worst month on record. Despite so, the region experienced their strongest H1 ever, leading global inflows with US$12bn addition. The June loss was mainly from Chinese funds, as local investor risk appetite continued to improve amid equity market gains and a weaker gold price. Japanese funds also saw outflows in the month as the Bank of Japan hiked rates, pushing up local investors’ opportunity cost of holding gold. India buckled the trend, attracting inflows in the month as local investors remained optimistic about the gold price and view the dip as entry opportunities. 

Funds in other regions saw mild outflows of US$262mn in June, trimming their y-t-d buying to US$106mn. In June, Australian funds shed US$197mn and funds in South Africa lost US$36mn. 


Gold ETF flows

Data as of

Demand captures changes in global/regional gold holdings; fund flows capture the net amount of money (in USD) that comes in or out of gold ETFs globally/regionally. See methodology note.

An unprecedented H1

Global gold market trading volumes2 moderated in June, falling 13% m/m to an average of US$373bn/day as activity cooled across over-the-counter (OTC) and exchange-traded markets. OTC activities declined 13% to US$214bn/day, although continued to run well above the 2025 average of US$180bn/day. Trading volumes at the LBMA averaged US$187bn/day in June, 14% lower than May but 16% higher than the 2025 average. Meanwhile, exchange-traded contract volumes fell 13% to US$153bn/day. The notable exception was the gold ETF market, where trading activity increased 23% m/m to US$6.9bn/day, reflecting sustained investor interest.

Global gold market liquidity surged to record levels in H1 at US$488bn per day; the strongest semi-annual average in our data series (Chart 2). Strength was broad-based, with every major segment posting its most active semi-annual averages on record. OTC trading, led by the LBMA, averaged US$249bn/day, substantially above 2025 levels and underscoring the depth of institutional participation. Exchange-traded volumes also jumped, reaching US$227bn/day – 22% higher than the 2025 average – supported by elevated investor activity. Meanwhile, global gold ETF trading averaged US$12bn/day – up 73% from 2025 – fuelled primarily by robust trading in US funds as investors increasingly turned to gold amid heightened macroeconomic and geopolitical uncertainty.

Despite a weaker gold price, total COMEX net longs rebounded by 16% m/m to 538t, the highest month-end level since January.3 It is noteworthy that managed money net longs have been rising since early June despite a weakening gold price. A closer look at the CFTC positioning data reveals a divergence across investor cohorts: while non-reportable net longs – a proxy for retail participation – reduced during the month, other reportables, which capture large trades outside the managed money category, increased by 16% m/m. 

Over H1, managed money net longs remained broadly stable, declining by just 43t y-t-d. But as was evident in June, investor behaviour through H1 differed: retail positioning largely tracked short-term price movements while larger traders’ positions have, in general, stayed stable since mid-March.

Chart 2: H1 global gold market liquidity rose to the highest in our data series

Average daily trading volumes by segment*
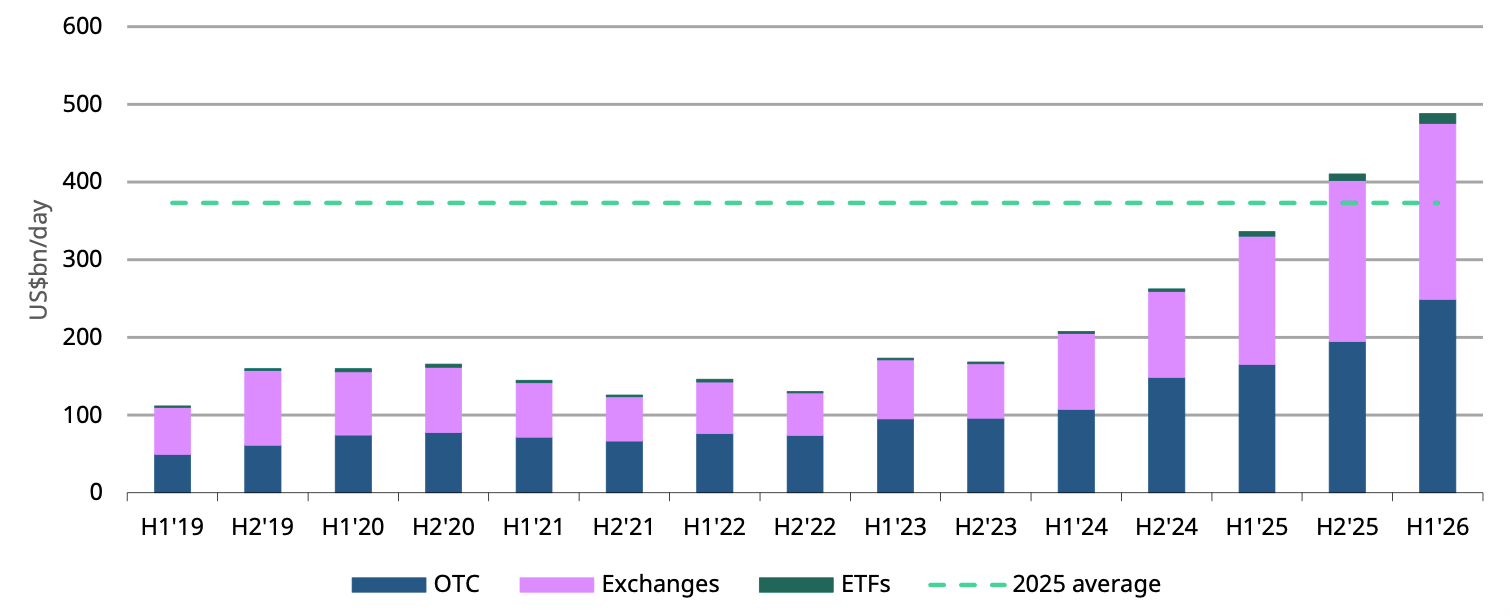
*Data as of 30 June 2026. Gold price based on the monthly average LBMA PM Gold Price USD. 
For more information on trading volumes please visit our Trading Volumes page on Goldhub: Gold Trading Volume | Gold Daily Volume | World Gold Council.
Source: Bloomberg, Nasdaq, COMEX, ICE Benchmark Administration, Shanghai Gold Exchange, Shanghai Futures Exchange, ETF providers, Multi Commodity Exchange of India, Dubai Gold & Commodities Exchange, Japan Exchange Group, Thailand Futures Exchange, Borsa Istanbul, Bursa Malaysia, Korea Exchange, World Gold Council.

Footnotes

  1. We define gold ETFs as regulated securities that hold gold in physical form. These include open-ended funds traded on regulated exchanges and other regulated products such as closed-end funds and mutual funds. A complete list is included in the gold ETF section of Goldhub.com.

  2. Due to LBMA trading volume data availability, our full trading volume dataset dates back to 2019.

  3. Based on CFTC positioning report as of 23 June 2026 due to a delay in reporting amid US holiday arrangements. 

Disclaimer [+]Disclaimer [-]