The drivers of Indian gold demand

Econometric analysis shows that rising income is the most powerful driver of Indian gold demand in the long term. This bodes well for gold demand as the economy is set to benefit from a demographic dividend: the IMF forecasts per capita GDP growth of 23% between 2022 and 2026.1  But while India is the second largest consumer of gold, its per capita consumption is low. And demand faces challenges in the short term: from declining household savings rate and agricultural wages. Income may be the key long-term driver of demand, but it is affected by a variety of other factors, including policy measures. Support from such measures is currently lacking as policy makers view gold demand solely through the prism of imports. Meanwhile, industry efforts to improve transparency are not cohesive. Building trust and improving awareness among consumers, together with innovation, can play a role in enhancing the image of India’s gold industry, boosting domestic demand and allowing it to play a pivotal role in rebuilding household finances in the post-COVID world.


Collective drivers of gold demand

The drivers of gold demand in India are many and varied. Cultural affinity, long-held tradition and festive gifting clearly play a significant role. But these qualitative factors are complemented by quantitative factors, which offer additional and important insights.

In this report, the first in a series of in-depth articles on the Indian gold market, we assess gold demand from a range of perspectives, both quantitative and qualitative. 

First, we consider the findings of a comprehensive econometric analysis of the long- and short-run determinants of Indian gold demand.2  

Second, we analyse demographic, socio-economic and related developments that are likely to shape demand both today and in the future.
We also delve into aspects of Indian demographics and economic development that may help us to understand gold demand today as well as look to the future. 

Quantitative drivers of gold demand 

Using an econometric model, we have drawn on three decades of annual data, dating from 1990 to 2020, to gauge some of the principal influences driving gold demand in India.3  

Long-term drivers  

Our research reveals that, all else being equal, three key factors influence consumer demand for gold over the long-term.4 

  • Income:  for each 1% increase in gross national income per capita, gold demand rises by 0.9%.
  • Gold price level:5  for each 1% increase in the rupee-based price of gold, demand falls 0.4%.
  • Government levies: import duties and other taxes affect long-term demand but the magnitude varies depending on whether gold is bought as jewellery or bars and coins.6  

While the influence of income and price on demand may be widely expected, their comparative weight is perhaps more surprising. Simply put, demand responds more to income than it does to price. This was clearly demonstrated between 2000 and 2010, when demand increased by more than 40% increase from around 700 tonnes to 1000 tonnes per annum, even as the rupee gold price soared by 137%.7  At the same time, per capita income rose 77%, more than offsetting rising prices.8 

Short-term drivers 

Our research also reveals the key econometric factors that influence short-term demand for gold. 

  • Inflation: in common with investors around the world, Indian savers turn to gold as a hedge against inflation. For each one percentage point increase in inflation, gold demand increases by 2.6%.9  
  • Changes in the gold price: while steady price increases or decreases affect long-term demand, sharp price changes have an impact on short-term demand. For each 1% fall in the gold price in any given year, demand increases by 1.2%.10 
  • Tax regime: an increase in the rate of import duties since 2012 has depressed demand for gold by 1.2% per year. 
  • Excess rainfall: a while the monsoon has less of an impact on demand than in the past, it still affects consumer behaviour. A 1% increase in rainfall, compared to the long-run average, boosts gold demand by 0.2%. 

Our econometric model 

Our analysis centred on gold jewellery demand, as this accounted for more than 75% of total demand for gold in India between 1990 and 2020. In general, jewellery demand is more influenced by long-term drivers while demand for gold bars and coins tends to respond more sharply to short-term factors, such as inflation or tax. 

Overall, however, our model provides a useful overview of some of the key factors affecting demand for gold over both the long- and the short-term, particularly income, price, inflation and fiscal policy (which we discuss in detail in Appendix 1 in the full report).11 

As such, it can be used as a framework to help understand broader market trends and consider how they might influence gold demand over the coming years. We discuss these trends below. 


Qualitative trends and influences

India’s demographic dividend

India is the second most populous country in the world with 1.3 billion (bn) inhabitants.12 Not only is the population extensive, but its demographic structure is likely to confer significant economic benefits. Unlike many countries around the world, the Indian population is young and expected to remain so for many years. Today, the median age across the country is just 27 and it is forecast to remain below 35 for the next decade (Chart 1).13


Chart 1: India's population is young

India's population is young

Median age of Indian population in years

India's population is young
Median age of Indian population in years
Note: As of 2019. Forecast estimates of median age are taken from United Nation Population Prospects 2019

Sources: World Gold Council; Disclaimer

Note: As of 2019. Forecast estimates of median age are taken from United Nation Population Prospects 2019 


At the same time, the dependency ratio has been shrinking fast as the working age population (aged between 15 and 64) has grown more rapidly than the dependent population (aged below 15 and above 64). Emerging more than a half a century ago, this trend has become particularly marked over the past 20 years and it is expected to continue in a similar vein until 2040 (Chart 2). As such, the working age population is expected to grow by roughly 7mn per year between 2021 and 2041.14


Chart 2: India's dependency ratio is expected to decline until 2040

India's dependency ratio is expected to decline until 2040

India's dependency ratio, percentage

India's dependency ratio is expected to decline until 2040
India's dependency ratio, percentage

Sources: World Gold Council; Disclaimer

Note: The dependency ratio is the ratio of the population typically not in the labour force (0-14 years and 65+) and the working age population (15-64 years)


This presents major opportunities for India. As research from the Reserve Bank of India indicates, growth in the working age population and participation in the labour force are key determinants of economic growth.15 This suggests that India is set for a period of strong economic expansion, rising incomes and a growing middle class – all of which are conducive to rising gold demand. 

Regional preferences, population shifts and gold demand  

While India is known for its strong, nationwide affinity for gold, this is especially marked among the rural population, where jewellery ownership is considerably higher than it is in urban areas. Consumption patterns also differ between town and country. Jewellery is considered both an investment and adornment in rural areas. City dwellers tend to consider bars and coins as their preferred forms of investment. 

These differences take on a particular significance for gold demand as Indian cities and rural areas change and evolve.

Increasing urbanisation

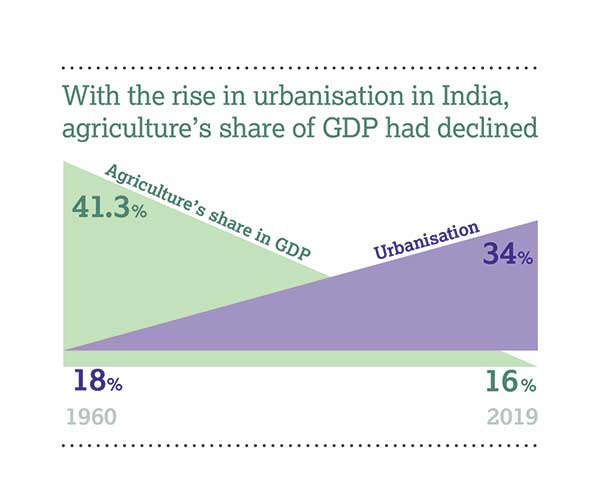
India’s population has long been centred around rural communities. But this is in the throes of change. In 1960, just 18% of the population lived in cities. By 2019, that had almost doubled to an estimated 34% and there is every expectation that such a trend will continue through the coming decades (Chart 3).16 


Chart 3: Urbanisation has accelerated over the last few decades

Urbanisation has accelerated over the last few decades

Percent of India's population living in urban areas

Urbanisation has accelerated over the last few decades
Percent of India's population living in urban areas
Note: World Bank database as of February 2021

Sources: World Bank, World Gold Council; Disclaimer

Note: World Bank database as of February 2021


Growing urbanisation has already contributed to a significant shift in employment patterns. World Bank data shows that agriculture accounted for 63% of employment in 1991. By 2019, that percentage had shrunk to 43% and it is expected to continue falling sharply – to 25.7% by 2050.17 Agricultural income has traditionally been both relatively low and relatively volatile. A shift away from this sector should therefore drive incomes higher and, by extension, bolster demand for gold.

In recent times, new products such as Sovereign Gold Bond and digital gold products promoting micro savings have made an impact on savvy urban investors. The advent of bullion banking and exchange traded products may increase the variety of investment products and channels, which may offer potential opportunities for the industry to innovate.

Agriculture- a sector in flux

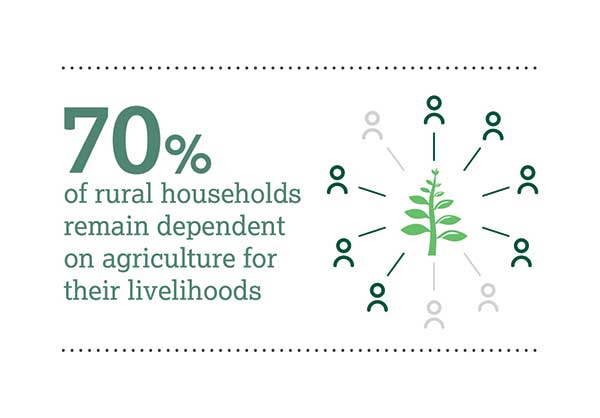
Falling agricultural employment levels reflect changes to farming’s contribution to the Indian economy. In the 1960s, agriculture was responsible for more than 40% of India’s GDP. By 2019, that had reduced to 16% (Chart 4). Notwithstanding this shift, some 70% of rural households remain dependent on agriculture for their livelihoods.18


Chart 4: Agriculture sector contribution to GDP has been in steady decline

Chart 4: Agriculture sector contribution to GDP has been in steady decline

Agriculture sector value added, % of GDP

Chart 4: Agriculture sector contribution to GDP has been in steady decline
Agriculture sector value added, % of GDP

Sources: World Bank, World Gold Council; Disclaimer


And in recent years, the rural economy has suffered, with annual growth in nominal monthly rural wages averaging just 4.6% from 2014 to 2020 (Chart 5). Adjusted for rural CPI, real wages actually declined, on average falling -0.3% in the wake of persistent weakness in wholesale food prices.


Chart 5: Wage growth in rural India has declined since 2011

Wage growth in rural India has declined since 2011

Monthly average of the rural wage rate for men in India across various occupations, % change y-o-y

Wage growth in rural India has declined since 2011
Monthly average of the rural wage rate for men in India across various occupations, % change y-o-y
Note: Data as of February 2021

Sources: Bloomberg, World Gold Council; Disclaimer

Note: Data as of February 2021


Keen to redress the situation, the government announced a series of measures in 2016, designed to double farmers’ income by 2022. Three specific laws were introduced last year to help farmers still further and policies have been launched to boost non-farming rural incomes too (see Appendix 2 in the full report).

The rural economy – structural change

Encouragingly, the rural economy itself is changing. In 1993, rural areas contributed less than 30% to manufacturing output. By 2011, the time of the last census, that percentage had increased to 51.3%.19 A continuation of this trend could deliver meaningful change, particularly in conjunction with recent government policies. Online marketplaces and improving infrastructure are changing consumer aspirations and logistical capabilities. This could dilute the sharp division in consuming and investing habits between rural and urban consumers in the coming years. Taken together, they could engender a period of sustained recovery for the rural economy, driving GDP growth and consumer spending across India. 
 
There could also be considerable consequences for India’s gold industry, as rural households still account for a majority of India’s gold demand. Sustained growth in rural incomes may therefore foster demand for gold. 

Indian income levels are rising

Looking back over the past 30 years underlines how far India has come since the economic liberalisation of 1991. Between that time and 2020, India’s economy grew more than ninefold, its foreign exchange reserves soared from US$1bn to more than US$500bn, the middle class expanded and household incomes rose,20 with per capita net income rising from Rs7000 in the early 90s to Rs134,186 per year in FY2019-20.21 

The coronavirus pandemic has provoked a slowdown in economic growth but long-term prospects remain bright, fuelled by these demographic changes, rising urbanisation and shifts in the rural economy. Analysis from consultancy Bain & Company, for instance, suggests that the number of middle-class households should grow by 140mn between 2018 and 2030, while the number of high-income earners will increase by 21mn.22 

This is likely to presage an almost four-fold increase in consumer spending, from US$1.5tn in 2018 to US$5.7tn by 2030.23  

Such a shift could have mixed implications for gold demand. As our model shows, rising incomes historically translate into increased gold purchases. Demand will also get a boost as more people move up the economic chain from below the poverty level. At the same time however, today’s consumer is increasingly drawn to other forms of expenditure, a trend that may reduce gold’s share of wallet, if left unchecked. 

Comparatively, however, there is scope to raise gold’s per capita consumption in India, which currently ranges between 0.3g-0.6g per person. This is lower than emerging markets in South East Asia such a Vietnam (0.4g-0.7g) and the Middle East, as well as developed economies such as Germany (1.2g – 2.0g) and Switzerland (3.5g-6g)– where demand thrives alongside sophisticated financial markets.24 But for this to happen, gold has to be positioned with unassailable trust among various other competing savings opportunities and supported by transparent access, integrity and fungibility.

A changing environment for gold as an investment

With India’s deep affinity for gold, Indians have historically turned to this asset as a means of preserving their wealth – and increasing its value over time. Now however, attitudes are changing. Consumer spending on other goods has increased, growing financial inclusion has encouraged more people to put their savings in the bank and greater financial literacy has boosted interest in other assets, such as equities. 

Savings and spending 

India has a long tradition of saving. From the 1960s until 2010, for example, the Indian savings rate climbed from 6% to 34.3%.25 Since that time, however, savings as a percentage of GDP have declined, dipping below 30% in 2018 and continuing to inch lower to this day (Chart 6). Rather than hoarding their money, Indian consumers have begun to spend more on goods and services, such as smartphones, designer clothes and travel. 


Chart 6: India's savings rate has declined since 2010

India's savings rate has declined since 2010

Gross domestic savings, % of GDP

India's savings rate has declined since 2010
Gross domestic savings, % of GDP
Note: World Bank database as of February 2021

Sources: World Bank, World Gold Council; Disclaimer

Note:  World Bank database as of February 2021


Growing financial inclusion  

Even as consumer spending has risen, the government has taken steps to clamp down on unaccounted money and increase financial inclusion. These measures have met with considerable success. Between 2011 and 2017, for example, the share of adults with a bank account more than doubled to 80%.26 

The growth in micro finance companies and payment banks has helped to boost financial inclusion in villages and small towns.27 At the same time, soaring smartphone use has allowed Indians to access financial services swiftly and efficiently. Many Indian banks now have smart phone apps, access to high-speed internet is inexpensive in many parts of the country and take-up has been enthusiastic.28 As of the end of 2020, India had the second largest number of internet users in the world, with almost 750mn Indians actively accessing the internet each month.29  

Alternative avenues for investment

There has been growing interest in Indian equities too, following several years of strong growth. This is exemplified by the increase in ‘demat’ accounts, used to hold shares and securities in an electronic (or ‘dematerialised’) format. The number of these accounts almost tripled from 16.7mn in 2009 to 49.8mn by the end of 2020 (Chart 7).30  


Chart 7: Demat accounts have increased steadily

Demat accounts have increased steadily

Demat accounts from 2009 to 2020

Demat accounts have increased steadily
Demat accounts from 2009 to 2020
Note: Data as of December 2020

Sources: World Gold Council; Disclaimer

Note: Data as of December 2020


The amount of money flowing into equities through Systematic Investment Plans (SIP) has also surged in recent years, reflecting growing awareness of mutual fund investment. Average inflows to SIPs more than doubled between 2016 and 2020, from Rs.35bn to Rs.81bn a month (Chart 8).31  


Chart 8: Average monthly inflows into Systematic Investment Plans (SIPs) have been steadily increasing

Average monthly inflows into Systematic Investment Plans (SIPs) have been steadily increasing

Average monthly SIPs, Rs bn 

Average monthly inflows into Systematic Investment Plans (SIPs) have been steadily increasing
Average monthly SIPs, Rs bn
Note: Association of Mutual Funds in India began disclosing monthly SIP contribution data in 2016.

Sources: World Gold Council; Disclaimer

Note: Association of Mutual Funds in India began disclosing monthly SIP contribution data in 2016.


Brighter prospects

Financial inclusion and financial literacy, while beneficial for India’s prosperity and income equality, have created challenges for the gold market. These are particularly evident in rural areas, where physical assets, including gold, have long been considered the preferred form of investment. However, bank account penetration has already reached 80% and, looking ahead, the post-pandemic environment may encourage gold ownership, as the economy rebounds, discretionary spending increases and investors seek out assets that will protect their wealth in the years ahead (Focus 1). 

A framework for investment growth 

In an environment where gold faces unprecedented competition as an investment asset, action is almost certainly required. Our latest consumer research has identified three key focus areas, which would allow gold to retain its long-held position as a valued asset across India and an effective investment.32 

  • Trust: Mandatory hallmaking, good delivery standards for gold bars and a gold spot exchange will drive a sea-change in the Indian gold market, building trust among consumers and investors alike 
  • Education and awareness: An orchestrated campaign explaining how to buy gold could inspire many potential gold investors, especially if this included products that accommodate small incremental investments. Explaining moves in the gold price, on television for example, might also help to allay concerns among less sophisticated investors. 
  • Innovation: Digital tools, such as online platforms, robo-advisors, mobile applications and e-commerce platforms, will drive accessibility and put gold on a par with other investment assets 

Inflationary pressure and gold demand 

Inflation may also spur future interest in gold.  A persistent problem for India, inflation has regularly spiked above 10% over the past four decades, imposing considerable pressure on the economy. Between 2014 and 2020, however, average retail inflation remained below 5% (Chart 9), reflecting lower food price inflation and concerted action from the Reserve Bank of India (RBI).33


Chart 9: Following the 2010 spike above 10%, Indian inflation has been relatively benign in recent years

Chart 9: Following the 2010 spike above 10%, Indian inflation has been relatively benign in recent years

Consumer price index, annual % change 

Chart 9: Following the 2010 spike above 10%, Indian inflation has been relatively benign in recent years
Consumer price index, annual % change
Note: As per IMF World Economic Outlook 2020 database

Sources: International Monetary Fund, World Gold Council; Disclaimer

Note: As per IMF World Economic Outlook 2020 database


In recent months, there have been signs of change. Food and fuel prices have started to rise and retail inflation has followed suit, reaching a six-month high of 6.3% in May 2021.34 In the months ahead, soaring commodity prices and logistical costs are expected to impose further pressures and the RBI has already adjusted its inflation expectations higher, setting a forecast of 5.4% for the next three months from July to September, compared to 5.2% for April to June 2021.35 Household inflation expectations have also risen, suggesting a growing concern among consumers about the months ahead. 

As we state above, rising inflation tends to drive gold demand. Gold is perceived as a strong hedge against inflation and decades of data supports this assumption. 

Focus 1: COVID-19 and the impact on Indian gold demand


The Indian economy plummeted in 2020 as the pandemic unfolded. To curb the virus, at the end of March 2020, India imposed a two-month nationwide lockdown, impacting jobs and the economy. As a result, Q2 2020 GDP growth contracted by 24.4% y-o-y. With the gradual re-opening of the economy in Q3 2020, sentiment improved but GDP still contracted by 7.4%.36 

By contrast, the rural economy was relatively unscathed. Rural incomes were boosted due to agriculture and related activities being categorised as essential services during lockdown, higher minimum support prices and a positive monsoon. Despite the contraction in the broader economy, the agriculture sector grew by 3.5% and 3% in Q2 and Q3 2020 respectively.37 

Considering the impact of the pandemic on India’s gold market specifically, gold recycling volumes dropped by nearly 20% in 2020.38 This was despite average annual local gold prices being 28% higher and annual jewellery demand being 42% lower in the year.39 This is counterintuitive but validated by our econometric analysis showing that recycling had a lower correlation with both the gold price and jewellery demand. Lower recycling volumes were partly driven by the inability to sell gold during the lockdown- to a large extent the reflection of the absence of distress selling- as well as a higher propensity for gold consumers to exchange existing gold for new wedding purchases and by consumer preferences to secure loans against gold rather than sell it outright ahead of higher price expectations. 

The pandemic wreaked a similarly severe impact on Indian jewellery demand, which was slashed 42% in 2020 by a combination of the sharp economic slowdown, higher local gold prices and postponement of weddings.40 The pandemic also impacted the nature of gold investment, as store closures reduced access to physical investment products, encouraging a shift towards gold ETFs. The rising gold price, increased volatility in equity markets and economic uncertainty fuelled further safe haven demand into gold ETFs. Inflows into Indian gold ETFs almost dubled in 2020, taking total gold holdings to 28.3t by the end of the year.41 

Looking at 2021 to date, a healthy rebound in the economy with GDP growth of 1.6% in Q1 2021 - and lower infection rates boosted gold demand in Q1.42 However, the emergence of a more severe second wave of infections from April onwards once again hit consumer sentiment, with lockdown restrictions implemented across large parts of the country. Importantly, the ferocity and spread of the second wave of COVID-19 affected rural India, impacting income levels and forcing many rural consumers to sell gold to fund medical expenditures during the second wave. The ebbing of infections in Q3, together with a pick up in the pace of vaccination and easing of restrictions led to a rebound in economic activity in the quarter, mitigating the need for further distress selling. Higher foodgrain production, a normal monsoon and government support should further provide support to the rural income in 2021. Gold can also benefit from higher level of savings amid the pandemic - particularly in rural India where the metal still attracts a sizeable proportion of rural savings.43 

Looking back over the past 40 years, for example, gold has delivered an average annual return of 10% in rupees, clearly outperforming CPI inflation, which expanded by an average of 7.3% over the same period.44  

Gold’s performance has also been particularly strong when inflation was high, increasing by 11% on average, when inflation rose above 7%.45 As inflationary pressures tick up therefore, historical precedent would suggest that demand for gold will follow. 

Government policies and the impact on gold 

India is unusual. Even though the country is one of the leading sources of gold demand worldwide, there is almost no domestic production. As such, when demand rises, imports tend to rise in sync. This can, at times, have a significant effect on India’s trade balance and current account.

This was particularly in evidence after the Global Financial Crisis, when gold imports rose sharply, reaching a high of Rs2,922bn by FY 2012/13, almost 20% of total imports to India.46 A combination of rising demand for gold, reduced demand for Indian exports and soaring oil prices had severe implications for India’s current account deficit (CAD). From less than Rs116bn in 2001, the deficit surged to Rs4,796bn in FY2012/13, equivalent to 4.8% of GDP.47

Faced with this fiscal imbalance, the government-imposed restrictions on a raft of imported goods, including gold. Duties on gold imports increased fivefold in less than two years, from 2% in January 2012 to 10% in August 2013. The government also implemented the 80:20 rule, under which gold importers were required to export 20% of their gold as jewellery.48 Recognised as unwieldy and market-distorting, the rule was scrapped in November 2014 but import duties remained at elevated levels. And in July 2019, they were raised still further to 12.5%, as part of a series of tax-raising initiatives designed to improve the government’s fiscal position.49  

The basic custom duty (BCD) on gold was reduced to 7.5% at the Union Budget of 2021-22 but, in combination with other levies, total import duties on gold still stand at 10.75%, (compared to 12.875% before the budget).50 

The unofficial market 

Over the years, government policies on gold have had widespread consequences. Back in 2013 and 2014 for example, import duties and the 80:20 rule pushed up the gold price premium in the local market, created uncertainty and deterred some potential gold buyers. 

But there is a far more pernicious consequence of high import duties and other such restrictions: they tend to drive parts of the gold supply chain underground. Between Q3 2013 and Q4 2014, some 335t of gold was smuggled into the country, around a quarter of total demand. And, in the second half of 2019, while official imports fell and the CAD narrowed, unofficial imports surged by 42%.

In the face of huge, smuggled inflows of gold, the efficacy of successive import restrictions has been called into question. There is a further consequence too – the more pervasive India’s unofficial gold market becomes, the more difficult it is for the mainstream market to advance and develop. A reduction in tax rates could therefore confer benefits on two fronts. Lower duties would almost certainly boost overall demand for gold. And lower tax rates could create more opportunities for the compliant and organised sections of the gold market by squeezing out the unofficial or ‘grey’ market. 

This could have a meaningful impact on India’s role on the global gold stage. A direct consequence of high rates of duty, grey trading severely reduces gold’s role in mainstream financial services, it limits the appeal of India’s handcrafted jewellery overseas and it curtails India’s influence in the gold trading market. 

It should also be noted that gold imports have accounted for just 7% of total imports (Chart 10) over the past eight years. Over the same period, electronics imports accounted for 11% of total imports, while crude oil made up 24% of the total. The CAD has also fallen, averaging Rs2,112bn over the last seven years (Chart 11). 
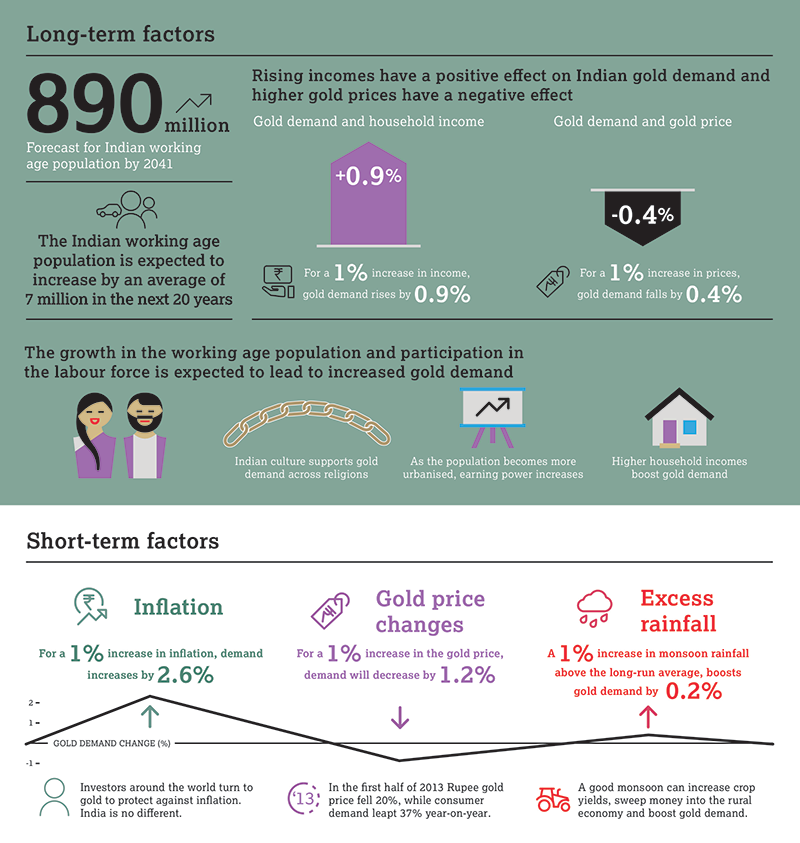
 

Chart 10: Gold imports moderated after 2013

Gold imports moderated after 2013

Gold imports, Rs bn and as a % of total imports 

Gold imports moderated after 2013
Gold imports, Rs bn and as a % of total imports
Note: FY refers to financial year (April-March)

Sources: World Gold Council; Disclaimer

Note: FY refers to financial year (April-March)


Outlook

Demand for gold may be more subdued than expected this year, following India’s prolonged battle with COVID-19. However, imports remain strong and retail demand is expected to pick up, as restrictions are gradually lifted across the country. In 2022, economic growth and the impact of pent-up demand for gold are likely to presage a period of robust demand, although any future outbreaks of coronavirus could create further uncertainties.   

Looking longer term, the Indian gold market is influenced by both positive and negative factors. On the upside, the economy is expected to benefit from several robust structural factors. 

  • First, rapid growth in the working age population over the next two decades will create a strong and sustained demographic dividend. 
  • Second, continued urbanisation will drive and support economic expansion.
  • Third, higher penetration of both the manufacturing and services sectors in rural areas will reduce their reliance on agriculture and deliver more stable incomes for millions of households.

As our econometric model illustrates, rising incomes are one of the biggest single drivers of long-term gold demand. This suggests that, as India’s economy grows, demand for gold should increase. However, the Indian gold market also faces several challenges.

  • Households are saving proportionately less than they used to, which may reduce the amount of capital they allocate to gold.
  • Financial inclusion is increasing, which provides investors with other sources for their savings beyond physical gold.
  • Government policies can impact demand and inadvertently foster India’s unofficial market.
  • Agricultural wages are still in decline, despite government actions in recent years. 
 

Chart 11: India's current account deficit has narrowed with moderation in gold imports

India's current account deficit has narrowed with moderation in gold imports

India's current account deficit, Rs bn and as % of GDP

India's current account deficit has narrowed with moderation in gold imports
India's current account deficit, Rs bn and as % of GDP
Note: FY refers to financial year (April-March)

Sources: Reserve Bank of India, World Gold Council; Disclaimer

Note: FY refers to financial year (April-March)


Taking all these factors into consideration, it would seem that the gold market is at a crossroads. Should government plan to increase farmers’ income by 2022 succeed, this would boost rural wages, lending further support to the market. Should the government choose to impose further tax increases, import restrictions or other adverse policies relating to gold, demand could be stifled or driven underground. 

Looking ahead, it would appear that India’s gold market is most likely to benefit from positive demographic and socio-economic changes if the industry takes steps to become more transparent, more standardised and more in line with global peers. The social and cultural transformations taking place in India should be underpinned by concerted efforts to provide easy access, and improve integrity and fungibility to reinforce trust in gold as an asset. 

Such moves would increase trust, boost confidence and allow the gold market to truly capitalise on India’s growing wealth. A more robust market would encourage Indian consumers and investors to see value in gold even as they become wealthier and more sophisticated. Overseas, a more reliable market would foster demand for Indian gold products the world over and allow India to take its rightful place on the global gold stage. 

Footnotes

1IMF World Economic Outlook October 2021, GDP per capita in constant rupee terms

2We used a common approach to estimating long and short-term effects called Error Correction Model (ECM), which we applied to determine the drivers of gold consumer demand using data from 1990 to 2020. See Appendix 1 in the full report for more details.

3Prior to the 1990s, government regulation made gold imports illegal. This changed in 1992, resulting in a structural change in gold market dynamics. We concentrate on the period starting in the 1990s for three reasons: 1) to have a consistent model across the various demand categories; 2) to avoid difficulties modelling the structural shift; and 3) because econometric models using series for which the pre-1990s data is available and seemingly reliable (e.g. jewellery) delivered results consistent with those using post-1990 data.

4Consumer demand for gold is defined as gold jewellery plus bar and coin demand.

5Gold price level refers to the absolute gold price, rather than changes in that price.

6See Appendix 1 in the full report for more details.

7Gold Demand Trends, World Gold Council

8IMF World Economic Outlook October 2021

9This relationship holds when all the other variables are constant except inflation.

10In the second half of 2019, for example, the rupee gold price rose 15% while consumer demand fell by 24%.

11Our models cover jewellery demand, bar and coin demand, as well as recycling; we don’t include an econometric model for gold ETFs, as they have been available to investors for less than 20 years, a good portion of which constitutes an accumulation phase, making it difficult to isolate the underlying macroeconomic drivers.

12United States Census Bureau.

13UN World Population Prospects 2019.

14Working age population growth, India Economic survey 2018-2019.

15RBI paper

16World Bank population estimates and projections.

17India Economic Survey 2017-18.

18Food and Agriculture Organization of the United Nations.

19NITI Aayog

20 RBI’s monthly bulletin February 2021.

21 Statistical-Appendix-in-English.pdf (indiabudget.gov.in)

22Consultancy.org

23Consultancy.org

24The per capita gold consumption is the range for minimum and maximum consumption per capita value during 2015-2020.

25World Bank

26World Bank

27Microfinance companies are the financial institutions that offer small-scale financial services especially to the poor in rural, semi-urban and urban areas. Payments banks are a new model of banks conceptualised by the Reserve Bank of India. These banks can accept a restricted deposit but cannot issue loans or credit cards.

28UPI goes live, banks introduce payment apps on Google Play Store

29Internet World Stats.

30Securities and Exchange Board of India

31Association of Mutual Funds in India.

32Retail Insights, India.

33In August 2016, the RBI announced an inflation target of 4% with 6% and 2% as the upper and lower tolerance levels, respectively, for the period up to 31 March.2021

34Goldhub blog, World Gold Council

35RBI’s monetary policy statement, June 4 2021

36Bloomberg, Q2 refers to second quarter of the calendar year (January to December)

37 Bloomberg

38Metals Focus

39Metals Focus

40Metals Focus

41The relevance of gold as a strategic asset, India edition 2021

42Bloomberg

43Report of the Household Finance Committee, 2017

44Based on average annual CPI changes for India as measured by the IMF from December 1980- December 2020.

45The relevance of gold as a strategic asset, India edition 2021

46Department of Commerce, Ministry of Commerce and Industry.

47Reserve Bank of India.

48The 80:20 rule came into effect on 22 July 2013 and was in force until 28 November 2014.

49World Gold Council.

50Union Budget Impact on Indian gold market.


Copyright and other rights

© 2021 World Gold Council. All rights reserved. World Gold Council and the Circle device are trademarks of the World Gold Council or its affiliates.

All references to LBMA Gold Price are used with the permission of ICE Benchmark Administration Limited and have been provided for informational purposes only. ICE Benchmark Administration Limited accepts no liability or responsibility for the accuracy of the prices or the underlying product to which the prices may be referenced. Other content is the intellectual property of the respective third party and all rights are reserved to them. 

Reproduction or redistribution of any of this information is expressly prohibited without the prior written consent of World Gold Council or the appropriate copyright owners, except as specifically provided below. Information and statistics are copyright © and/or other intellectual property of the World Gold Council or its affiliates (collectively, “WGC”) or third-party providers identified herein. All rights of the respective owners are reserved.

The use of the statistics in this information is permitted for the purposes of review and commentary (including media commentary) in line with fair industry practice, subject to the following two pre-conditions: (i) only limited extracts of data or analysis be used; and (ii) any and all use of these statistics is accompanied by a citation to World Gold Council and, where appropriate, to Metals Focus, Refinitiv GFMS or other identified copyright owners as their source. World Gold Council is affiliated with Metals Focus.

WGC does not guarantee the accuracy or completeness of any information nor accepts responsibility for any losses or damages arising directly or indirectly from the use of this information. This information is for educational purposes only and by receiving this information, you agree with its intended purpose. Nothing contained herein is intended to constitute a recommendation, investment advice, or offer for the purchase or sale of gold, any gold-related products or services or any other products, services, securities or financial instruments (collectively, “Services”). This information does not take into account any investment objectives, financial situation or particular needs of any particular person. 

Diversification does not guarantee any investment returns and does not eliminate the risk of loss. The resulting performance of various investment outcomes that can be generated through allocation to gold are hypothetical in nature, may not reflect actual investment results and are not guarantees of future results. WGC does not guarantee or warranty any calculations and models used in any hypothetical portfolios or any outcomes resulting from any such use. Investors should discuss their individual circumstances with their appropriate investment professionals before making any decision regarding any Services or investments.

This information contains forward-looking statements, such as statements which use the words “believes”, “expects”, “may”, or “suggests”, or similar terminology, which are based on current expectations and are subject to change. Forward-looking statements involve a number of risks and uncertainties. There can be no assurance that any forward-looking statements will be achieved. WGC assumes no responsibility for updating any forward-looking statements.

Information regarding QaurumSM and the Gold Valuation Framework

Note that the resulting performance of various investment outcomes that can generated through use of Qaurum, the Gold Valuation Framework and other information are hypothetical in nature, may not reflect actual investment results and are not guarantees of future results. WGC provides no warranty or guarantee regarding the functionality of the tool, including without limitation any projections, estimates or calculations.