China gold market update: June concludes a divided H1
14 July, 2026
Highlights
- A weak June erased gold’s earlier gains, ending H1 with losses
- Despite June outflows, Chinese gold ETFs witnessed notable inflows in H1, pushing their total assets under management (AUM) mildly higher to RMB243bn (US$36bn) and holdings up by 29t to 277t
- Wholesale demand rebounded m/m in June, yet the H1 total remains well below the ten-year average
- The People’s Bank of China (PBoC) announced a 15t gold purchase in June, the largest monthly purchase since October 2023, accumulating a 40t increase in official holdings during H1
- Entering H2, local gold ETF outflows narrowed significantly as prices stabilised. Yet weak Au9999 trading volumes and subdued local price spreads indicate continued softness in physical demand in early July.
Looking ahead
- Gold jewellery consumption is likely to remain weak during the off-season but we expect the stabilising gold price to offer some support. Meanwhile, investment demand continues to depend on the gold price trend and local equity market strength.
June weakness wiped out H1 gains
Gold fell further in June. Messages from the new Fed Chair, Kevin Warsh, at the monetary policy meeting last month were seen as hawkish, pushing up real yields and the dollar. This has led to investors reducing their gold ETF holdings and tilting their option positioning to bearish – rising opportunity costs and cooling momentum were the two major factors denting gold in June.1 Both the LBMA Gold Price PM and the Shanghai Benchmark Gold Price PM were down by 11%.
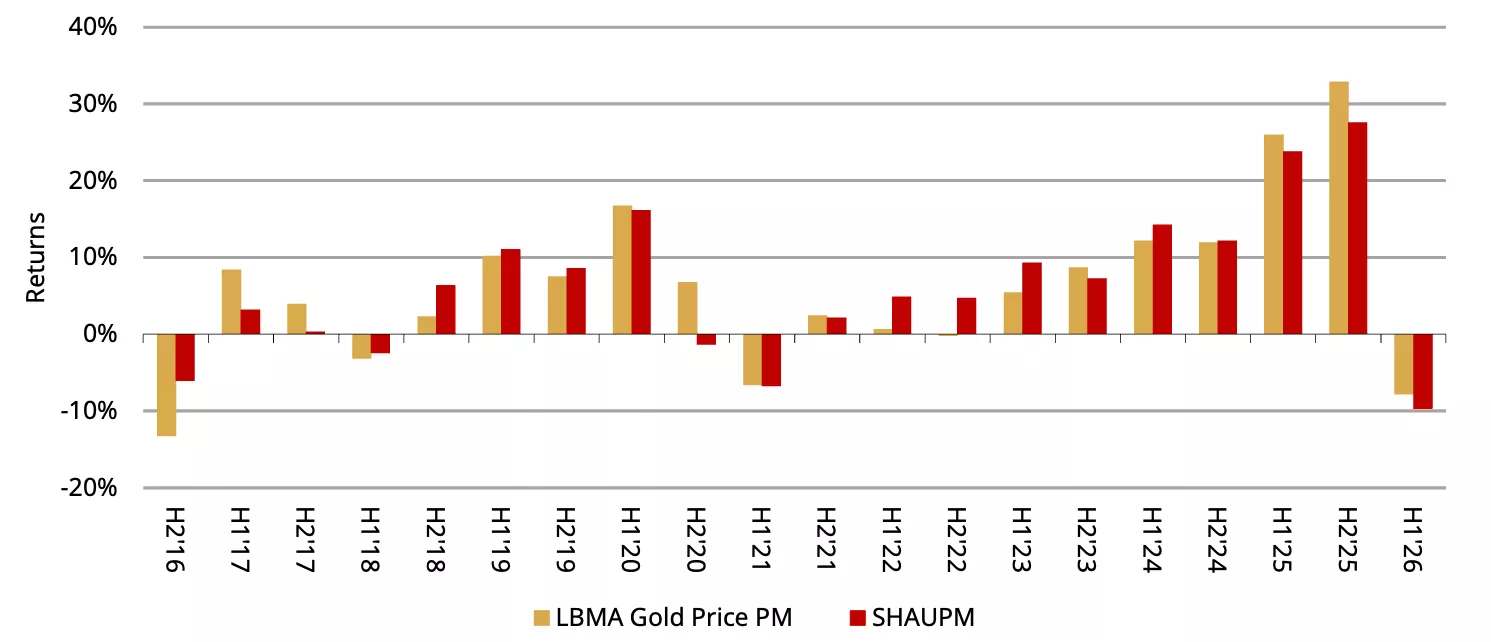
A weak June reversed gold’s earlier gains, leading to losses in H1. As detailed in our Gold Mid-Year Outlook 2026, gold has had a roller-coaster ride over the first half year – various risks, changes in investor positioning and opportunity costs explain most of its variability. The international gold price in USD was down 8% in H1 while the RMB gold price plummeted 10% – the strengthening Chinese currency against the dollar amplified local gold price weakness (Chart 1).
Chart 1: Gold saw the first semi-annual decline since 2021
Semi-annual returns of gold prices in USD and RMB*
*Data to 30 June 2026. Based on the LBMA Gold Price PM in USD and the Shanghai Benchmark Gold Price PM in RMB.
Source: Shanghai Gold Exchange, ICE Benchmark Administration, World Gold Council
Chinese gold ETFs saw notable inflows in H1 despite June’s loss
Chinese gold ETFs lost RMB15bn (US$2.2bn) in June, the worst month on record. The sizable outflow and a falling gold price brought Chinese gold ETFs’ total AUM down 16% to RMB243bn (US$36bn), the lowest level since December 2025. Meanwhile, holdings decreased 17t to 277t. A weaker gold price dimmed local investor interest during the month while their enthusiasm towards equities – reflected in surging new account openings – further diverted attention away from gold.2
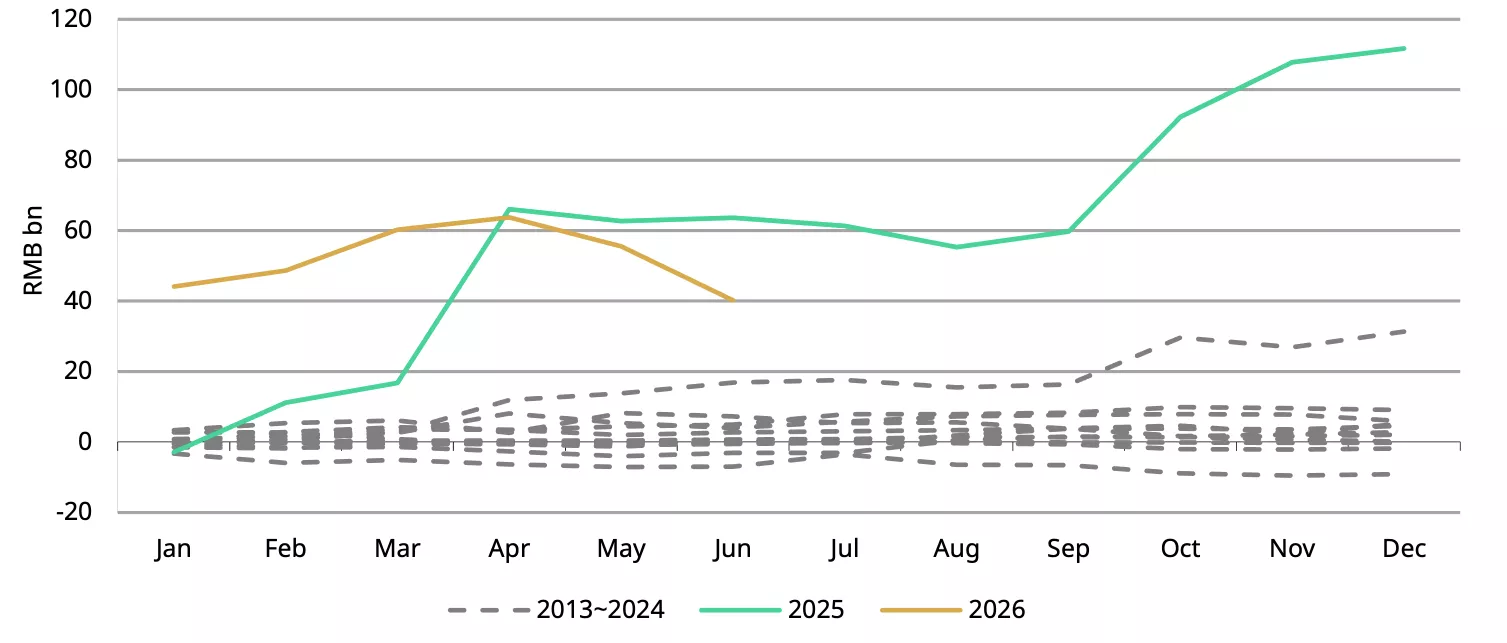
June weakness cut Chinese gold ETFs’ y-t-d inflow to RMB40bn (US$5.6bn). Nonetheless, this is the second strongest H1 on record (Chart 2). In tonnage terms, H1 demand for gold ETFs in China totalled 29t and their total AUM rose slightly by 1%. Demand for gold ETFs stayed robust amid growing geopolitical and economic uncertainties, while the PBoC’s non-stop gold purchases continued to provide a supportive backdrop for sentiment. Institutional investor participation in Chinese gold ETFs has also risen, supporting demand for these products.
Chart 2: The second strongest H1 inflows on record
Chinese gold ETFs’ monthly cumulative flows*
*Data to 30 June 2026.
Source: Company filings, World Gold Council
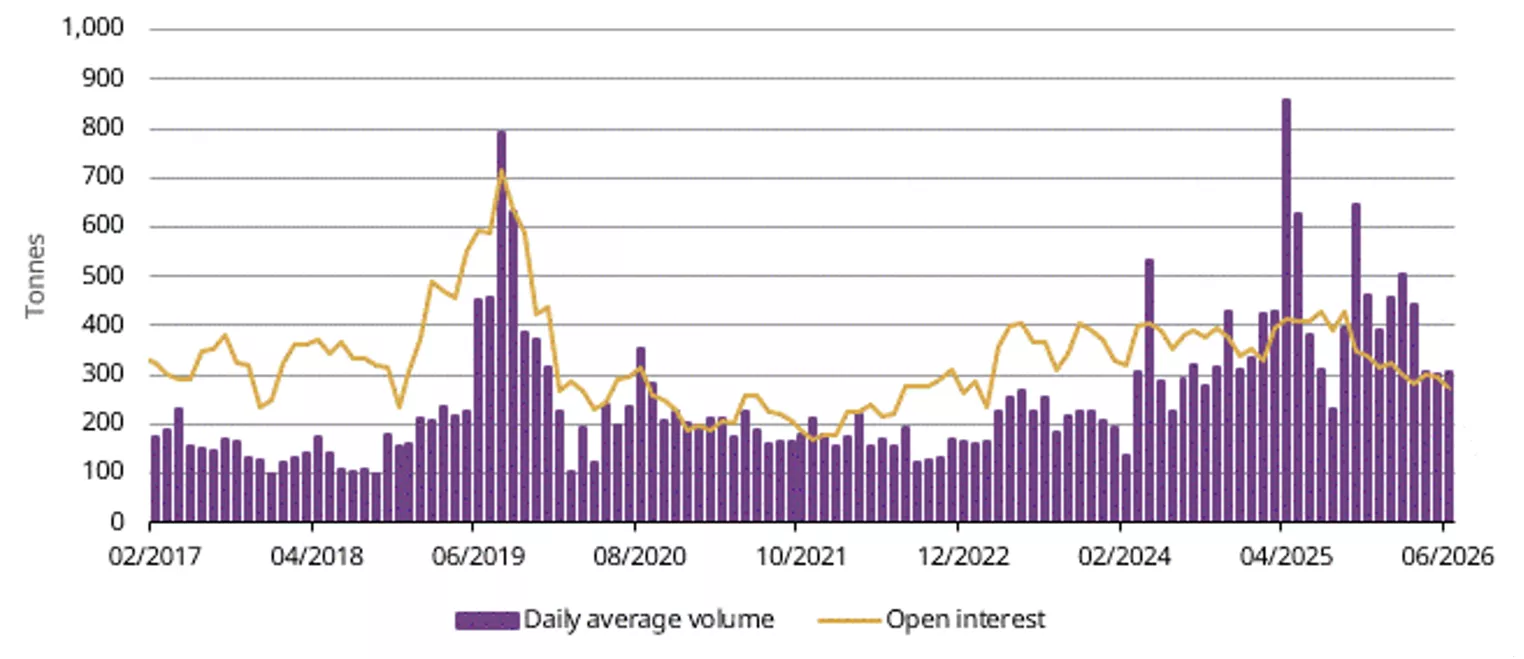
Gold futures trading volumes on the SHFE saw a mild m/m rebound of 4t in June, reaching 305t/day (Chart 3). While activities were below the 2025 level (457t per day), they remain well above the five-year average of 265t/day. Over the course of H1 Shanghai gold futures’ turnovers averaged 386t per day – the heightened price volatility as well as rising hedging needs from market participants provided some support, keeping overall volumes elevated.
Meanwhile, open interest in gold futures reached 274t by the end of June, an 8% decline in the month and 13% lower than the end-2025 level.
Chart 3: Gold futures volumes stayed elevated while open interests were down
Daily average trading volumes of SHFE gold futures and end-of-period open interests*
*As of 30 June 2026.
Source: Shanghai Futures Exchange, World Gold Council
Wholesale demand concluded H1 with a rebound
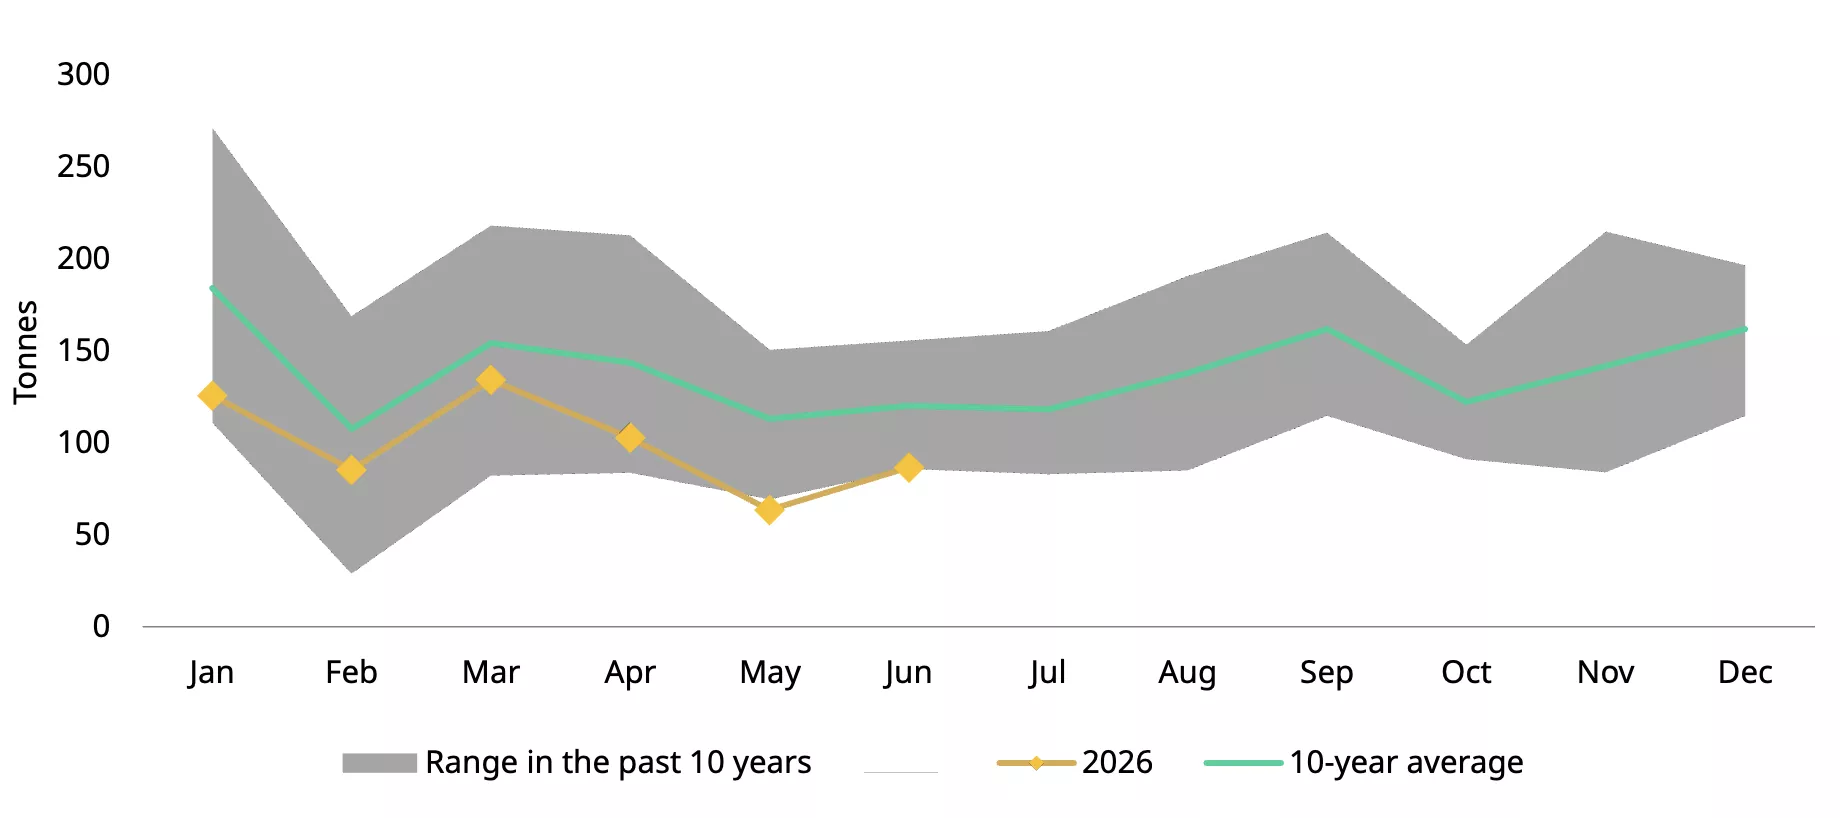
Gold withdrawals from the SGE rebounded in June, rising 36% m/m to 87t (Chart 4). The m/m recovery was mainly driven by opportunistic restocking across the supply chain as the gold price fell. Still-healthy bar and coin investment helped too, as retail investors bought on dip. A very low base – the weakest May in 16 years – also contributed to the m/m rebound. Nonetheless, wholesale demand in June remained close to the lowest level seen over the past decade amid ongoing weakness in the gold jewellery sector.
Market participants withdrew 598t of gold from the SGE during the first half, 12% lower y/y and 27% below the ten-year average. As noted previously, while bullion demand remained robust, sustained weakness in jewellery consumption made manufacturers and retailers cautious about replenishing, weighing on overall wholesale gold demand.
Chart 4: Wholesale demand rebounded in June yet stayed below the 10-year average
Gold withdrawals from the SGE by month and the ten-year monthly average*
*Ten-year average based on data between 2016 and 2025.
Source: Shanghai Gold Exchange, World Gold Council
The PBoC extends its gold purchasing streak
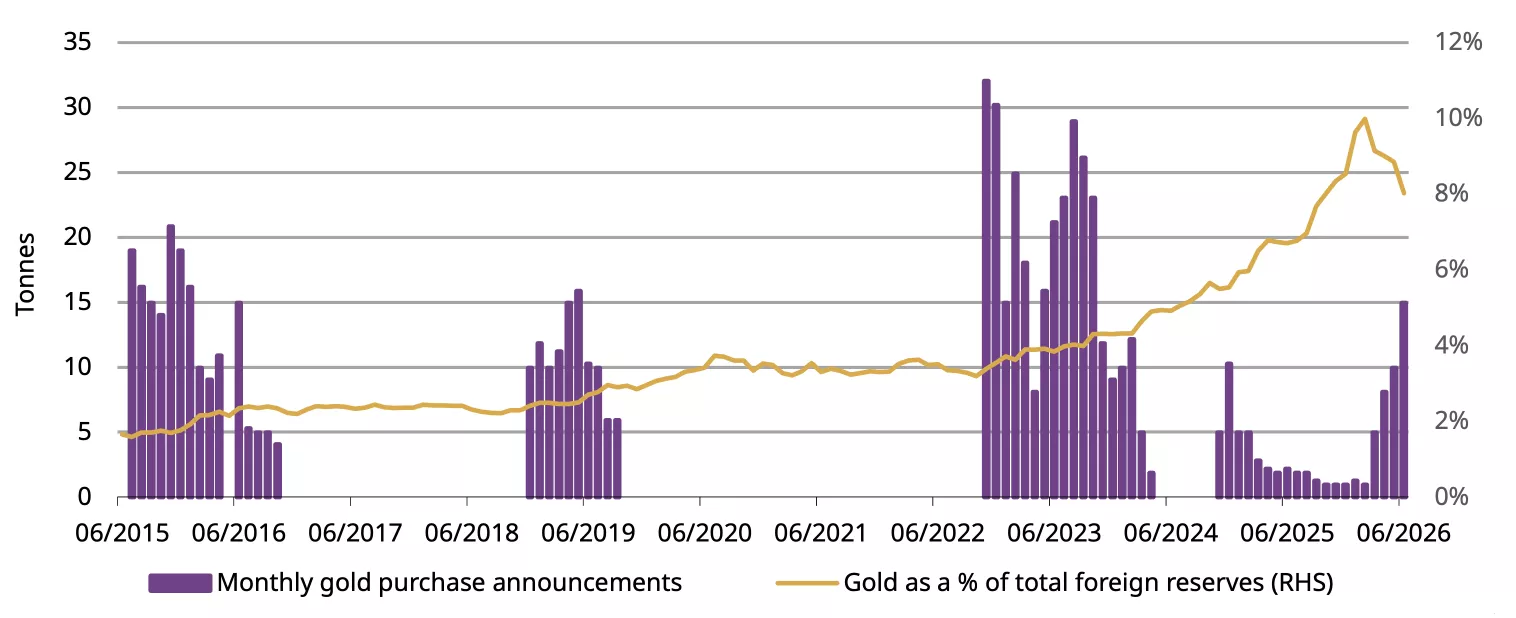
The PBoC reported a 15t gold purchase in June, the largest since October 2023 (Chart 5). China’s official gold holdings have now increased for 20 months in a row, the longest rising streak on record.3 June’s sizable addition pushed China’s gold reserves to 2,346t, 8% of total official foreign exchange assets.
Notably, purchases by the Chinese central bank went on throughout the first half despite the gold price volatility, accumulating a 40t increase in official gold holdings. Over the past 20 months the PBoC has announced total gold purchases of 82t. During this period global geopolitical tensions, trade orders and financial market volatilities have all heightened, highlighting gold’s strategic edge as a safe, credit risk-free and stable asset – proving that these attributes matter to global central banks, as our 2026 Central Bank Gold Survey shows.
Chart 5: A long streak of official gold purchases
The PBoC’s reported gold purchases and gold’s share of total foreign exchange reserves*
*Data to June 2026.
Source: State Administration of Foreign Exchanges, World Gold Council
Imports moderated in May
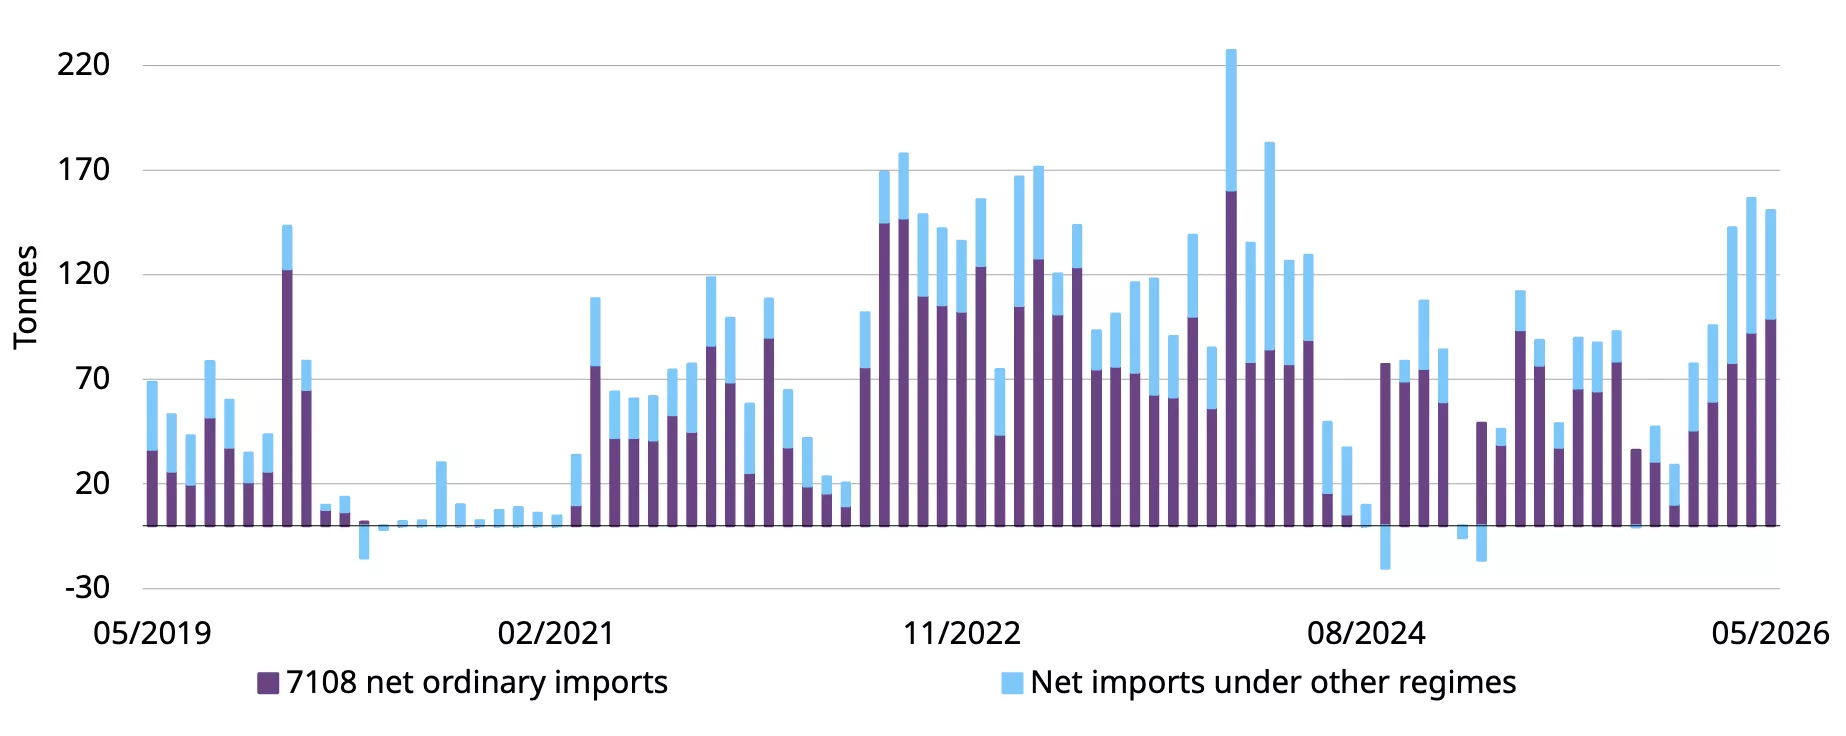
China imported 151t of gold in May (Chart 6) – latest data available, 6t lower m/m, reflecting weaker wholesale gold demand. But the amount is notably higher y/y as positive local gold price premiums continued to support importer interest.
Chart 6: Gold imports fell slightly in May
Net gold imports under HS7108*
*Data to May 2026.
Source: China Customs, World Gold Council
Footnotes
1For more, see: Gold Return Attribution Model | World Gold Council.
2For more, see: 6月,A股新开户人数大增!
3Due to data availability, public data records date back to January 1979.
Disclaimer
Important information and disclaimers
© 2026 World Gold Council. All rights reserved. World Gold Council and the Circle device are trademarks of the World Gold Council or its affiliates.
All references to LBMA Gold Price are used with the permission of ICE Benchmark Administration Limited and have been provided for informational purposes only. ICE Benchmark Administration Limited accepts no liability or responsibility for the accuracy of the prices or the underlying product to which the prices may be referenced. Other content is the intellectual property of the respective third party and all rights are reserved to them.
Reproduction or redistribution of any of this information is expressly prohibited without the prior written consent of World Gold Council or the appropriate copyright owners, except as specifically provided below. Information and statistics are copyright © and/or other intellectual property of the World Gold Council or its affiliates or third-party providers identified herein. All rights of the respective owners are reserved.
The use of the statistics in this information is permitted for the purposes of review and commentary (including media commentary) in line with fair industry practice, subject to the following two pre-conditions: (i) only limited extracts of data or analysis be used; and (ii) any and all use of these statistics is accompanied by a citation to World Gold Council and, where appropriate, to Metals Focus or other identified copyright owners as their source. World Gold Council is affiliated with Metals Focus.
The World Gold Council and its affiliates do not guarantee the accuracy or completeness of any information nor accept responsibility for any losses or damages arising directly or indirectly from the use of this information.
This information is for educational purposes only and by receiving this information, you agree with its intended purpose. Nothing contained herein is intended to constitute a recommendation, investment advice, or offer for the purchase or sale of gold, any gold-related products or services or any other products, services, securities or financial instruments (collectively, “Services”). This information does not take into account any investment objectives, financial situation or particular needs of any particular person.
Diversification does not guarantee any investment returns and does not eliminate the risk of loss. Past performance is not necessarily indicative of future results. The resulting performance of any investment outcomes that can be generated through allocation to gold are hypothetical in nature, may not reflect actual investment results and are not guarantees of future results. The World Gold Council and its affiliates do not guarantee or warranty any calculations and models used in any hypothetical portfolios or any outcomes resulting from any such use. Investors should discuss their individual circumstances with their appropriate investment professionals before making any decision regarding any Services or investments.
This information may contain forward-looking statements, such as statements which use the words “believes”, “expects”, “may”, or “suggests”, or similar terminology, which are based on current expectations and are subject to change. Forward-looking statements involve a number of risks and uncertainties. There can be no assurance that any forward-looking statements will be achieved. World Gold Council and its affiliates assume no responsibility for updating any forward-looking statements.
Information regarding the LBMA Gold Price
The LBMA Gold Price is used by the World Gold Council with permission under license by ICE Benchmark Administration Limited and is subject to the restrictions set forth here (www.gold.org/terms-and-conditions).
Information regarding QaurumSM and the Gold Valuation Framework
Note that the resulting performance of various investment outcomes that can be generated through use of Qaurum, the Gold Valuation Framework and other information are hypothetical in nature, may not reflect actual investment results and are not guarantees of future results. Neither World Gold Council (including its affiliates) nor Oxford Economics provides any warranty or guarantee regarding the functionality of the tool, including without limitation any projections, estimates or calculations.
Information from ICRA Analytics Limited
All information obtained from ICRA Analytics Limited contained in this document is subject to the disclaimer set forth here (www.icraanalytics.com/terms-of-use/disclaimer).
