China gold market update: November demand feels the VAT reform
12 December, 2025
Highlights
- Gold rose further: The LBMA Gold Price PM in USD saw its sixth monthly gain whilst the Shanghai Benchmark Gold Price PM (SHAUPM) in RMB rose for the fifth consecutive month
- Wholesale gold demand fell 32% m/m to 84t in November amid weakness in the gold jewellery sector
- Chinese gold ETFs continued to see sizable inflows, attracting RMB16bn (US$2.2bn, 17t); gold futures volumes at the Shanghai Futures Exchange (SHFE) fell alongside the falling gold price volatility
- The People’s Bank of China (PBoC) reported its 13th consecutive monthly gold purchase: it added another 0.9t in November, lifting its total to 2,305t, 8.3% of China’s foreign exchange reserves.
Looking ahead
- The recent VAT reform has accelerated consolidation in the gold jewellery industry, hampering consumption and, in all probability, continuing to hurt sales in the near future. But we believe by forcing out stores with weak financial strength and product power, the industry will be leaner, healthier. And that jewellers that will re-focus efforts on the “jewellery” aspect of gold jewellery.
- Investment momentum has been notable over recent months and previous drivers, including changes in local equity performance, geopolitical tensions and the gold price, will continue to be key. Two trends are relatively certain: bullion sales will be more concentrated in SGE member channels, and ‘would-be’ gold jewellery buyers with investment motives will migrate to investment products in the face of higher tax burdens on gold jewellery.
Gold kept climbing
Global gold prices continued to trend up (Chart 1). Intensifying investor expectations of a Fed rate cut in December, among other factors, lifted gold. The LBMA Gold Price PM in USD was 4.5% higher in November (+61% y-t-d) and the Shanghai Benchmark Gold Price PM (SHAUPM) in RMB climbed 3% (+54% y-t-d) – the appreciating RMB against the dollar and weakening local demand limited its gain.
Chart 1: Global gold prices kept climbing in November
Monthly returns of the SHAUPM in RMB and LBMA Gold Price PM in USD*
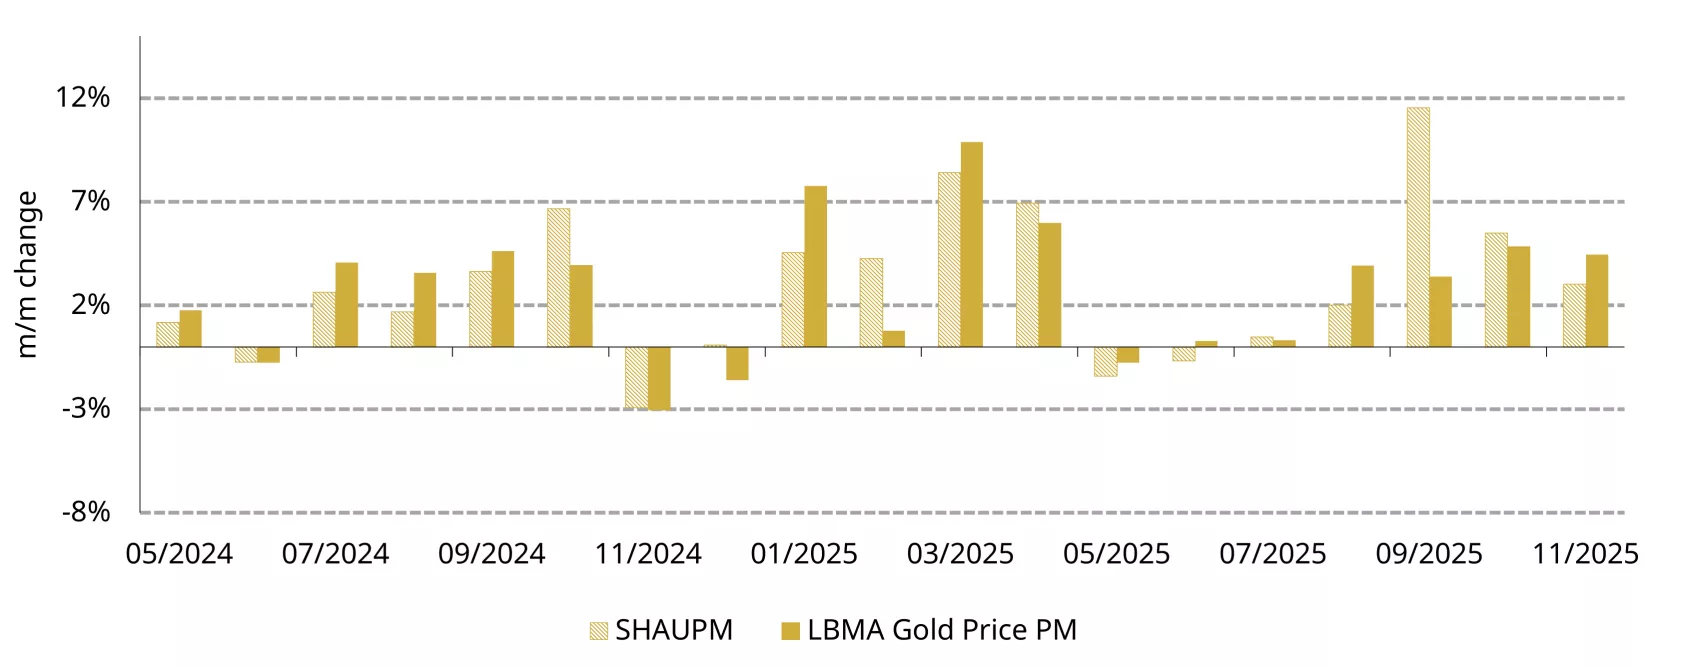
*Data to 30 November 2025.
Source: Shanghai Gold Exchange, World Gold Council
Wholesale gold demand weakened by the recent VAT change
Gold withdrawals from the SGE – a proxy for wholesale gold demand in China – fell 32% m/m and 15% y/y to 84t last month (Chart 2), the weakest November since 2009. Historical patterns suggest gradual pick ups in wholesale gold demand after October, yet November this year showed unseasonable weakness. This is likely due mainly to a significantly weakened gold jewellery sector: impacted by the recent VAT reform, rising gold jewellery costs have deterred consumers and subdued retailer restocking activity – as detailed in our blog.
In contrast, bullion sales from SGE member channels – which are not impacted by the VAT change – stayed healthy in the month, although insufficiently to offset jewellery weakness. We believe investment strength comes from:
- Previous gold jewellery buyers with investment motives who are turning to gold bars and coins in the face of additional tax burdens
- Rising safe-haven demand amid intensifying geopolitical tensions between China and Japan, as well as local equity pullbacks
- Gold’s continued price strength
- The PBoC’s consistent record of gold purchases.
Chart 2: Wholesale gold demand weakened in November
Monthly gold withdrawals from the SGE*
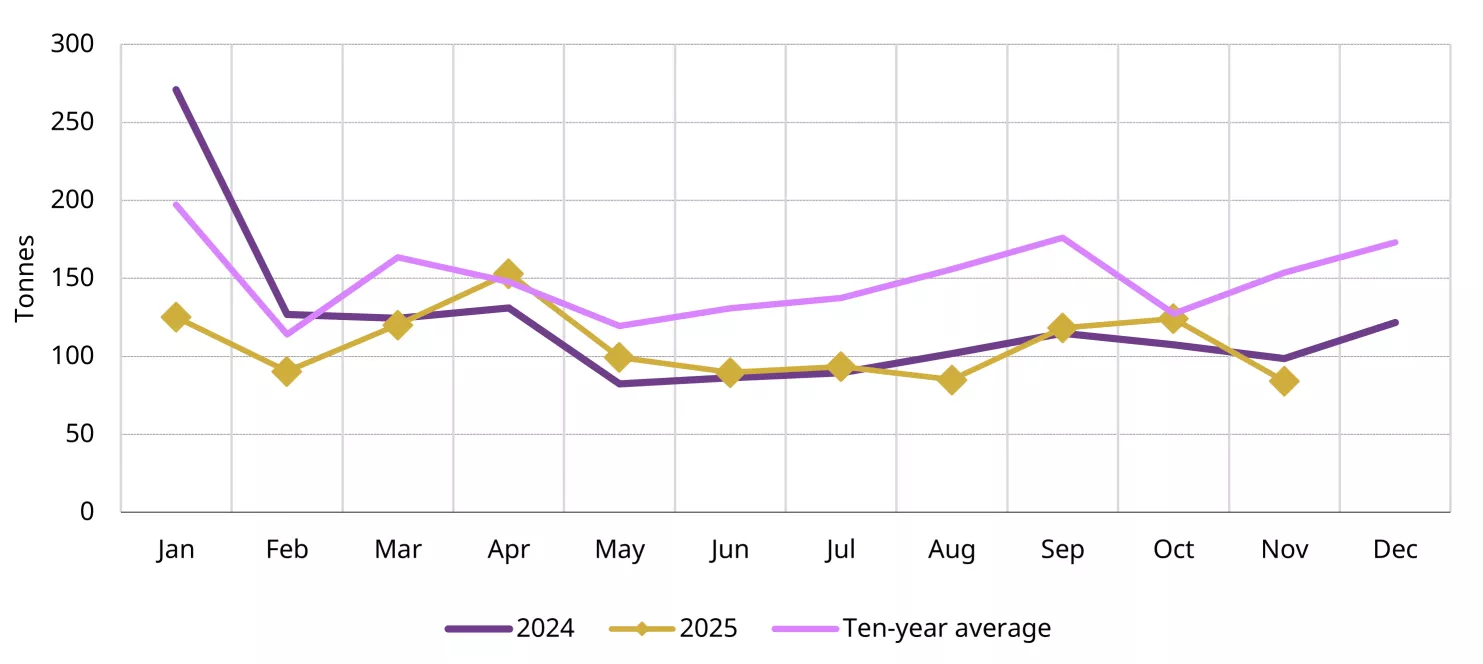
*The 10-year average is based on data between 2015 and 2024.
Source: Shanghai Gold Exchange, World Gold Council
Chinese investors continue to buy gold ETFs at pace
Chinese gold ETFs attracted RMB16bn (US$2.2bn, 17t) in November, their third consecutive monthly inflow and well above the 2024 monthly average of RMB2.6bn. Chinese gold ETFs’ total AUM rose 10% m/m to RMB231bn (US$29bn) whilst holdings climbed 7% to 244t, both refreshing their month-end records (Chart 3). We believe this gold ETF buying strength was driven by similar factors to those supporting bullion sales, as noted above.
Chart 3: Chinese gold ETF demand remained elevated in November
Monthly Chinese gold ETF demand and month-end holdings*
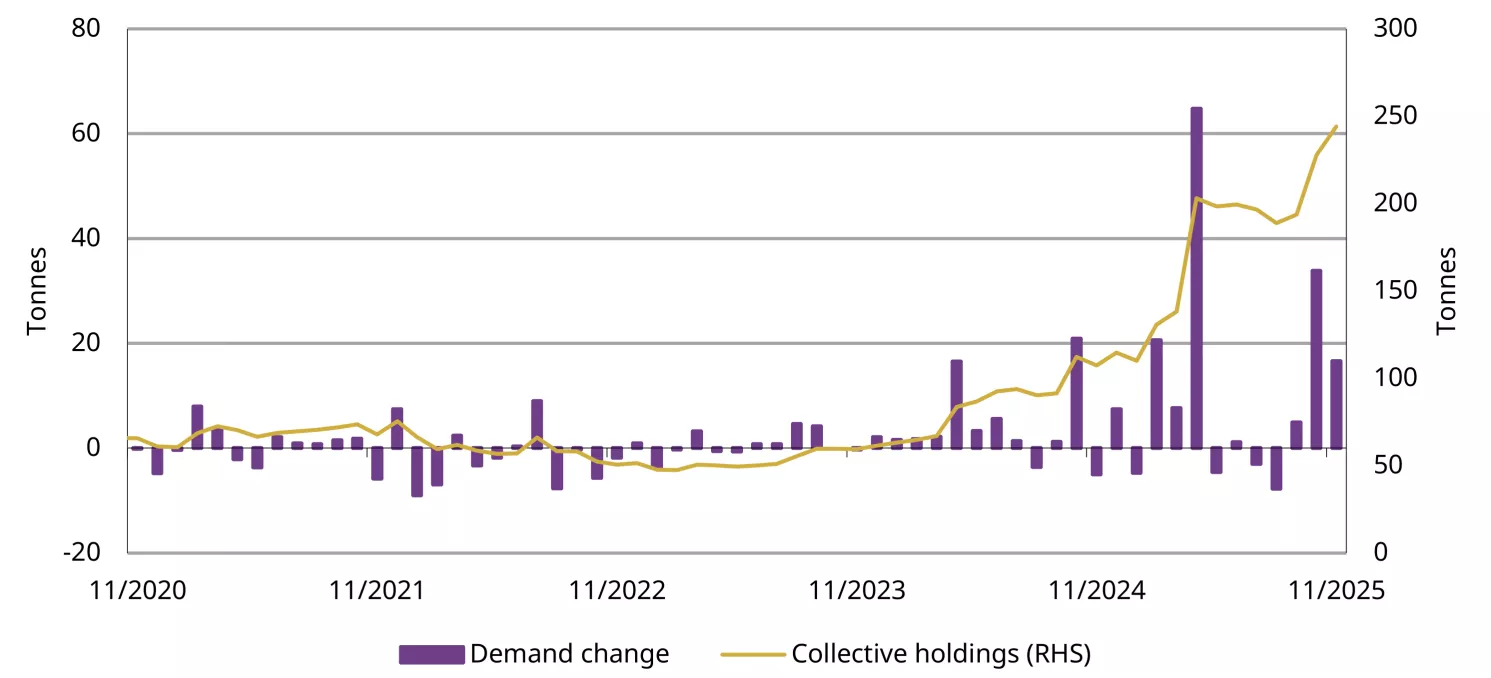
*Data to 30 November 2025.
Source: Company filings, World Gold Council
Gold futures trading volumes fell 29% m/m to 461t/day on average in November – mainly due to the lower gold price volatility. Despite the pullback, volumes remain well above the 2024 average of 302t/day (Chart 4). So far in 2025 gold futures volumes have averaged 463t/day, notably higher than the five-year average of 216t/day between 2020 and 2024.
Chart 4: Gold futures volumes pulled back m/m yet stayed elevated
Daily average trading volumes of SHFE gold futures and monthly gold price volatility*
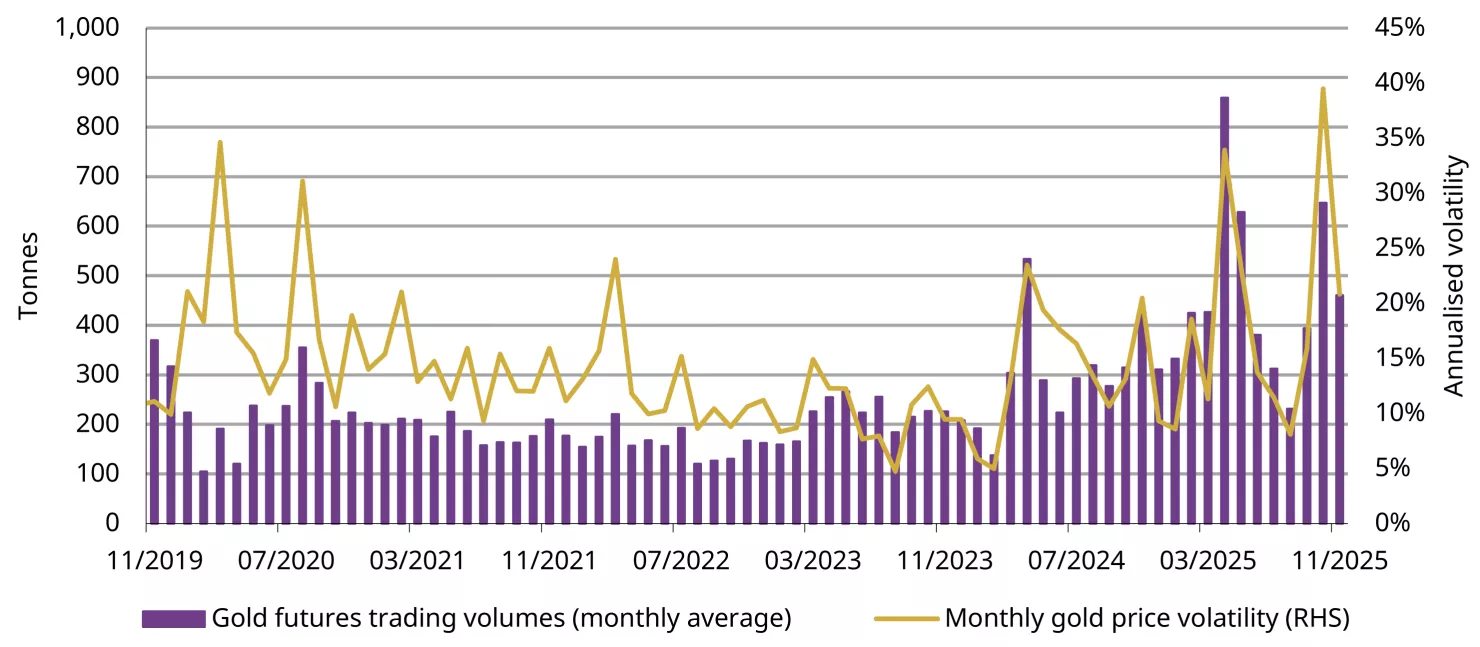
*As of 30 November 2025. The monthly gold price volatility is based on the daily gold price change in the active SHFE gold futures.
Source: Shanghai Futures Exchange, World Gold Council
China’s gold reserves rose further
The PBoC announced a 0.9t addition to China’s official gold holdings in November (Chart 5), pushing the total to 2,305t. Y-t-d China has reported 26t of official gold purchases, lifting gold’s share in the country’s total foreign exchange reserves from 5.5% in December 2024 to 8.3% in November this year – supported by the central bank’s continued accumulation and the gold price surge.
Chart 5: The PBoC’s gold purchasing streak extended to 13 months
The PBoC’s reported gold holdings and their share of total foreign exchange reserves*
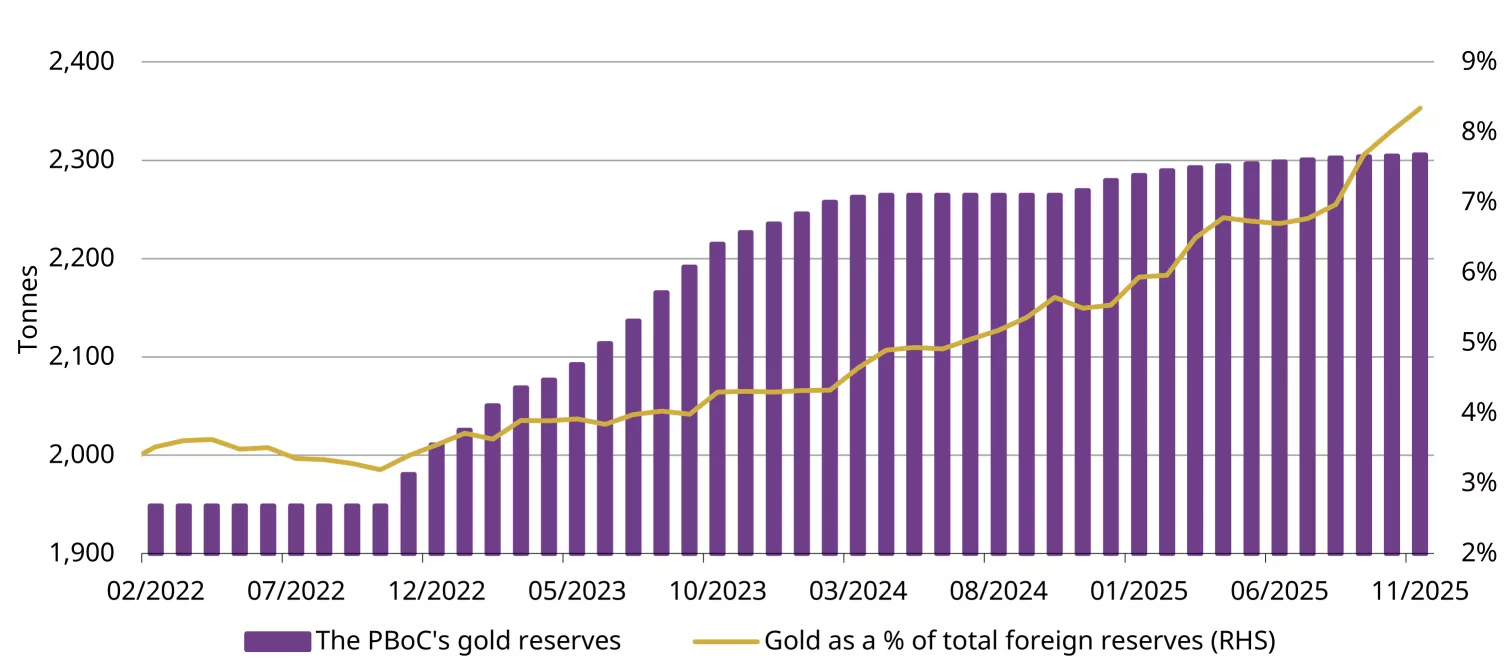
*Data to November 2025. Gold’s share calculated based on the value terms of gold and the total foreign exchange reserves as shown here: 官方储备资产(2025年)_外汇储备_国家外汇管理局门户网站
Source: State Administration of Foreign Exchanges, World Gold Council
Imports fell in October
On a net basis China imported 36t of gold in October (Chart 6), 57t lower m/m and 43t down y/y. Fewer working days weighed on imports amid the eight-day National Day Holiday and Mid-Autumn Festival. In addition, the Shanghai-London gold price spread was negative for half of the month, further deterring importers. And the general weakness in the gold jewellery sector so far this year has kept imports low compared to previous years.
Chart 6: Gold imports fell notably in October
Net 7108 gold imports under various regimes*
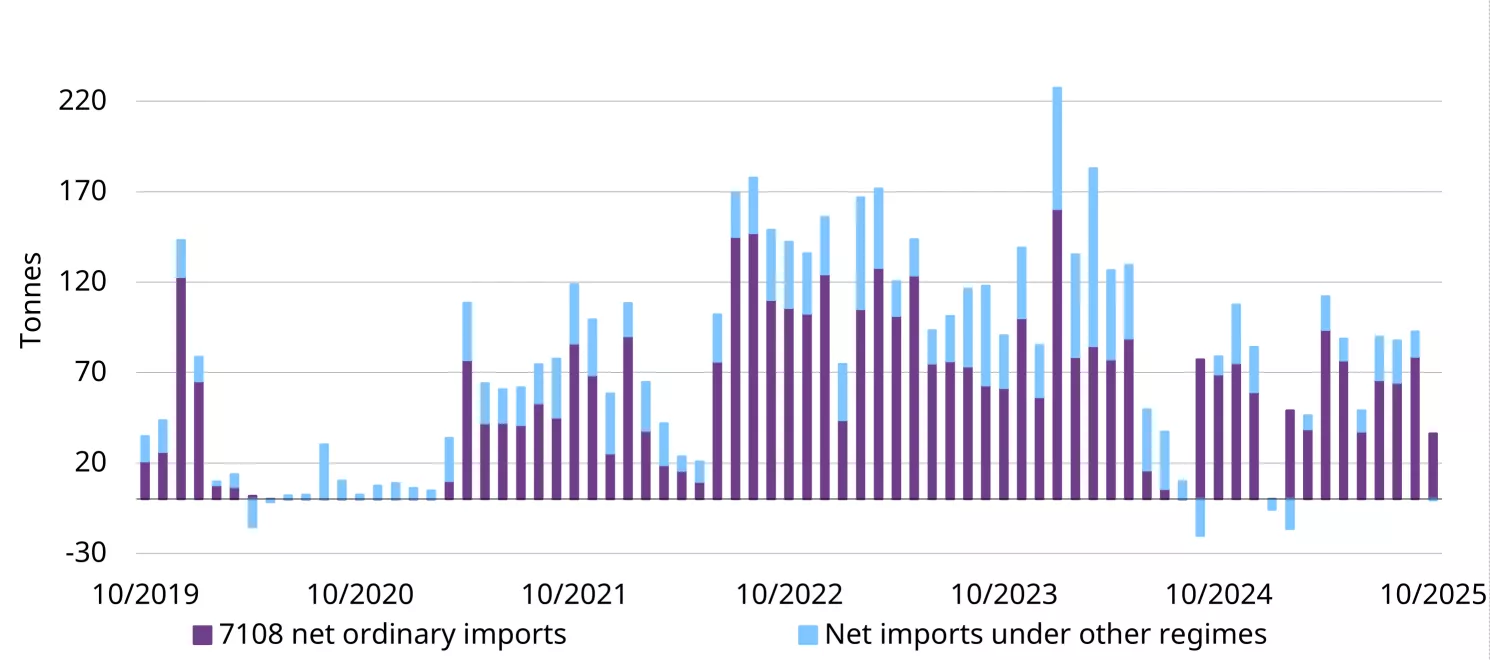
*Based on the latest data available. Data to October 2025.
Source: China Customs, World Gold Council
Disclaimer
Important information and disclaimers
© 2025 World Gold Council. All rights reserved. World Gold Council and the Circle device are trademarks of the World Gold Council or its affiliates.
All references to LBMA Gold Price are used with the permission of ICE Benchmark Administration Limited and have been provided for informational purposes only. ICE Benchmark Administration Limited accepts no liability or responsibility for the accuracy of the prices or the underlying product to which the prices may be referenced. Other content is the intellectual property of the respective third party and all rights are reserved to them.
Reproduction or redistribution of any of this information is expressly prohibited without the prior written consent of World Gold Council or the appropriate copyright owners, except as specifically provided below. Information and statistics are copyright © and/or other intellectual property of the World Gold Council or its affiliates or third-party providers identified herein. All rights of the respective owners are reserved.
The use of the statistics in this information is permitted for the purposes of review and commentary (including media commentary) in line with fair industry practice, subject to the following two pre-conditions: (i) only limited extracts of data or analysis be used; and (ii) any and all use of these statistics is accompanied by a citation to World Gold Council and, where appropriate, to Metals Focus or other identified copyright owners as their source. World Gold Council is affiliated with Metals Focus.
The World Gold Council and its affiliates do not guarantee the accuracy or completeness of any information nor accept responsibility for any losses or damages arising directly or indirectly from the use of this information.
This information is for educational purposes only and by receiving this information, you agree with its intended purpose. Nothing contained herein is intended to constitute a recommendation, investment advice, or offer for the purchase or sale of gold, any gold-related products or services or any other products, services, securities or financial instruments (collectively, “Services”). This information does not take into account any investment objectives, financial situation or particular needs of any particular person.
Diversification does not guarantee any investment returns and does not eliminate the risk of loss. Past performance is not necessarily indicative of future results. The resulting performance of any investment outcomes that can be generated through allocation to gold are hypothetical in nature, may not reflect actual investment results and are not guarantees of future results. The World Gold Council and its affiliates do not guarantee or warranty any calculations and models used in any hypothetical portfolios or any outcomes resulting from any such use. Investors should discuss their individual circumstances with their appropriate investment professionals before making any decision regarding any Services or investments.
This information may contain forward-looking statements, such as statements which use the words “believes”, “expects”, “may”, or “suggests”, or similar terminology, which are based on current expectations and are subject to change. Forward-looking statements involve a number of risks and uncertainties. There can be no assurance that any forward-looking statements will be achieved. World Gold Council and its affiliates assume no responsibility for updating any forward-looking statements.
Information regarding QaurumSM and the Gold Valuation Framework
Note that the resulting performance of various investment outcomes that can be generated through use of Qaurum, the Gold Valuation Framework and other information are hypothetical in nature, may not reflect actual investment results and are not guarantees of future results. Neither World Gold Council (including its affiliates) nor Oxford Economics provides any warranty or guarantee regarding the functionality of the tool, including without limitation any projections, estimates or calculations.
