China gold market update: Strong investment in H1
16 July, 2025
Highlights
- Despite a tepid June, both the LBMA Gold Price PM in USD and the Shanghai Benchmark Gold Price PM (SHAUPM) in RMB saw their strongest H1 performances for nine years
- Gold withdrawals from the Shanghai Gold Exchange (SGE) fell further in June, ending H1 with a 18% y/y fall
- A positive June concluded the largest semi-annual inflow ever in Chinese gold ETFs, with RMB64bn (US$8.8bn) added in H1
- Gold futures trading volumes at the Shanghai Futures Exchange (SHFE) also surged during the first half
- China’s official gold holdings have now risen for eight consecutive months, pushing the People’s Bank of China (PBoC)’s H1 reported gold purchase to 19t
- Imports in May, based on the latest data, fell m/m, mirroring local gold demand trends.
Looking ahead
- Tepid consumer confidence and industry consolidation may continue to weigh on gold jewellery demand. Meanwhile, investment demand for gold could stay healthy going forward. For more, stay tuned for our Q2 Gold Demand Trends later this month.
Gold consolidation continues but H1 strength intact
Gold prices saw limited moves in June. The LBMA Gold Price PM in USD climbed 0.3% while the SHAUPM in RMB fell mildly by 0.7% – due mainly to a stronger local currency against the dollar.
Nonetheless, the LBMA Gold Price in USD and the SHAUPM in RMB concluded H1 with their strongest performances since 2016, surging 23% and 21% respectively (Chart 1). Based on our Gold Return Attribution Model, geopolitical risks and a weaker dollar were notable contributors to the gold price strength. Meanwhile, we believe continued central bank purchases further aided gold.
Chart 1: Gold saw its best H1 performance in both RMB and USD since 2016
H1 returns of the SHAUPM in RMB and the LBMA Gold Price PM in USD*
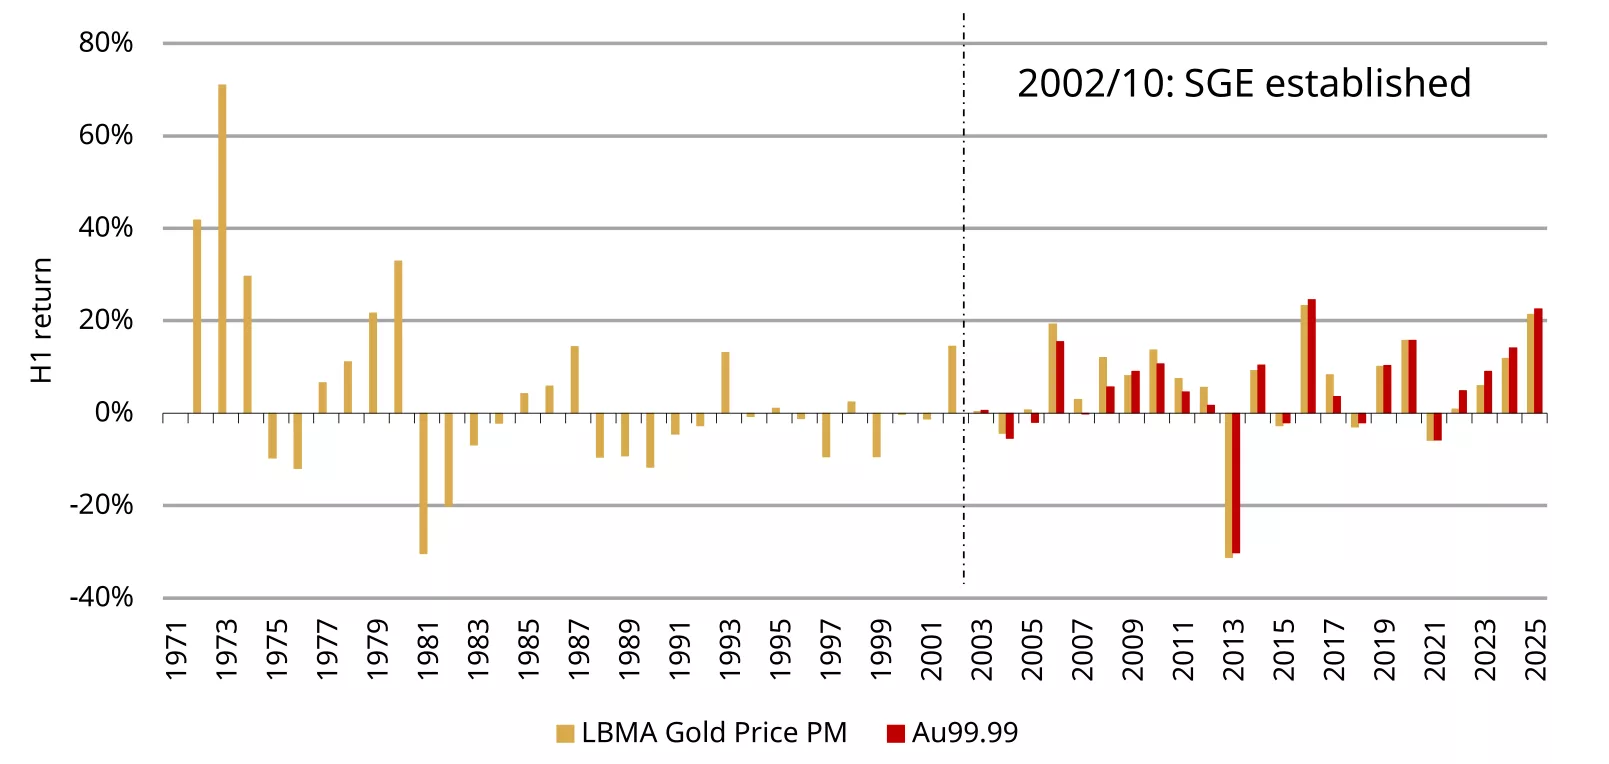
*Data as of 30 June 2025.
Source: Bloomberg, World Gold Council
Wholesale demand stayed weak
China’s wholesale gold demand slowed further in June. Jewellery manufacturers, commercial banks and other market participants withdrew 90t during the month, 10% lower m/m. And while there was a mild 4% rise compared to a weak June in 2024, the month’s wholesale gold demand stayed well below its 10-year average (Chart 2).
Seasonal weakness, still tepid consumer confidence and the elevated gold price continued to pressure gold jewellery consumption, leading to a cautious stance from retailers on restocking. Added to this was June’s cooling momentum in bar and coin investment as investors sat on the sidelines amid the range-bound gold price movement.
Chart 2: Wholesale gold demand weakened further in June*
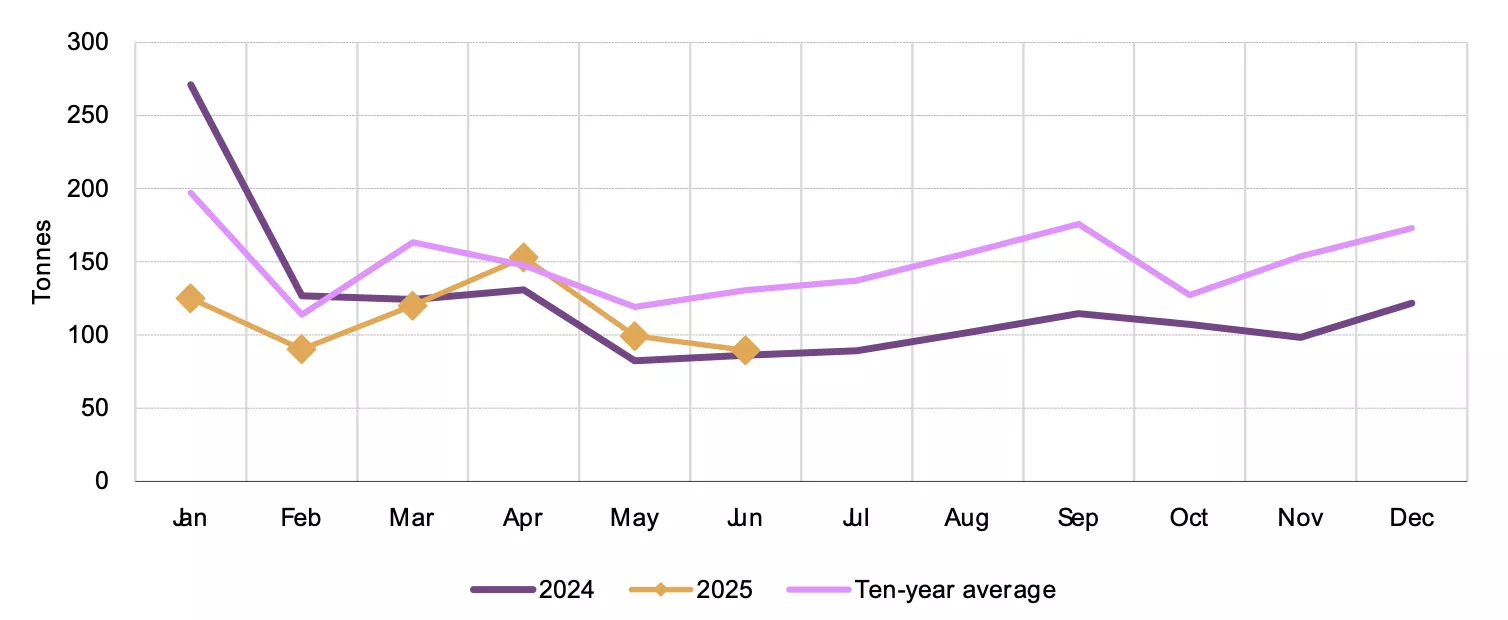
*The ten-year average is based on data between 2015 and 2024.
Source: Shanghai Gold Exchange, World Gold Council
During the first half of 2025 gold withdrawals from the SGE reached 678t (Chart 3), 18% lower y/y and 22% below the ten-year average. Jewellery demand has weakened amid the surging gold price, cautious consumer spending, and the industry’s continued consolidation. But jeweller sector’s weakness was partially offset by investment strength: the gold price rally, rising safe-haven demand – amid spiking US-China trade tensions particularly in April – and tepid performances of other domestic assets supported bar and coin sales.
Chart 3: SGE gold withdrawals in H1 stayed below the long-term average*
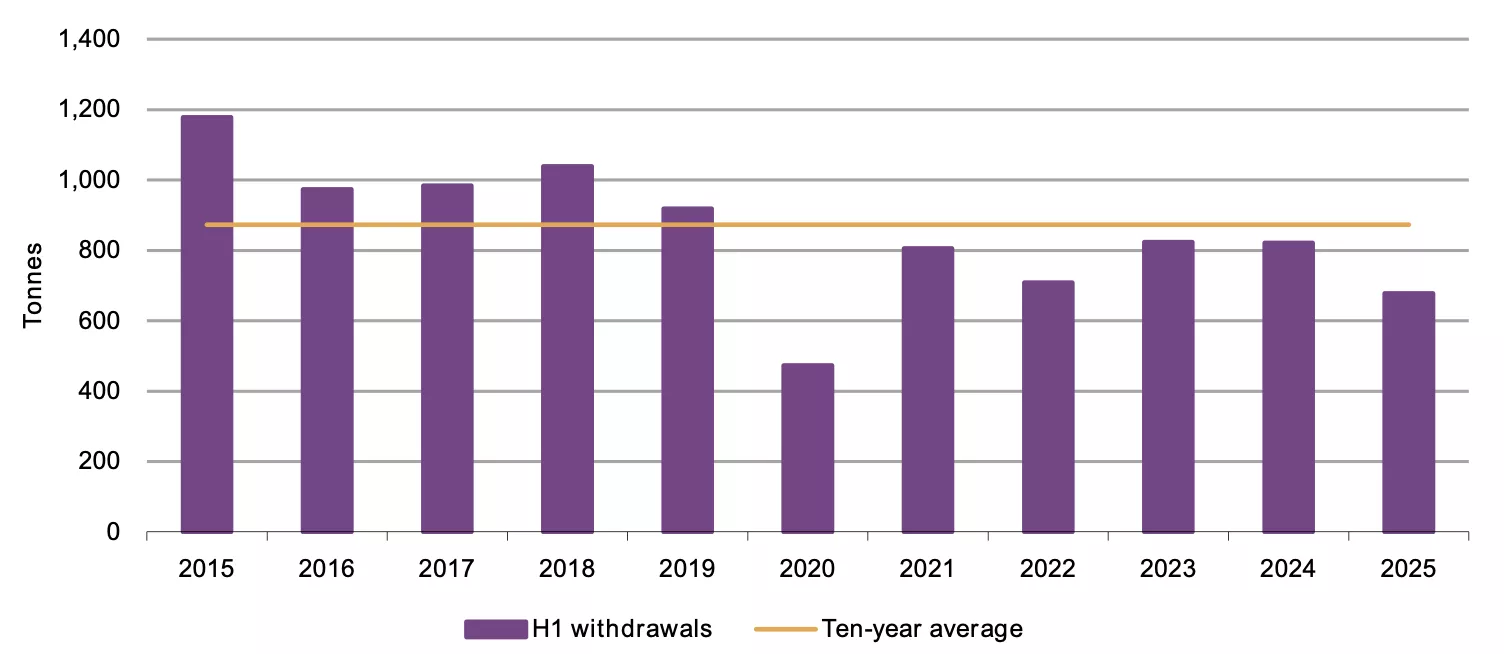
*The ten-year average is based on data between 2015 and 2024.
Source: Shanghai Gold Exchange, World Gold Council
June concludes the strongest H1 for China’s gold ETF demand
Chinese gold ETF flows turned positive in June, attracting RMB1bn (US$137mn) (Chart 4). With the US-China trade tensions easing and the RMB strengthening, safe-haven demand for gold cooled, resulting in limited changes in ETF flows.
During H1 Chinese gold ETFs registered their strongest semi-annual performance on record, adding RMB64bn (US$8.8bn). Inflows were driven by similar factors supported bar and coin sales noted above. Chinese gold ETFs’ total AUM surged 116% during the first half, reaching RMB153bn (US$21bn) by the end of June. Meanwhile, collective holdings jumped 74% to 200t.
Chart 4: Chinese gold ETF demand surged in H1 to the highest on record
Collective holdings and monthly demand for Chinese gold ETFs*
*As of 20 June 2025.
Source: Company filings, World Gold Council
Gold futures trading activity at the SHFE cooled in June (Chart 5), falling 39% m/m to 380t per day as the tepid price performance and narrowing volatility reduced trader interest.
Nonetheless, the SHFE gold futures trading volumes averaged 534t/day during H1, the highest semi-annual value on record, driven by factors already mentioned.
Chart 5: Average gold futures trading volumes in H1 reached the highest ever
Average semi-annual trading volumes of SHFE gold futures*
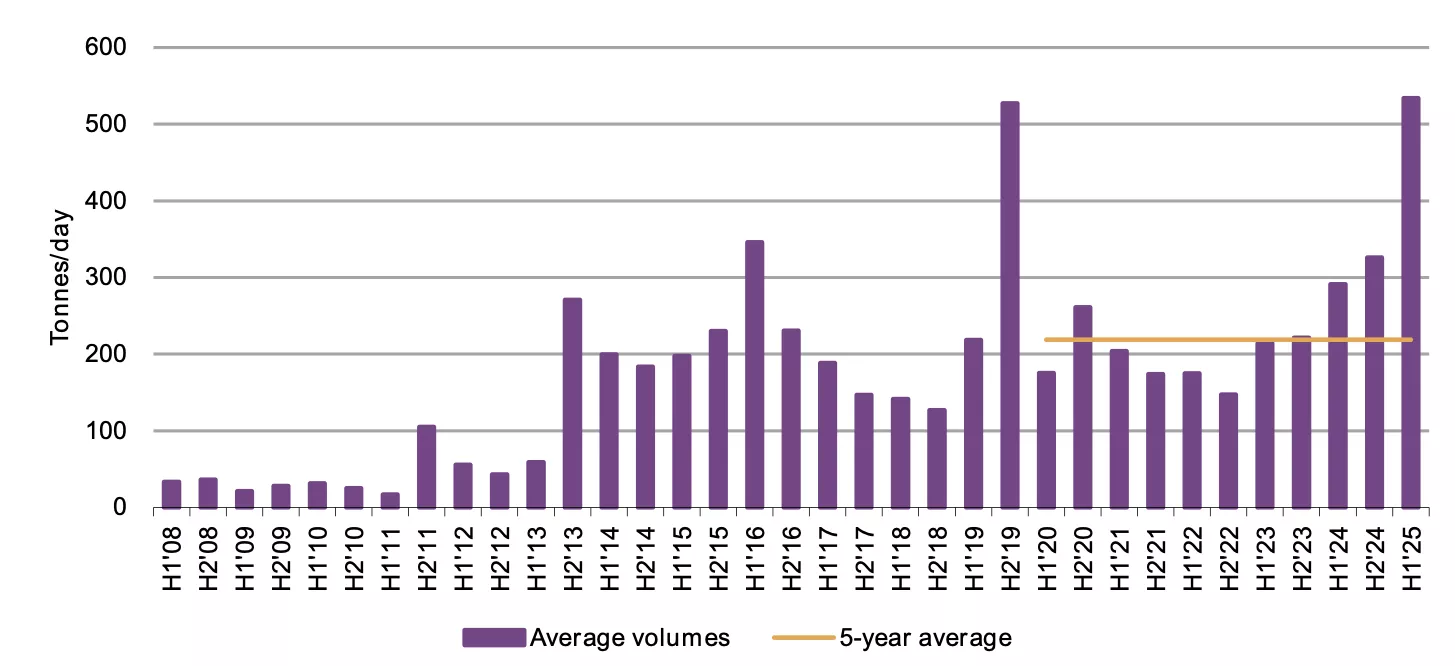
*As of 30 June 2025.
Source: Shanghai Futures Exchange, World Gold Council
Non-stop PBoC gold purchase in H1
The PBoC reported a 2t gold purchase in June, the eighth consecutive monthly increase. China’s official gold holdings now stand at 2,299t (Chart 6).
China has announced non-stop gold purchases – of varying amounts – during the first half of 2025, totalling 19t. During this period, gold’s share of China’s total foreign exchange reserves rose from 5.5% in December 2024 to 6.7% at the end of June.
Chart 6: China’s official gold holdings have now risen for eight months in a row
Reported official gold holdings and gold as a percentage of total foreign exchange reserves*
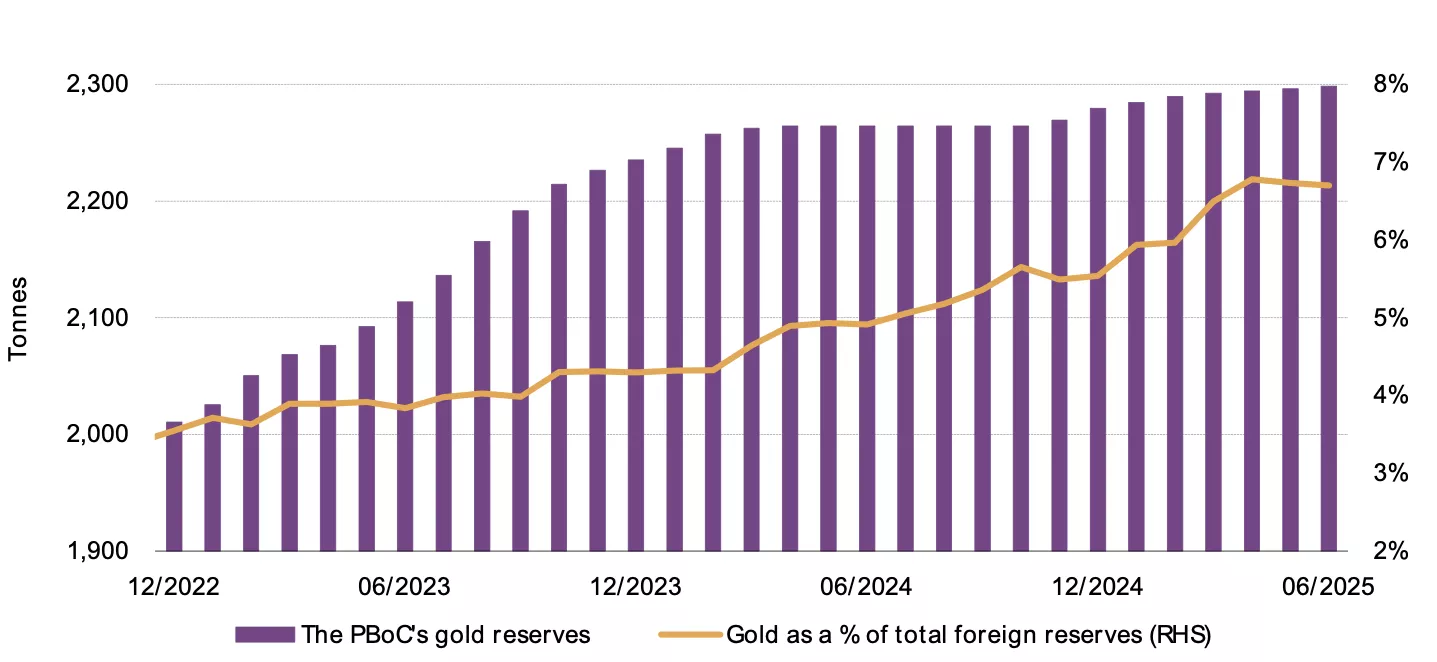
* As of 30 June 2025.
Source: State Administration of Foreign Exchange, World Gold Council
Imports lowered in May
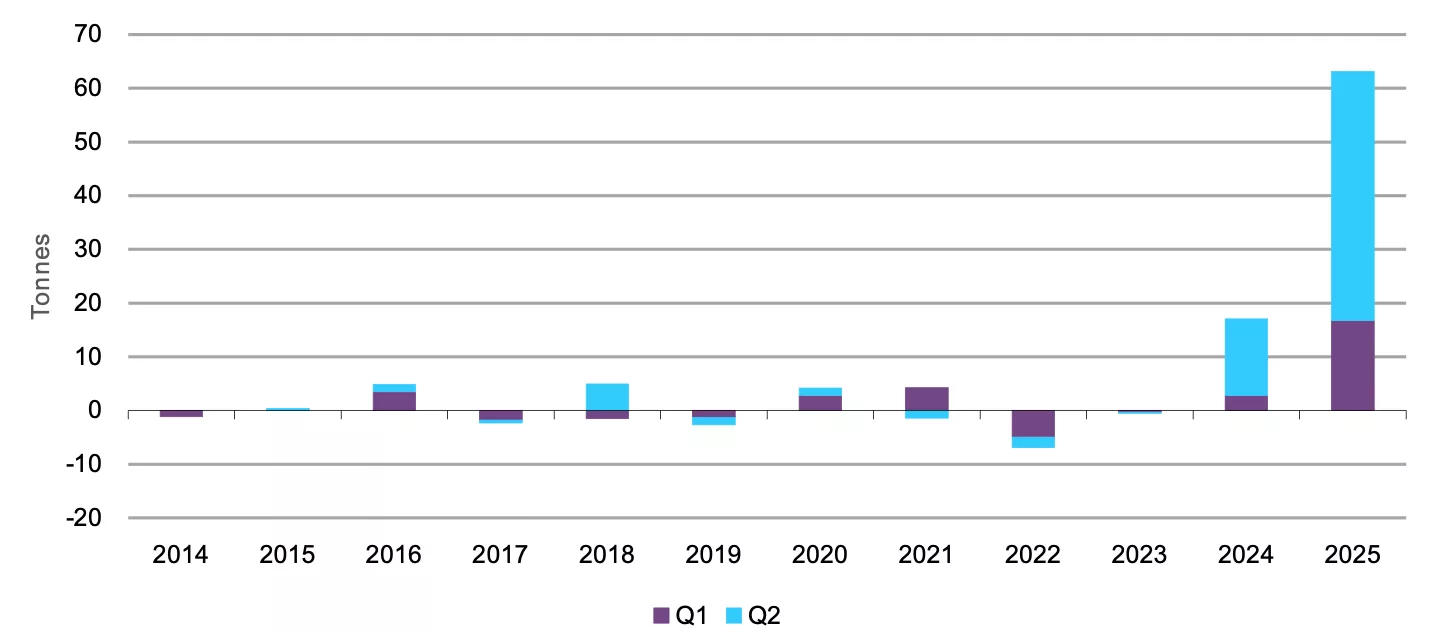
China imported 89t of gold in May on a net basis, according to the latest data from China Customs, down 21% m/m and 31% y/y. Basically, this reflects wholesale demand trends in the month: gold withdrawals from the SGE in May saw a sizable m/m fall. In general, weakening gold jewellery demand so far this year has weighed heavily on imports.
Chart 7: Imports fell in May
7108 gold imports under various regimes*
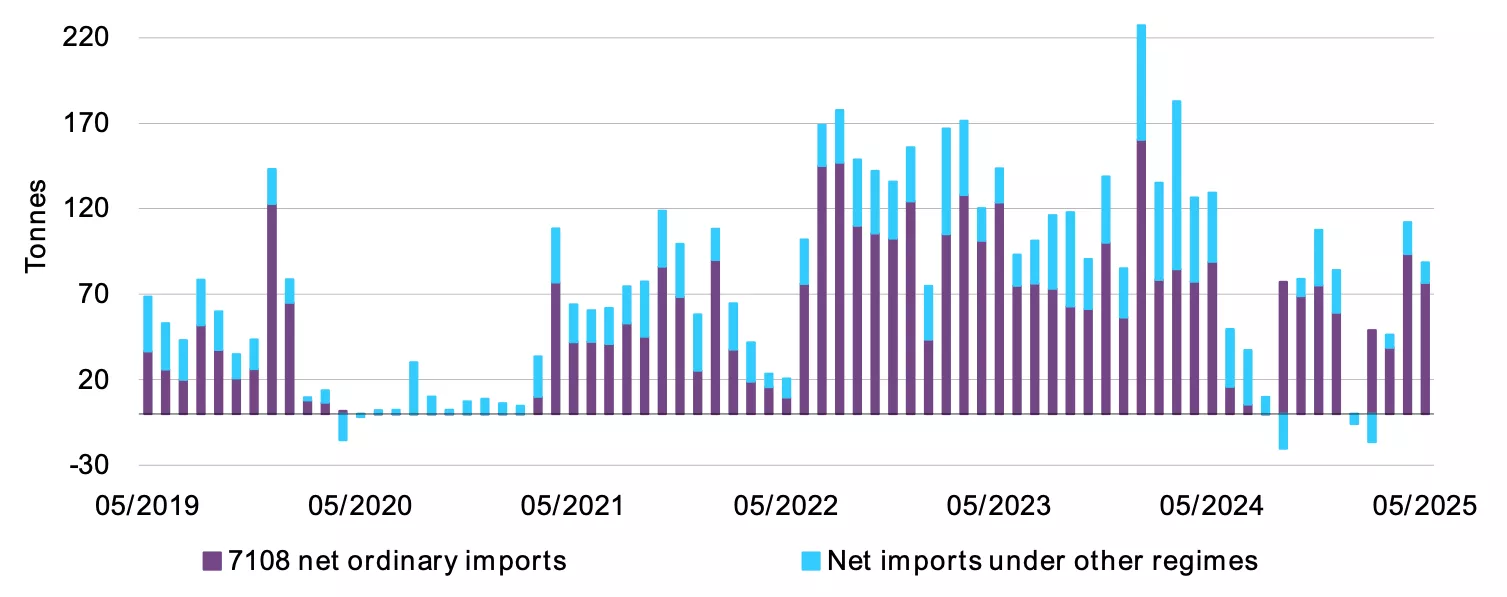
*Based on the latest data available. Data to May 2025.
Source: China Customs, World Gold Council
Disclaimer
Important information and disclaimers
© 2025 World Gold Council. All rights reserved. World Gold Council and the Circle device are trademarks of the World Gold Council or its affiliates.
All references to LBMA Gold Price are used with the permission of ICE Benchmark Administration Limited and have been provided for informational purposes only. ICE Benchmark Administration Limited accepts no liability or responsibility for the accuracy of the prices or the underlying product to which the prices may be referenced. Other content is the intellectual property of the respective third party and all rights are reserved to them.
Reproduction or redistribution of any of this information is expressly prohibited without the prior written consent of World Gold Council or the appropriate copyright owners, except as specifically provided below. Information and statistics are copyright © and/or other intellectual property of the World Gold Council or its affiliates or third-party providers identified herein. All rights of the respective owners are reserved.
The use of the statistics in this information is permitted for the purposes of review and commentary (including media commentary) in line with fair industry practice, subject to the following two pre-conditions: (i) only limited extracts of data or analysis be used; and (ii) any and all use of these statistics is accompanied by a citation to World Gold Council and, where appropriate, to Metals Focus or other identified copyright owners as their source. World Gold Council is affiliated with Metals Focus.
The World Gold Council and its affiliates do not guarantee the accuracy or completeness of any information nor accept responsibility for any losses or damages arising directly or indirectly from the use of this information.
This information is for educational purposes only and by receiving this information, you agree with its intended purpose. Nothing contained herein is intended to constitute a recommendation, investment advice, or offer for the purchase or sale of gold, any gold-related products or services or any other products, services, securities or financial instruments (collectively, “Services”). This information does not take into account any investment objectives, financial situation or particular needs of any particular person.
Diversification does not guarantee any investment returns and does not eliminate the risk of loss. Past performance is not necessarily indicative of future results. The resulting performance of any investment outcomes that can be generated through allocation to gold are hypothetical in nature, may not reflect actual investment results and are not guarantees of future results. The World Gold Council and its affiliates do not guarantee or warranty any calculations and models used in any hypothetical portfolios or any outcomes resulting from any such use. Investors should discuss their individual circumstances with their appropriate investment professionals before making any decision regarding any Services or investments.
This information may contain forward-looking statements, such as statements which use the words “believes”, “expects”, “may”, or “suggests”, or similar terminology, which are based on current expectations and are subject to change. Forward-looking statements involve a number of risks and uncertainties. There can be no assurance that any forward-looking statements will be achieved. World Gold Council and its affiliates assume no responsibility for updating any forward-looking statements.
Information regarding QaurumSM and the Gold Valuation Framework
Note that the resulting performance of various investment outcomes that can be generated through use of Qaurum, the Gold Valuation Framework and other information are hypothetical in nature, may not reflect actual investment results and are not guarantees of future results. Neither World Gold Council (including its affiliates) nor Oxford Economics provides any warranty or guarantee regarding the functionality of the tool, including without limitation any projections, estimates or calculations.
